City, University of London Institutional Repository
Citation
:
Constable, P. A., Gaigg, S. B., Bowler, D. M. and Thompson, D. A. (2012). Motion and pattern cortical potentials in adults with high-functioning autism spectrumdisorder. Documenta Ophthalmologica, 125(3), pp. 219-227. doi: 10.1007/s10633-012-9349-7
This is the accepted version of the paper.
This version of the publication may differ from the final published
version.
Permanent repository link:
http://openaccess.city.ac.uk/4222/Link to published version
:
http://dx.doi.org/10.1007/s10633-012-9349-7Copyright and reuse:
City Research Online aims to make research
outputs of City, University of London available to a wider audience.
Copyright and Moral Rights remain with the author(s) and/or copyright
holders. URLs from City Research Online may be freely distributed and
linked to.
City Research Online: http://openaccess.city.ac.uk/ [email protected]
1
Title Page:
Title of Paper
Motion and Pattern cortical potentials in adults with high functioning autism spectrum disorder
Authors:
Paul A Constable1,2,
Sebastian Gaigg2,
Dermot Bowler2,
Dorothy Thompson3
1 City University London, Division of Optometry, Northampton Square, London EC1V 0HB,
2City University London, Department of Psychology, Autism Research Group, Social Sciences
Building
Northampton Square London EC1V 0HB
3
Great Ormond Street Hospital for Children, London WC1N 3JH, UK, Clinical and Academic
Department of Ophthalmology.
Corresponding author address:
Paul Constable
Division of Optometry
City University
Northampton Square
London EC1V 0HB
Tel +44 (0)207 0404334
Fax +44 (0)207 040 8355
The author declares no conflict of interest.
This work was presented in oral format at the International Society for Clinical Electrophysiology
2
Abstract
Purpose:
Autism Spectrum Disorder (ASD) is a condition in which visual perception to
both static and moving stimuli is altered. The aim of this study was to investigate
the early cortical responses of subjects with ASD to simple patterns and moving
radial rings using visual evoked potentials (VEP).
Methods
Male ASD participants (n=9) and typically developing (TD) individuals (n=7)
were matched for full, performance and verbal IQ (p>0.263). VEPs were recorded
to the pattern reversing checks of 50’sidelength presented with Michelson
contrasts of 98% and 10% and to the onset of motion – either expansion or
contraction of low contrast concentric rings, (33.3% duty cycle at 10% contrast).
Results
There were no significant differences between groups in the VEPs elicited by
pattern reversal checkerboards of high (98%) or low (10%) contrast. The ASD
group had a significantly larger N160 peak (1.85 x) amplitude to motion onset
VEPs elicited by the expansion of radial rings (p=0.001). No differences were
evident in contraction VEP peak amplitudes nor in the latencies of the motion
onset N160 peaks. There was no evidence of a response that could be associated
with adaptation to the motion stimulus in the inter-stimulus interval following an
expansion or contraction phase of the rings.
Conclusion
These data support a difference in processing of motion onset stimuli in this adult,
3
Key Words:
Autism Spectrum Disorder, Motion onset, Pattern reversal, VEPs, Contrast
Introduction:
Autism Spectrum Disorder (ASD) is a neurodevelopmental condition
affecting approximately 1:100 individuals, with a higher prevalence amongst
males [1]. Individuals with ASD have difficulties in three core diagnostic domains
of: reciprocal social interaction, communication and repetitive behaviours and
restricted interests [2]. Whilst, the direct aetiology of ASD remains unclear,
several studies indicate a complex genetic origin, which may be influenced by
environmental factors such as hormones or inflammation to disrupt neural
maturation in the brain, [3-5]. There is some evidence of this in MRIs of
individuals with ASD who display an increased white matter bulk and reduced
long range connectivity between regions of the brain, most notably laterally, but
also from anterior to posterior. The general model is one of local
over-connectivity and reduced long range over-connectivity between functional regions of
cortex [6-11].
Several theories have been proposed to explain the ASD phenotype. One
suggests that ASD is a result of weak central coherence (WCC) [10,12]. This
means that individuals with ASD have difficulty in assimilating and making sense
of the whole. The idea of weak coherence is supported by elevated motion
coherence thresholds in children [13,14]. Poor performance in this motion domain
suggests a difference in the processing of simple motion stimuli. In addition ASD
individuals outperform typical observers in static tasks such as visual search
4
grasping the gestalt and being drawn into the finer detail of objects. Thus,
according to WCC theory, there is a natural cognitive bias towards the local over
the global perspective and superior performance in tasks requiring the detection of
detail.
An alternative model, proposed by Mottron et al (2006) [20] suggests that
enhanced perception in sensory cortex contributes to ASD. Evidence for this is
found in enhanced pitch discrimination in the auditory domain [21]. In the visual
domain, Mottron’s group revealed a difference in thresholds for orientation
discrimination of first and second order gratings. First order gratings are those in
which spatial contrast is defined by luminance, and processed in V1, whilst
second order gratings are those defined by texture and draw upon extra-striate
regions for correct orientation discrimination [22]. The ASD group was superior
at determining the orientation for the first order task, but their performance was
inferior for the second order task, compared to the comparison group [23]. This
enhanced perception of simple stimuli implies that there are differences in the way
that visually salient features are initially processed by V1. It is argued that these
differences in early sensory processing are fed forward to higher cortical regions,
where they impair ASD performance for more complex stimuli. The enhanced
perception theory was supported by findings that individuals with ASD have
higher than normal visual acuity [24], but this was subsequently shown not to be
the case [25, 26].
Most visual processing studies of complex stimuli, e.g. motion, in
individuals with ASD have used imaging or psychophysical methods; few have
5
rotating, translating, spiralling or expanding/contracting motion stimuli, found
second order (texture defined) motion discrimination thresholds were higher in an
ASD group compared with a matched comparison group, but first order
(luminance defined) motion discrimination thresholds were not significantly
different [23,27]. Therefore, for both static and moving, complex, texture defined
stimuli ASD discrimination thresholds were greater. However for simple
luminance defined stimuli superior performance was seen only in the static
domain with no differences in motion discrimination thresholds for the first order
motion defined stimuli.
There has not always been agreement in all findings with respect to motion
processing in ASD, in part reflecting the varied stimuli and heterogeneity of the
clinical groups studied, e.g. Milne et al (2002) described increased motion
discrimination thresholds in children, whilst Del Viva et al (2006) found no
differences in a more tightly matched group of children based on IQ measures
[28]. For reviews see [29,30]. In one large recent study of 89 ASD and 52
adolescents no group differences in biological motion, motion coherence and
form-from motion were detected, although individuals with the lowest IQs
performed most poorly on the biological motion task [31].
The motion onset VEP in humans has a major motion related component
(N160) occurring between 150 and 200 msec around the extra striate
temporo-occipital and associated parietal cortical areas with high contrast sensitivity
[32-35]. The preceding P1 component is related to pattern processing at the onset of
6
P2 component occurring at ~ 220 msec with wide inter-subject variability [32] is
believed to be associated with motion detection and is highly susceptible to
motion adaptation [36].
Our aim was to assess early cortical responses to pattern reversal stimuli to
ascertain if, using electrophysiology, these cortical potentials differed between
groups and might further support theories of enhanced perception demonstrated
by orientation discrimination thresholds. Furthermore, we wished to examine the
motion onset- evoked potentials to help our understanding of the differences in
motion perception seen in adult high functioning ASD individuals.
Methods
Participants
Cognitive measures of ability were used to match the groups for verbal,
performance and full intelligence quotient, (IQ), as measured by the Wechsler
Adult Intelligence Scale (WAIS-IIIUK). Participants with ASD were diagnosed
according to conventional criteria. A review of available medical records and
assessment with the Autism Diagnostic Observational Schedule (ADOS) [37]
confirmed that all met DSM-IV-TR criteria for ASD. The Autism Quotient (AQ)
was used as a further measure to characterize the individuals on their severity of
ASD [38]. Male adults with ASD (n=9) and typically developing (TD) males
(n=7) were recruited, age ranged 23-56 years with the ASD group being
significantly (p=0.023) younger (ASD 36.6 ± 11.8 and TD 48.9 ± 5.5 years). The
groups differed on the AQ score (p<0.001) but not on measures of IQ (p>0.263)
7
Research Committee, all experiments were in accordance with the declaration of
Helsinki.
ASD (n=9) TD (n=7) p
Age 36.6 ± 11.1[22.9-55.7] 48.9 ± 5.0[41.8-55.8] 0.023
FIQ 111 ± 17 [81-134] 104 ± 16 [77-128] 0.411
PIQ 110 ± 16 [84-136] 100 ± 14 [75-122] 0.263
VIQ 109 ± 16 [81-135] 106 ± 15 [82-125] 0.666
AQ 31 ± 8 [22-42] 13 ± 7 [4-21] <0.001
_________________Insert Table 1 near here________________________
Stimuli
High and low contrast pattern reversal checks and radially expanding and
contracting, low contrast, circles [39], were generated using a CRS visage system.
Stimuli were displayed on a NGC CRT 32 inch Multisynch monitor and viewed
binocularly at 1m. Pattern stimuli were black and white checks of 50’ side length,
(0.85cpd) of high (98%) or low (10%) Michelson contrast, with 3 phase reversals
per second. Motion stimuli also had 10% contrast and consisted of expanding and
contracting radial rings, based on the stimuli designed by Kremlacek et al 2004
The duty cycle was 33.3% consisting of 300ms expansion 600ms stationary
interstimulus interval, 300 ms contraction and a further 600 ms stationary
interstimulus phase. Stimuli were corrected for equal visibility in a 30 degree
stimulus field using the cortical magnification factor (CMF) = 1/(0.1x eccentricity
+1). The rings had a constant expansion or contraction temporal frequency of 5 c/s
across the whole stimulus field, the local motion velocity increased (5-25 deg/s)
8
motion stimuli used a sine function so that the maximal contrast was either 10%
or 90%. The expansion or contraction stimuli occurred randomly and were always
separated by an interstimulus interval. The VEPs to each event were epoched and
evaluated separately. A central red fixation dot was present during recordings.
Recordings
VEPs to these stimuli were extracted from the EEG recorded with a
Neuroscan multi- channel system and 40 channel Quik-Cap. Electrode impedance
was < 5kΩ. Each stimulus run lasted 2 minutes and each stimulus was randomly
presented 3 times. A grand average of the VEPs from each of the three stimulus
runs was computed for each individual. The grand average for each individual for
each run was then used to compute the group grand average as shown figures
(1-3). There were no differences in the number of traces rejected due to artefacts for
each group. The amplitudes were calculated from peak to peak and the time to
peak from stimulus onset to the peak. EEG recordings were epoched off line from
-50 to 300 ms with ± 100μV cut-off and filtered between 1Hz to 30Hz, using Fz
as reference.
Data Analysis
The largest amplitude signal occurred at Oz to the pattern P4 to motion
stimuli. The grand averages for each individual of each of the stimulus runs were
used in the statistical calculations. The amplitude and time to the major peaks N80
and P100 of pattern reversal VEPs (high and low contrast) and N160 (expand and
contract) of motion onset VEPs were compared between groups (ASD and TD)
9
differences between groups on this measure. Following significant multivariate
analysis, the univariate ANCOVA’s for each factor were analysed and adjusted
using the sequentially rejective Bonferroni-Holm method [40]. Student’s t-test
was used for comparisons between groups for age and IQ measures with p<0.05
as significant. All data are presented as mean ± SD with calculations performed
with IBM SPSS statistics 19.
Results
Pattern Reversal VEPs
For pattern reversal high and low contrast checks a positive (P100)
component was evident over Oz in both groups. There were no significant
differences between the groups in either amplitude or latency of the high or low
contrast pattern reversal VEPs. For the high contrast pattern reversal condition,
the equality of covariance was not significant (Box’s M 18.5, F=1.2, p=0.262). A
one-way MANCOVA revealed no significant multivariate main effect for group,
though the power was low. Wilks’ λ =0.840, F(4,10)=0.475, p=0.754, power to
detect the effect was 0.121. Given there was no overall effect of group on the high
contrast pattern responses follow up univariate analyses were also non significant
(p>0.328) with low power to detect any effects > 0.075.
Similarly, for the low contrast pattern reversal response the equality of
covariance was also non-significant (Box’s M=14.6, F=0.9, p=0.456). The
one-way MANCOVA did not reveal a multivariate main effect for group. Wilks’ λ =
0.885, F(4,10) =0.326, p=0.854, power to detect the effect was also low for this
10
significant effects on amplitude or latency of N80 or P100 peaks (p>0.340) and
power to detect the effects >0.050. Therefore, we did not find any significant
findings in the VEP responses to high or low contrast pattern reversal stimuli
between the ASD and TD group with age as a covariate (Figure 1 and table 2).
_______insert figure 1 near here________________________
Motion onset VEPs
The main factor of interest was whether the major N160 component of the
motion elicited response differed between groups. The amplitudes of the P1 and
P2 were variable and not analysed in this series as most did not exceed the noise
level of >2µV [35]. For the motion onset responses the equality of covariance was
also non-significant (Box’s M 22.6, F=1.5, p=0.127). The one-way MANCOVA
revealed a significant multivariate effect for group, Wilks’ λ =0.229, F(4,10)= 8.4,
p=0.003, with a high power to detect the effect of 0.969. Given the significance of
the overall test, the univariate main effects for group were examined using the
Bonferroni-Holm adjusted p-values for the four tests. There was a significant
univariate main effect of group for the N160 expanding amplitude, with adjusted
p-value of 0.0125: F(1,13)=19.8, p=0.001 with a high power of 0.984 to observe
this effect. The N160 contracting amplitude was not significant at the adjusted
p-value of 0.016: F(1,13)=6.5, p=0.025 with observed power of 0.652. The times to
peak for the N160 amplitudes for expanding F(1,13)=1.4, p=0.256 observed
power 0.196 and contracting rings F(1,13) =2.7, p=0.126, observed power 0.328
11
Therefore, overall the ASD group had a significantly larger amplitude
N160 motion onset VEP to the expanding motion stimulus compared to the TD
group. This effect was present for the contracting stimulus but failed to reach
significance once repeated measures were taken into account. (Figure 2 and table
2 for descriptive values).
The multivariate analysis took into account the differences in age as the
time to the N160 peak increases with age [33,42]. If age is not used as a covariate
then the overall results are the same with a significant difference in the expanding
amplitude of the N160 peak (p=0.003) and non-significant effect on the N160
contracting amplitude (0.040) after correction for multiple measures. There were
no significant differences between groups on the times to the N160 peaks
[image:12.595.94.503.468.714.2](p>0.071).
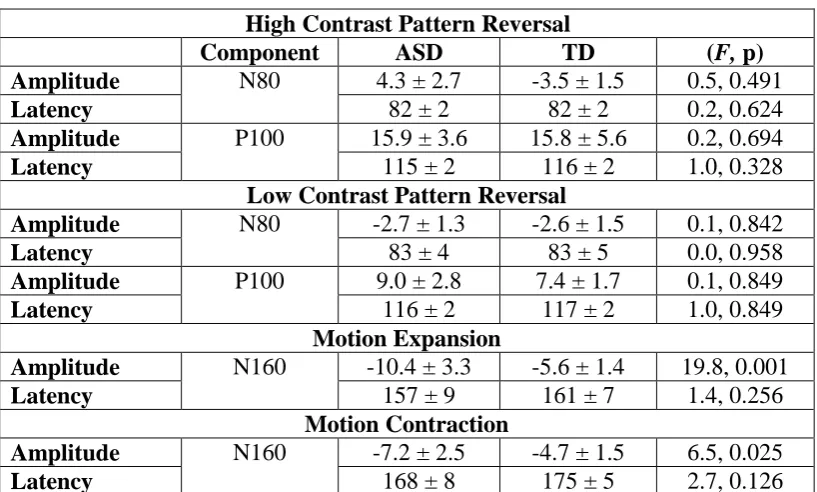
Table 2 SUMMARY RESULTS FOR VISUAL EVOKED PATTERN AND
MOTION POTENTIALS
High Contrast Pattern Reversal
Component ASD TD (F, p)
Amplitude N80 4.3 ± 2.7 -3.5 ± 1.5 0.5, 0.491
Latency 82 ± 2 82 ± 2 0.2, 0.624
Amplitude P100 15.9 ± 3.6 15.8 ± 5.6 0.2, 0.694
Latency 115 ± 2 116 ± 2 1.0, 0.328
Low Contrast Pattern Reversal
Amplitude N80 -2.7 ± 1.3 -2.6 ± 1.5 0.1, 0.842
Latency 83 ± 4 83 ± 5 0.0, 0.958
Amplitude P100 9.0 ± 2.8 7.4 ± 1.7 0.1, 0.849
Latency 116 ± 2 117 ± 2 1.0, 0.849
Motion Expansion
Amplitude N160 -10.4 ± 3.3 -5.6 ± 1.4 19.8, 0.001
Latency 157 ± 9 161 ± 7 1.4, 0.256
Motion Contraction
Amplitude N160 -7.2 ± 2.5 -4.7 ± 1.5 6.5, 0.025
12
___________Insert Figure 1 (full page width) and Table 2 near here
Discussion
We assessed two areas of visual perception that previous psychophysical
investigations suggest differ in the autistic population. Our VEP data show
differences in the main motion related N160 component between 150 and 200 ms.
Recent findings using VEP data and neuroimaging techniques confirm that the
13
[35,46]. However we did not find differences in the low spatial frequency
components of pattern contrast VEPs processed by V1 [35,47].
Jemel et al (2010) found that ASD subjects did not show any spatial tuning
of the pattern reversal VEP N80 to mid and high spatial frequencies, in contrast to
typically developing subjects, and suggested this contributes to altered visual
perception [43]. This implies atypical cortical processing in ASD with respect to
simple stimuli. These authors did not observe any differences between the groups
when low spatial frequency gratings were used and found no differences in the
properties of the P100. Our data support these observations. Although we did not
vary spatial frequency, we used a check size (0.85 cpd) close to Jemel et al’s low
spatial frequency stimuli, and at high (90%) and low (10%) spatial contrasts there
were no group differences in either N80 or P100 amplitudes or timings (p>0.159).
Our adult, high functioning ASD group did show significantly larger
motion onset VEP negative peak amplitudes (N160) to radially expanding low
contrast rings, than the TD group. The N160 component has been associated with
the perception of global coherent motion and local pattern characteristics [44-47],
stimulus velocity and spatial frequency [33]. The preceding P1 component is
influenced by spatial contrast and relates to activity in V1 [35]. For most of our
participants the P1 of the motion onset VEP was small and ill- defined, (< 2µV)
and could not be fully analysed. Although the ASD group were younger than the
TD group, and time to peak of the N160 increases with age [32], peak latency was
similar between the groups. The finding of larger N160 amplitudes in the ASD
14
To our knowledge these data are the first electrophysiological evidence of
differences in motion processing in ASD. There is some fMRI evidence of altered
motion processing in ASD; for example whilst biological motion recognition
typically uses a unitary parietal-temporal axis, whilst ASD individuals utilised a
different network comprising form and motion centres rather than the unitary
network used by the TD group [48]. In a separate study, Koldewyn et al (2011)
found reduced activity to biological motion in the posterior superior temporal
sulcus, parietal and frontal lobe activity [49]. However, in the psychophysical
experiments they found their ASD adolescents had higher thresholds for detecting
biological motion than the TD group, but did not find any differences in motion
coherence thresholds. This led them to suggest that the deficits of motion
processing in adolescence may derive from differences in the higher-order social
or attentional networks related to interpreting biological motion rather than the
earlier motion centres (V5/MT) [49].
Yet others have described higher thresholds in adolescents and in younger
children with ASD in detecting coherence motion too; though these may only be
evident in individuals who fit the more classic autistic rather than the Asperger
profile [14,50,51]. Mostly ASD performance for motion tasks has been reported
as being worse than TD, but a local motion detection advantage has been reported
in adolescents with ASD who were better at discriminating the differences in
speeds of sequential random dot kinetograms when the inter-stimulus interval
15
Discordance in the results of psychophysical tests of motion perception
have been attributed to construction of coherence motion stimuli, some of which
may provide local grouping cues, and may not therefore be true deficits in global
motion processing (Dakin and Frith (2005) [29]. To overcome this,
Vandenbroucke et al (2008) [52] used two moving plaids that could be perceived
either as a coherent whole or as two transparent gratings sliding over each other.
No significant difference was found between groups in the duration of either
percept. This may reflect the low spatial frequency of the plaids and mid to high
spatial frequencies might better reveal differences, as shown by Jemel et al’s
electrophysiological findings [43].
Clinical differences in high and low functioning individuals on the ASD
spectrum, along with age and the demands of the complexity of the studies may
also contribute to discrepant conclusions as proposed by Kaiser and Shiffrar
(2009) [54]. In addition, individuals with ASD show an altered behavioural style
of how they attend to the world [55]. Although the motion after effect [56], and
psychophysical motion coherence thresholds [57] can be modulated by attention,
our ASD and TD groups showed similar artefact rejection rates during the
acquisition the of motion onset VEPs and its unlikely that attention to the stimuli
affected these data.
Our objective electrophysiological findings of a difference in the
motion-onset VEP to an expanding ring in a small sample of high functioning ASD adults
provides evidence supporting an underlying difference in the cortical response to
16
difference in the cortical response to motion onset may be the result of altered
connectivity between visual centres and higher cortical regions [9] or to the
changes in cortical structures that are seen in ASD individuals [6-8].
Acknowledgements
This work was funded by the College of Optometrists UK. The author (PAC) is a
College of Optometrists Research Fellowship. Parts of this work were presented at
ISCEV 2011, Quebec. We would thank the participants for their time whilst
carrying out this study. We would like to thank Dr Alki Liasis and Dr Say Soriano
for advice on MRI segmentation and field analysis. Thank you to the two
anonymous reviewers for their helpful suggestions on this manuscript.
Figure and table legends
Figure 1 legend
Four rows of traces corresponding to each stimulus condition are displayed: a)
high contrast 50’ pattern reversal checks, b) low contrast pattern reversal checks,
c) motion expansion and d) motion contraction stimuli. The 1st and 2nd columns
show group grand averaged traces ±1 SD for the ASD and the TD group
respectively. In the 3rd column the mean waveforms from each group are
overlapped to illustrate the amplitude difference between groups. In the 4th
column the arithmetic difference between these traces is shown as a waveform
and as a map. Maximal pattern reversal VEP data were taken from Oz and the
motion VEP data from P4. Isopotential maps are shown at the latency at which the
17
significantly larger for the ASD group to the expanding rings (p=0.001), but not
for contraction.
Table 1 Participant details. ASD: autism spectrum disorder, TD: typically
developing, FIQ: full intelligence quotient, PIQ: performance intelligence
quotient, VIQ: verbal intelligence quotient, AQ: autism quotient.
Table 2 legend
18
References
1. Baird G, Simonoff E, Pickles A, Chandler S, Loucas T, Meldrum D, Charman
T (2006) Prevalence of disorders of the autism spectrum in a population cohort of
children in South Thames: the Special Needs and Autism Project (SNAP). The
Lancet 9531:210-215
2. Baird G, Cass H, Slonims V (2003) Diagnosis of autism. BMJ 7413:488-493
3. St. Pourcain B, Wang K, Glessner JT, Golding J, Steer C, Ring SM, Skuse DH,
Grant SFA, Hakonarson H, Davey Smith G (2010) Association Between a
High-Risk Autism Locus on 5p14 and Social Communication Spectrum Phenotypes in
the General Population. Am J Psychiatry 11:1364-1372
4. Betancur C, Sakurai T, Buxbaum JD. The emerging role of synaptic
cell-adhesion pathways in the pathogenesis of autism spectrum disorders (2009)
Trends in Neurosci 7:402-412
5. Chakrabarti B, Dudbridge F, Kent L, Wheelwright S, Hill-Cawthorne G,
Allison C, Banerjee-Basu S, Baron-Cohen S (2009) Genes related to sex steroids,
neural growth, and social-emotional behavior are associated with autistic traits,
empathy, and Asperger syndrome. Autism Res 3:157-177
6. Shukla DK, Keehn B, Müller RA (2010) Regional homogeneity of fMRI time
series in autism spectrum disorders. Neurosci Lett 1:46-51
7. Casanova M, Trippe J (2009) Radial cytoarchitecture and patterns of cortical
19
8. Courchesne E, Redcay E, Morgan JT, Kennedy DP (2005) Autism at the
beginning: microstructural and growth abnormalities underlying the cognitive and
behavioral phenotype of autism. Dev Psychopathol 3:577-597
9. Villalobos ME, Mizuno A, Dahl BC, Kemmotsu N, Muller R (2005) Reduced
functional connectivity between V1 and inferior frontal cortex associated with
visuomotor performance in autism. NeuroImage 3:916-925
10. Happé F, Frith U (2006) The weak coherence account: detail-focused
cognitive style in autism spectrum disorders. J Aut Develop Disord 1:5-25
11. Anderson JS, Nielsen JA, Froehlich AL, Du Bray MB, Druzgal TJ, Cariello AN, Cooperrider JR, Zielinski BA, Ravichandran C, Fletcher PT, Alexander AL, Bigler ED, Lange N, Lainhart JE (2011) Functional connectivity magnetic resonance imaging classification of autism. Brain 11:3742-3754
12. Happé, Frith U (2009) The beautiful otherness of the autistic mind. Phil Trans
Roy Soc B 1522:1345-1350
13. Milne E, Swettenham J, Hansen P, Campbell R, Jeffries H, Plaisted K (2002)
High motion coherence thresholds in children with autism. J Child Psychol
Psychiat 2:255-263
14. Pellicano E, Gibson L, Maybery M, Durkin K, Badcock DR (2005) Abnormal
global processing along the dorsal visual pathway in autism: a possible
mechanism for weak visuospatial coherence? Neuropsychologia 7:1044-1053
15. Robert J, Keehn B, Connolly C, Wolfe JM, Horowitz TS (2009) Why is visual
20
16. O'Riordan M (2004) Superior visual search in adults with autism. Autism
3:229-248
17. O'Riordan M, Plaisted K, Driver J, Baron-Cohen S (2011) Superior visual
search in autism. J Exp Psychol 3:719-730
18. Keehn B, Brenner L, Ramos A, Lincoln A, Marshall S, Müller R (2009) Brief
Report: Eye-Movement patterns during an Embedded Figures Test in children
with ASD. J Aut Dev Disord 2:383-387
19. Lee PS, Foss-Feig J, Henderson JG, Kenworthy LE, Gilotty L, Gaillard WD,
Vaidya CJ (2007) Atypical neural substrates of Embedded Figures Task
performance in children with Autism Spectrum Disorder. NeuroImage 1:184-193
20. Mottron L, Dawson M, Soulières I, Hubert B, Burack J (2006) Enhanced
perceptual functioning in autism: an update, and eight principles of autistic
perception. J Aut Dev Disord 1:27-43
21. Bonnel A, Mottron L, Peretz I, Trudel M, Gallun E, Bonnel A (2003)
Enhanced pitch sensitivity in individuals with autism: a signal detection analysis.
J Cog Neurosci 2:226-235
22. Chakor H, Bertone A, McKerral M, Faubert J, Lachapelle P (2005) Visual
Evoked Potentials and Reaction Time Measurements to Motion-reversal
Luminance- and Texture-defined Stimuli. Doc Ophthalmol 2:163-172
23. Bertone A, Mottron L, Jelenic P, Faubert J (2005) Enhanced and diminished
visuo-spatial information processing in autism depends on stimulus complexity.
21
24. Ashwin E, Ashwin C, Rhydderch D, Howells, Baron-Cohen S (2008)
Eagle-Eyed visual acuity: An experimental investigation of enhanced perception in
autism. Biol Psychiatr 65:17-21
25. Bach M, Dakin SC (2009) Regarding "Eagle-Eyed Visual Acuity: An
Experimental Investigation of Enhanced Perception in Autism. Biol Psychiatr
66:e19-e20
26. Tavassoli T, Keziah L, Bach M, Dakin SC, Baron-Cohen S (2011)
Psychophysical measures of visual acuity in autism spectrum conditions. Vision
Res 51:1778-1780
27. Bertone A, Mottron L, Jelenic P, Faubert J (2003) Motion perception in
autism: A "complex" issue. J Cogn Neurosci 2:218-225
28. Del Viva MM, Igliozzi R, Tancredi R, Brizzolara D (2006) Spatial and motion
integration in children with autism. Vision Res 8-9:1242-1252
29. Dakin S, Frith U (2005) Vagaries of visual perception in autism. Neuron
3:497-507
30. Simmons DR, Robertson AE, McKay LS, Toal E, McAleer P, Pollick FE
(2009) Vision in autism spectrum disorders. Vision Res 22:2705-2739
31. Jones C, Swettenham J, Charman T, Marsden, AJS, Tregay J, Baird G,
Simonoff E, Happé F (2011) No evidence for a fundamental visual motion
processing deficit in adolescents with autism spectrum disorders. Autism Res
22
32. Kuba M, Kubová Z, Kremlácek J, Langrová J (2007) Motion-onset VEPs:
Characteristics, methods, and diagnostic use. Vision Res 2:189-202
33. Kubová Z, Kuba M, Spekreijse H, Blakemore C (1995) Contrast dependence
of motion-onset and pattern-reversal evoked potentials. Vision Res 2:197-205
34. Müller R, Gopfert E, Hartwig M (1985) Visual evoked potential studies on
human cortical coding of the speed of movement of a grating pattern. EEG EMG.
Z. Elektroenzephalogr Elektromyogr Verwandte Geb 2:75-80
35. Pitzalis S, Straqppini F, De Gasperis M, Bultrini A, Di Russo F (2012)
Spatio-temporal brain mapping of motion onset VEPs combined with fMRI and
retinotopic maps. PloS ONE 7:e35771
36. Hoffmann MB, Bach M (1997) Motion onset VEPs: topographic distribution
and dependence on stimulus velocity reveals two components. Brain Topography
10:171
37. Lord C, Risi S, Lambrecht L, Cook EH, Leventhal BL, DiLavore PC, Pickles
A, Rutter M (2000) The Autism Diagnostic Observation Schedule—Generic: A
Standard Measure of Social and Communication Deficits Associated with the
Spectrum of Autism. J Aut Dev Disord 3:205-223
38. Baron-Cohen S, Wheelwright S, Skinner R, Martin J, Clubley E (2001) The
Autism-Spectrum Quotient (AQ): Evidence from Asperger
Syndrome/High-Functioning Autism, Males and Females, Scientists and Mathematicians. J Aut
23
39. Kremláček J, Kuba M, Kubová Z, Chlubnová J (2004) Motion-onset VEPs to
translating, radial, rotating and spiral stimuli. Doc Ophthalmol 2:169-175
40. Holm S (1970) A simple sequentially rejective multiple test procedure. Scand
J Statist 6:65-70
41. Hoffmann MB, Unsöld AS, Bach M (2001) Directional tuning of human
motion adaptation as reflected by the motion VEP. Vision Res 17:2187-2194
42. Langrová J, Kuba M, Kremlácek J, Kubová Z, Vít F (2006) Motion-onset
VEPs reflect long maturation and early aging of visual motion-processing system.
Vision Res 4:536-544
43. Jemel B, Mimeault D, Saint-Amour D, Hosein A, Mottron L (2010) VEP
contrast sensitivity responses reveal reduced functional segregation of mid and
high filters of visual channels in Autism. Journal of Vision 10:6
44. Bach M, Ullrich D (1994) Motion adaptation governs the shape of
motion-evoked cortical potentials. Vision Res 12:1541-1547
45. Wist ER, Gross JD, Niedeggen M (1994) Motion aftereffects with random-dot
chequerboard kinematograms: relation between psychophysical and VEP
measures. Perception 10:1155-1162
24
47. Nakamura M, Kakigi R, Okusa T, Hoshiyama M,Watanabe K (2000) Effects of check size on pattern reversal visual evoked magnetic field and potential. Brain Research 872:77-86
48. McKay LS, Simmons DR, McAleer P, Marjoram D, Piggot J, Polick FE (2012) Do distinct atypical cortical networks process biological motion information in adults with Autism Spectrum Disorders? NeuroImage 59:1524-1533
49. Koldewyn K, Whitney D, Rivera SM (2011) Neural correlates of coherent and
biological motion perception in autism. Dev Sci 5:1075-1088
50. Tsermentseli S, O’Brien J, Spencer J (2008) Comparison of form and motion
coherence processing in Autistic Spectrum Disorders and Dyslexia. J Aut Dev
Disord 7:1201-1210
51. Milne E, White S, Campbell R, Swettenham J, Hansen P, Ramus F (2006)
Motion and form coherence detection in Autistic Spectrum Disorder: Relationship
to motor control and 2:4 digit ratio. J Aut Devp Disord 2:225-237
52. Vandenbroucke MWG, Scholte HS, van Engeland H, Lamme VAF, Kemner C
(2008) Coherent versus component motion perception in autism spectrum
disorder. J Aut Develop Disord 5:941-949
53. Chen Y, Norton DJ, McBain R, Gold J, Frazier JA, Coyle JT (2012) Enhanced
local processing of dynamic visual information in autism: Evidence from speed
25
54. Kaiser MD, Shiffrar M (2009) The visual perception of motion by observers
with autism spectrum disorders: A review and synthesis. Psychonomic Bull Rev
5:761-777
55. Neumann D, Spezio ML, Piven J, Adolphs R (2006) Looking you in the
mouth: abnormal gaze in autism resulting from impaired top-down modulation of
visual attention. Soc Cogn Affect Neurosci 3:194-202
56. Heinrich SP, Andrés M, Bach M (2007) Attention and visual texture
segregation. Journal of Vision :6
57. Fuller S, Liu T, Carrasco M (2006) Attention alters the appearance of motion