This is a repository copy of Synthesis of Ti(SO4)O solid acid nano-catalyst and its application for biodiesel production from used cooking oil.
White Rose Research Online URL for this paper: http://eprints.whiterose.ac.uk/104400/
Version: Accepted Version Article:
Gardy, J, Hassanpour, A orcid.org/0000-0002-7756-1506, Lai, X et al. (1 more author) (2016) Synthesis of Ti(SO4)O solid acid nano-catalyst and its application for biodiesel production from used cooking oil. Applied Catalysis A: General, 527. pp. 81-95. ISSN 0926-860X
https://doi.org/10.1016/j.apcata.2016.08.031
© 2016, Elsevier. Licensed under the Creative Commons Attribution-NonCommercial-NoDerivatives 4.0 International http://creativecommons.org/licenses/by-nc-nd/4.0/
[email protected] https://eprints.whiterose.ac.uk/
Reuse
Unless indicated otherwise, fulltext items are protected by copyright with all rights reserved. The copyright exception in section 29 of the Copyright, Designs and Patents Act 1988 allows the making of a single copy solely for the purpose of non-commercial research or private study within the limits of fair dealing. The publisher or other rights-holder may allow further reproduction and re-use of this version - refer to the White Rose Research Online record for this item. Where records identify the publisher as the copyright holder, users can verify any specific terms of use on the publisher’s website.
Takedown
If you consider content in White Rose Research Online to be in breach of UK law, please notify us by
Synthesis of Ti(SO
4)O solid acid nano-catalyst and its application for biodiesel
production from used cooking oil
Jabbar Gardy1, Ali Hassanpour1,*, Xiaojun Lai1, Mukhtar H. Ahmed2
1School of Chemical and Process Engineering, University of Leeds, LS2 9JT Leeds, UK.
2Nanotechnology Integrated Bioengineering Centre, University of Ulster, Jordanstown, BT37 0QB Belfast, UK.
*Tel.: +441133432405; E-mail: [email protected]
ABSTRACT
A novel solid acid nano-catalyst [Ti(SO4)O] was synthesised and used for the simultaneous esterification
and transesterification of free fatty acids in used cooking oil (UCO) to produce biodiesel. The synthesised
nano-catalyst was fully characterised by different analytical techniques. The XPS results clearly confirmed
that the bidentate sulphate coordinated to the Ti4+ metal in the nano-catalyst product. Obtained d-spacing
values from the experimental data of XRD peaks and the SAED pattern of produced nano-catalyst agreed
well with the d-spacing values from the JCPDS-ICDD card numbers 04-011-4951 for titanium sulphate
oxide or titanium oxysulfate crystal structures.This confirms the sulphate groups were within the crystalline
structure rather than on the surface of titania nano particles, which has not been previously reported. It has
been demonstrated 97.1% yield for the fatty acid methyl ester can be achieved usign the synthetised catalyst
under a reaction time of 3 hrs, catalyst to UCO ration of 1.5wt% and methanol to UCO ratio of 9:1 at 75oC
reaction temperature. The nano-catalyst showed a good catalytic activity for the feedstock containing ≤6
wt% free fatty acid. Furthermore, the catalytic activity and re-usability of the Ti(SO4)O for the
esterification/transesterification of UCO were investigated. XRD results confirmed that the amount of SO
species in the solid acid nano-catalyst slowly decreased with re-use after 8 cycles under optimized
conditions, which is higher than the reusability of other functionalised titania reported in the literature .
2
Key words
Titanium sulphate oxide or titanium oxysulfate; solid acid catalyst; esterification & transesterification
process; used cooking oil; nano-catalyst; and biodiesel.
1. INTRODUCTION
During past twenty years, scientists have been investigating alternatives to fossil fuels in to meet
global energy demands and reduce carbon emissions. Biodiesel has been widely regarded as a
suitable resource because of its availability [1], renewability [2], lower gas emissions [3],
non-toxicity [4], and its biodegradability [2, 5]. Currently around 90% of biodiesel is produced by the
transesterification process of triglycerides with low molecular weight alcohols using homogenous
acid or base catalysts. However, the biodiesel industry faces some significant challenges; (i) high
cost of biodiesel feedstock (70 to 85% of the overall production cost) and (ii) cost of biodiesel
processing, including separation, purification and neutralisation of by-products [6-9]. These issues
can be resolved by using low-cost feedstocks, but with catalysts highly tolerant to moisture and
Free Fatty Acids (FFA) in oil, because FFA and moisture content in cheap raw materials have an
adverse effect on catalyst activity.
Used Cooking Oil (UCO) is regarded as the a promising feedstock for biodiesel production despite
containing a certain amount of water, a large amount of FFA and other impurities [10, 11]. If UCO
contains more than 1.0% of FFA and 0.5% of water, a homogenous based catalyst would not be
preferred in the transesterification process because of soap formation (fatty acid salts), hydrolysis
of the product and decreasing the reactivity of the base catalyst [12, 13]. One way of reducing the
amount of FFA is to use a homogenous acidic catalyst for the pre-esterification of UCO; however,
using an acidic catalyst demands expensive equipment to avoid acid corrosion, which inevitably
increases costs of biodiesel production [2, 14]. Heterogeneous catalysts, however, could be suitable
for biodiesel production from UCO due to their reusability, higher stability, high surface area,
3 studies have been conducted on the development of sulphated metal oxides for the simultaneous
esterification and transesterification process of UCO to produce biodiesel [21-23]. Several synthetic
routes were applied for the preparation of heterogeneous catalysts including sol-gel [24-27],
solvent-free [28, 29] and hydrothermal methods [30-33]. Examples of heterogeneous catalysts
include SO /TiO2 [30, 34-37],, SO /TiO2-SiO2 [38-41], SrO/SO -ZrO2 [29], SO /ZrO2 [17,
42-44], SO /TiO2-ZrO2 [45] and SO /SnO2 [17, 46], which were considered for a good catalytic
activity for the raw materials containing large amounts of FFA in biodiesel production. Among these,
sulphated doped TiO2 is a good example of a solid super-acidic catalyst which is also used in the
petrochemical industry and petroleum refining process [24, 47] and showed better performances as
compared to other sulphated metal oxides. This is due to the acid strength of the TiO2 particles
which further enhances with loading of SO groups on the surface of TiO2 [48]. Many recent
studies have reported that the super acidity of sulphated titanium dioxide catalysts could be based
on Lewis acid and Br nsted acid sites, and the formation of Br nsted acid sites are possibly due to
the higher content of sulphate groups in the catalyst [24, 49, 50]. The presence of Br nsted acid sites
in acid catalysts is significantly important for the catalytic activity [28, 51, 52]. Some researchers
have reported that the addition of sulphate ions to metal oxides enhances the acidic properties,
catalytic activity, high selectivity, and causes less deactivation of the catalyst [25, 53-56]. However,
Shi and Li [36] observed the deposition of carbon on the surface of sulphated metal oxide catalysts
is the main reason to poison the catalytic activity of sulphated titania.
Chen, et al. [34] studied transesterification of cotton seed oil at 230oC with 12:1 methanol to oil ratio
for 8 hrs reaction time using 2wt% of SO /TiO2 catalyst to achieve 90% biodiesel. Furthermore,
Ropero-Vega et al. [35] investigated the effect of SO /TiO2 on the esterification of oleic acid with
ethanol. They found that the maximum conversion of oleic acid was 82.2%, whilst a 100% selectivity
of the catalyst on oleic acid to ester was reported at 80oC after 3hrs. Zhao and co-workers [30] have
4 and (101) facets for esterification of acetic acid and n-butanol. It was reported that the high surface
acidity of titanium dioxide (SO /TiO2) increased the yield of butyl acetate to about 92.2% in
esterification reaction and the selectivity of the catalyst mostly depended on the degree of exposure
of reactive crystal facets. Yang et al. [40] reported a novel strategy for the preparation of SO /TiO2
-SiO2 nano-crystalline solid catalyst. The prepared nano-catalyst had a high surface area of 550m2/g
compared to SO /TiO2 nano-catalyst. Nonetheless, the catalyst displayed low catalytic activity for
glycerine with acetic acid in toluene at 120oC. Peng et al. [38] reported a study on the use of
SO /TiO2-SiO2 as a solid acid catalyst for the simultaneous esterification and transesterification of
low cost feedstocks with high FFA. They reported that under 9:1 methanol to oil molar ratio, 6hrs
reaction time, 3% catalyst loading, and reaction temperature of 200oCa yield of 92% can be
achieved. It was also reported that the SO /TiO2-SiO2 catalyst can be re-used up to 4 times without
reducing the catalytic activity. Recently, an inexpensive precursor was used in the synthesis of
SO /TiO2-SiO2 catalyst by Shao and co-workers [41]. They reported 88% yield for biodiesel
production under 20:1 methanol to UCO molar ratio, 10wt% catalyst concentration and 3hrs reaction
time at 120oC with constant stirring at 400rpm. Nurul Hajar et al. [39] have recently used SO /TiO2
-SiO2 catalyst for the transesterification of decanter cake produced from waste palm oil into biodiesel.
It was found that 120oC reaction temperature, 1:15 oil to methanol ratio, 5hrs transesterification time,
and 13wt% catalyst loading a 91% yield was achieved.
The stability and catalytic activity of sulfated metal oxide catalysts strongly depended on the
synthetic routes, sulfate content and the position of sulfate group in the structure of the catalyst. Few
researchers [57] have recently reported the addition of rare earth element, such as La+3 and Ce+3,
could enhance the catalytic stability of the sulphated TiO2 for the simultaneous esterification and
transesterification of waste cooking oil [48, 58]. The application of such catalysts is preferable in
simultaneous esterification and transesterification reactions when using cheap raw materials with
5 metal oxide catalysts could be (i) relatively high temperature requirements, (ii) low yield, (iii) long
reaction time and (iv) catalyst stability and reusability [59]. The latter could be due to the fact that
the sulphate group is placed on the surface of the catalysts in majority of cases, making the catalyst
prone to deactivation. The present work describes a novel method of preparing Ti(SO4)O solid super
acidic nano-catalyst, where the sulphate group is chemically bonded within the structure of the
catalyst with potential high stability and reusability. Characterisation and application of the
developed nano-catalyst for biodiesel production via simultaneous esterification and
transesterification of used cooking oil (UCO) are investigated; because, so far, there is no reported
work and/or information available on the nano catalysts of titanium sulphate oxide or titanium oxide
sulfate [Ti(SO4)O] for biodiesel production. The chemical structure, catalytic stability, morphology,
particle sizes and surface area for the catalyst are determined using X-ray diffraction (XRD), Fourier
transform infrared (FT-IR) spectroscopy, X-ray photoelectron spectroscopy (XPS), N2
adsorption-desorption isotherms, scanning electron microscopy (SEM), transmission electron microscopy
(TEM), and thermogravimetric analysis coupled with FT-IR (TGA-FTIR). The effect of catalyst
loading, time and temperature of reaction, methanol to UCO ratio and level of FFA in the feedstock
on the biodiesel yield as well as the catalyst activity and stability during the
esterification/transesterification are investigated. Additionally, the obtained biodiesel from the
catalytic transesterification processes is analysed in accordance to ASTM and EN standard methods
to determine characteristic fuel properties such as kinematic viscosity, cloud point, density, flash
point, fatty acid methyl ester (FAME) content, linoleic acid methyl ester (LAME) content, and acid
number.
2. EXPERIMENTAL
2.1Materials
The sample of UCO provided by a restaurant in Leeds, UK, was used as a cheap raw material. The
6 to minimise the moisture in the esterification/transesterification process. The physicochemical
properties of pre-treated UCO, presented in Table S1 (supplementary information), were measured
using EN and ASTM standard methods. Oleic acid and chlorosulfonic acid (for preparation of
catalyst) were obtained from Fluka Analytical. Titanium (IV) oxide (99.5% purity), methanol (≥λλ.λ
purity), methyl heptadecanoate (≥λλ.5 purity, internal standard for GC), FAME mix reference
standard (99.9 purity, GC), n-heptane (≥λλ purity, GC), acetone and n-hexane (99.5%, purity) were
purchased from Sigma-Aldrich (UK) and used without further purifications.
2.2 Methodology
2.2.1 Synthesis of Ti(SO4)O nano-catalyst
The titanium sulphate oxide or titanium oxysulphate nano-catalyst has been prepared using
following procedure: 17.16mmol of chlorosulfonic acid was added drop-wise using a glass syringe
at room temperature into a round-bottomed flask containing 5.0g of titanium (IV) oxide. The
resulting mixture was then heated on an automatic hotplate-magnetic stirrer at 120°C using agitation
rate of 500RPM, to prevent generation of hydrogen and chloride gases in the flask. The flask
containing the produced gel solution was connected with a reflux condenser using tap water to
condensate the remaining reagent for 2 hours at the constant stirring rate. The resulting gel solution
aged quiescently at room temperature for 2 hours and was then dried in an oven at 110°C overnight.
The resultant catalyst was crushed and grinded by pestle mortar, and then the grinded powders were
washed properly with 1:1 ratio of acetone to n-hexane in order to remove any remaining residues on
the surface of the prepared catalyst. Finally, the obtained fine powder was dried in an oven at 110°C
in order to remove any moisture on the surface of the catalyst, then characterized, using different
analytical tools to determine the chemical structure, morphology, surface area, thermal/oxidative
7
2.2.2 Synthesis and analysis of biodiesel fuel
The simultaneous esterification and transesterification of UCO was performed in a glass batch
reactor connected with an automatic temperature controller loop system (Ministat Huber 125 Pilot
ONE Controller, UK) under constant agitation rate at 600RPM using a digital mechanical stirrer
(Eurostar digital IKA) and a reflux condenser. Specified amounts of nano-catalyst, pre-treated UCO
and methanol were charged into the batch reactor. The three-phase mixture was agitated and heated
to specified temperatures and times. The final reaction mixture was poured into a separating funnel
and allowed to cool down to ambient temperature. The crude methyl ester, contained in the upper
layer, was separated by gravity from the glycerol layer and nano-catalyst in the lower layer. The
crude biodiesel layer was then separated from any remaining nano-catalyst and glycerol by a
centrifuge at 9000RPM for 10 minutes.
The FAME content of the prepared biodiesel sample was quantified by Perkin Elmer Clarus gas
chromatography (580S, GC), equipped with a mass spectroscopy (560S, MS) instrument. The
chromatographic separation was achieved on an Elite 5MS capillary column (30.0m x 250µm) and
helium was used as a carrier gas at a constant flow rate of 1ml per minute. The initial oven
temperature in the column was programmed at 60oC for 0min then ramped to 200oC at 10oC/min.
The temperature was held for 10min at 200oC then increased to 270oC at 10oC/min. Finally, the
temperature was held for 5 minutes to remove any remaining traces of sample residue. Biodiesel
sample was injected in splitless mode with a split ratio of 2:1. The transfer line temperature and the
injection temperature were kept at 250oC. GC-MS was operated in the 70eV electron ionization
mode with a collected scanning mass range of 50 to 600Da. The GC instrument was calibrated using
a reference FAME mixture and the biodiesel sample was prepared by dissolving (250±5) mg in 5mL
of solution of internal standard with n-heptane using a shaker. 1.0mL of the prepared solution of the
sample was transferred into 2.0ml of GC automatic sampler vial for injection, followed by the
8 software was used for data processing and reporting. The method to calculate the percentage of total
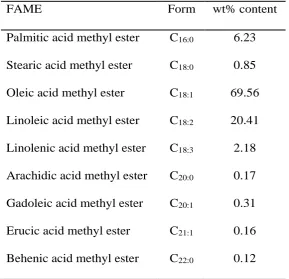
FAMEs has been reported elsewhere [60] and the FAME composition result for obtained biodiesel
[image:9.595.154.444.166.445.2]is presented in Table 1.
Table 1 Fatty acid methyl ester composition for obtained UCO biodiesel
FAME Form wt% content
Palmitic acid methyl ester C16:0 6.23
Stearic acid methyl ester C18:0 0.85
Oleic acid methyl ester C18:1 69.56
Linoleic acid methyl ester C18:2 20.41
Linolenic acid methyl ester C18:3 2.18
Arachidic acid methyl ester C20:0 0.17
Gadoleic acid methyl ester C20:1 0.31
Erucic acid methyl ester C21:1 0.16
Behenic acid methyl ester C22:0 0.12
The separated nano-catalyst was properly washed three times with 1:1 ratio of methanol to n-hexane
in order to remove any remaining non-polar and polar compounds on its surface such as fatty acid
methyl ester (FAME), glycerol, monoglycerides, diglycerides and triglycerides. Finally, the catalyst
was treated in an oven for 3hrs at 110oC to remove any moisture on the surface then the structure of
the catalyst was re-confirmed using XRD before it was re-used in order to determine the
nano-catalyst life time.
2.2.3 Characterization methods
2.2.3.1 Catalyst characterization
The XRD patterns of the nano-catalyst samples were obtained using Bruker D8 X-ray diffraction
9
calibrated against a Si standard. Each sample was scanned from 2 angle ranging 10º to 70º with
step size 0.0495º at 35 seconds per step.
Fourier transform infrared (FT-IR) spectroscopy of original TiO2-NPs and synthestised Ti(SO4)O
nano-catalyst were carried out at room temperature using a Nicolet iS10 FT-IR spectrometer
equipped with a deuterated triglycine sulfate (DTGS) KBr detector to investigate the chemical
vibrational modes in each catalyst sample. A minimum of 36 scans were performed at the average
signal of infrared with a resolution 4cm-1 in the ranges of 400 cm-1 to 4000cm-1. The X-ray
photoelectron spectroscopy (XPS) was carried out using a KRATOS XSAM 800 fitted with an
energy analyser. The X-ray source employed was Al-K X-ray source (hv1486eV) generated from
aluminium anode operating at the emission voltage 15keV and 5mA. The base pressure within the
spectrometer during examination was 6.5x10⁻¹⁰ bar. The films of catalyst samples were prepared by
dissolving a few milligrams of each sample in chloroform and methanol (3:1) then coating on the
silicon wafer surface. The surfaces were exposed to near infrared light to evaporate the solvent to
make a thin film. All spectra were referenced by setting the hydrocarbon C 1s peak to 285eV to
compensate for residual charging effects. The Brunauer–Emmett–Teller (BET) surface area analysis,
pore size and pore volume measurements were obtained according to the multipoint nitrogen
adsorption-desorption method at 77.3K using Micromeritics TriStar 3000 surface analyser. The
catalyst samples were degassed in a vacuum oven at 120oC for 24 hours under a vacuum of 10mmHg
in order to remove any moisture and/or absorbed gases on the surface of the catalyst samples prior
to analysis. The N2 adsorption isotherms were used to calculate the BET parameters for initial TiO2
-NPs and synthetized Ti(SO4)O nano-catalysts; however, the desorption isotherms were used to
calculate the average pore size and total pore volume for both samples using the
Barrett-Joyner-Halenda (BJH) method.
The particle size, morphology and surface structure of the powder samples were studied using
10 amount of powder into 2ml of methanol and keeping in ultrasonic bath for 10 minutes. One drop of
this suspension was then put on the SEM sample holder and placed in a zone SEM cleaner in order
to remove any contaminants using of UV radiation and Ozone at 1 Pascal for 10 minutes. The
Transmission electron microscopy (TEM) measurements were carried out on a FEI Tecnai TF20
FEG operated at 200kV and equipped with an energy dispersive X-ray spectroscopy (EDS, Oxford
INCA) to analyse the particle size, surface morphologies, location of the elements and elemental
compositions of the catalyst samples. The sample was prepared by suspending a small amount of
powder sample in acetone, followed by ultra-sonication for 10 minutes. One drop of this suspension
was put on a carbon coated copper grid for TEM analysis.
The thermal decomposition of TiO2-NPs and Ti(SO4)O nano-catalyst was measured by Stanton
Redcroft thermogravimetric analysis (TGA-TGH 1000) connected via a transfer line to a Nicolet
iS10 FT-IR spectrometer to confirm the decomposition of the catalyst via gas production, in
particular loss of SOx molecules and absorbed surface species. The transfer line was kept at 170°C
and the interface cell oven was maintained at 220°C. (20±5) mg of sample was weighted in a 100 l
platinum crucible and placed in the TGA sample holder. The system was programmed to heat up the
catalyst samples from 25°C to 900°C at 10°C per minute under different purge gases, nitrogen and
air separately at 30ml per minute with a constant flow rate. The system was then held at 900°C for
10 minutes before being cooled to room temperature using water jacket circulator (Julabo F32). The
FT-IR spectra were taken with a minimum 36 scans performed at the average signal of infrared with
4cm-1 a resolution ranging 400cm-1 to 4000cm-1 and the time interval of 50 seconds between spectra.
The total data collection time was 90 minutes for each sample.
2.2.3.2 Biodiesel characterization
Flash point of prepared biodiesel sample was measured by an auto ramp closed cup flash point tester
(Setaflash series 3, England) equipped with a coolant block unit. At ambient temperature, 2.0 ml of
11 was set on the expected flash point temperature for the biodiesel sample. The temperature ramped at
1oC-2oC/min until the flash was captured. Moreover, the pycnometeric method was used to
determine the density of obtained biodiesel at 15oC. Furthermore, viscosity of prepared biodiesel
was measured on a Bohlin-Gemini 150 rotary rheometer (Malvern, UK). 2ml of biodiesel fuel was
placed and the data was analysed based on the Newtonian model from the Bohlin program to
determine the dynamic viscosity at 40oC of the biodiesel sample [5]. Additionally, trace moisture
content in biodiesel was analysed by volumetric Karl Fischer titration (Mettler Toledo-V20,
Germany) [61]. The acid values and percentage of FFA were measured according to the standard
method [62, 63]. Finally, the cooling behavior of prepared biodiesel was examined using optical
microscopy (Olympus, Japan) equipped with a hot-stage (EHEIM professional 3, Germany) to
screen the crystal nucleation/growth in biodiesel sample during cooling. The sample first heated up
to 50oC at 25oC/min and held at 50oC for 5 minutes to dissolve any wax materials in the sample. The
system was then cooled down to -40oC at 3oC/min and then held at each specified temperature stage
for 5 minutes. Images were collected with a Pixelink camera (PL-A662, Canada) at 15 seconds
intervals upon cooling. Linksys32 software was used for programming (heating and cooling) and
data processing.
3. RESULTS AND DISCUSSION
3.1 Catalyst characterization
3.1.1 Crystal structure
TiO2-NPs reacts with chlorosulfonic acid producing Ti(SO4)O solid super acidic nano-catalyst (main
product) and hydrochloric acid gas (by-product) as shown in proposed scheme 1. At high
temperature (120oC), chlorosulfonic acid slowly generates sulphur trioxide (SO3) and hydrochloric
acid gas [64]. The by-product (HCl) gas liberated from this reaction is a corrosive gas, but in industry
normally it is recovered either by neutralizing the off-gas with a very low concentration of sodium
12
[65]. The sulphur trioxide is a very aggressive electrophilic reagent that rapidly reacts with TiO2
-NPs to form TiO2-sulfonic acid. In the presence of a reflux condenser for 2hrs, the formed TiO2
-sulfonic acid is slowly converted into the sulphated titanium oxide or oxysulfate titania [Ti(SO4)O].
Scheme 1: Preparation of Ti(SO4)O nano-catalyst
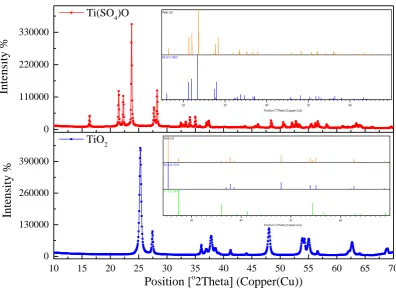
The XRD patterns of base TiO2-NPs indexed using JCPDS-ICDD confirmed 81.6% of tetragonal
anatase phase (04-014-5762, TiO2) and 18.4% of tetragonal rutile phase (01-072-4815, TiO2). The
major diffraction peaks of nano-TiO2were observed at 2 values of 25.30°, 36.λ5°, 37.80°, 38.56°,
48.03°, 53.89°, 55.06°, 62.11°, 62.69° and 68.76° assigned to the (101), (103), (004), (112), (200),
(105), (211), (213), (204) and (116) reflections for the anatase structure of TiO2, respectively. The
rest of the diffraction peaks were observed at 2 values of 27.43°, 36.07°, 3λ.18°, 41.23°, 44.04°,
54.31°, 56.62°, 62.75°, 64.04°, 65.50° and 68.99° corresponded to the (110), (101), (200), (111),
(210), (211), (220), (002), (310), (221), (301) and (112) planes for the rutile structure of TiO2,
respectively, as shown in figure 1.
In the case of the synthesised nano-catalyst (Ti(SO4)O), the XRD patterns indexed using
JCPDS-ICDD in Figure 1 confirm that all diffraction peaks matched with titanium sulphate oxide or titanium
oxysulfate (Ti(SO4)O, 04-011-4951). It should be noted that most of the diffraction peaks were sharp
peaks indicating the high crystallinity degree of the Ti(SO4)O nano-catalyst sample. However, there
are some broad peaks with low intensities at 36.80°, 45.43°, 51.89°, etc., presumably due to the
amorphous degree, which could be explained by the presence of sulphate group inside the chemical
13
10 15 20 25 30 35 40 45 50 55 60 65 70
0 130000 260000 390000 0 110000 220000 330000
Intensity %
Position [o2Theta](Copper(Cu))
TiO2
Position [°2Theta] (Copper (Cu))
20 30 40 50 60
Peak List
04-011-4951
Position [°2Theta] (Copper (Cu))
30 40 50 60
Peak List
04-014-5762
01-072-4815
Intensity %
[image:14.595.100.497.51.340.2]Ti(SO4)O
Figure 1: Powder XRD profiles for TiO2 and Ti(SO4)O nano-catalyst samples at room temperature.
The average particle sizes of TiO2 and Ti(SO4)O nano-catalysts were calculated as 28nm and 45 nm,
respectively, using Debye-Scherrer’s method [66-68] (d=k / cos ), where k is a shape factor of the
particles, is the full width at half maxima of the diffraction peaks (FWHM), is a wavelength of
the CuK radiation, and is the incident angle of the X-rays.
3.1.2 Surface analysis
3.1.2.1 Fourier Transform infrared (FT-IR) spectroscopy
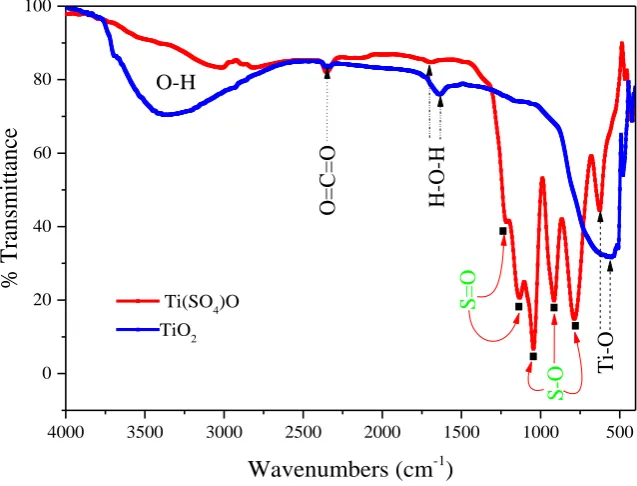
The FT-IR spectrum of the prepared Ti(SO4)O nano-catalyst shows five extra band vibrations than
the spectrum of TiO2-NPs, suggesting sulphate group’s incorporation into the structure of the TiO2
molecules as shown in figure 2. The sharp band in Ti(SO4)O at 626.4cm-1 and the broad band in
TiO2 at 553cm-1 were assigned to the vibration stretching of Ti-O [69, 70]. Moreover, three extra
strong bands at 786.9cm-1, 915cm-1 and 1044.7cm-1 in Ti(SO4)O nano-catalyst spectrum correspond
to S-O stretching vibrations in bidentate sulphate coordinated to the Ti4+ metal [50, 71-73]. The
14
band at 1132.9cm-1 attributed to the S=O symmetric stretching vibration. The band at 1690.1cm-1 in
Ti(SO4)O and at 1637.8cm-1 in TiO2 nano-catalyst correspond to H-O-H symmetric vibration of
absorbed water molecules on the surface of both catalysts [74, 75]. The vibration bands at 2360.8cm
-1 and 2352.5cm-1 in TiO
2 and Ti(SO4)O nano-catalysts spectra, respectively, could correspond to
asymmetric stretching of CO2 molecules in the air, contaminated the surface of both nano-catalysts
[76]. The broad bands at 3045cm-1 to 3400cm-1 in both catalysts assign to the stretching vibration of
O-H functional groups [74, 75].
4000 3500 3000 2500 2000 1500 1000 500
0 20 40 60 80 100
.
.
.
.
O-HO=C
=O
Ti
-O
H-O-H
S=O
S-O
% Tra
nsmi
tt
ance
Wavenumbers (cm-1)
Ti(SO4)O
TiO2
[image:15.595.142.461.247.490.2].
Figure 2: The FT-IR spectra of TiO2 and prepared Ti(SO4)O nano-catalyst samples at ambient
temperature. The black dots indicate the extra absorption bands for S=O and S-O in the prepared
nano-catalyst.
3.1.2.2 X-ray photoelectron spectrum (XPS)
Figure 3 shows the high resolution XPS spectrum survey scan for TiO2 and Ti(SO4)O nano-catalysts.
In case of TiO2-NPs the catalyst contains not only Ti (464eV) and O (530 eV) elements but also
some carbon observed at 285eV, presumably due to the CO2 contamination. Whereas, in the case of
15 and 529.95eV, corresponding to S 2p, C 1s, Ti 2p and O 1s, respectively. The band at 167 eV is a
clear evidence of sulphate group in the synthesised nano-catalyst [Ti(SO4)O].
0 200 400 600 800 1000
Binding Energy (eV)
O
1s
Ti 2p
C 1s
S 2p
Si
2p
Int
ens
it
y (a.
u) Ti(SO
4)O
[image:16.595.123.478.107.344.2]TiO2
Figure 3: XPS survey scan of TiO2 and Ti(SO4)O nano-catalyst samples showing the chemical
environments at 167eV for S 2p in the obtained nano-catalyst.
The spin-orbital splitting between Ti 2p3/2 (at 462.75eV) and Ti 2p1/2 (at 456.94eV) is 5.81eV, as
shown in figure S1c (supplementary information). This is most prominent implication that titanium
in the TiO2 exists in a quadrivalent oxidation state (Ti4+) in the anatase phase of the TiO2. Figure S1a
(supplementary information) shows the deconvoluted O 1s peaks of TiO2-NPs. The spectra yielded
three Gaussian peaks. The first band located at 530.2eV with full width at half maximum (FWHM)
of 1.177eV ( EBE) could be attributed to the Ti=O from TiO2. The second peak centered at binding
energy of 531.2eV could be related to the C=O from absorbed CO2 in air on the surface of the
nano-catalyst. The last peak detected at 532.52eV is assigned to the O-H of absorbed moisture from air on
the surface of the TiO2-NPs by forming [-Ti(OH)-O-Ti-O-]. This agrees with the reported XPS in
the literature for TiO2 as listed in table S2 (supplementary information).
Based on the result presented in table S2 (supplementary information), it can be inferred that the
16 of Ti(SO4)O , the O 1s spectra was fitted and resulted in two Gaussian components (figure S1b,
supplementary information). A broad peak located at 530.76eV corresponds to the lattice oxygen in
Ti=O and S=O, this could be due to the binding energy of the de-convoluted O 1s peaks for Ti=O
and S=O falling in the same region which made it difficult to distinguish between the contribution
of both species [78]. The band detected at 531.72eV correlated to the two different oxygen species
and this must be due to the presence of Ti-O and S-O bonds. Moreover, the binding energy of the Ti
2p3/2, as can be seen in figure S1d (Supplementary information), in Ti(SO4)O nano-catalyst was
shifted by 2.01eV compared to the binding energy of the Ti 2p3/2 in nano-sized TiO2. Furthermore,
the Ti 2p1/2 peak in Ti(SO4)O located at 458.7eV could be ascribed to Ti4+ oxidation state [79]. The
binding energy of S 2p was observed at 167eV which agrees with the reported earlier values for
S-O bonds in sulphate groups [80, 81]. This elucidates that one of the oxygen atoms in the TiS-O2
nano-catalyst was replaced by sulphate group as in obtain nano-sized Ti(SO4)O catalyst.
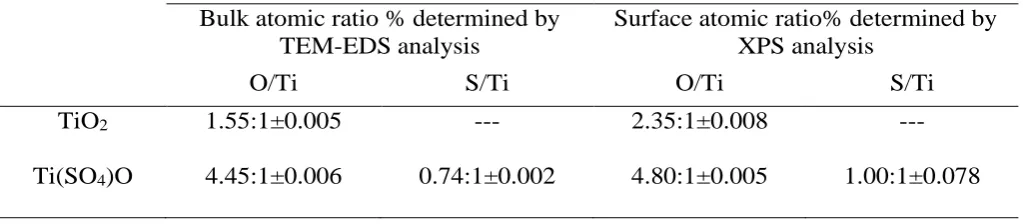
The detailed comparison of the elemental compositions using TEM-EDS analysis and relative
surface elemental composition using XPS analysis for TiO2 and Ti(SO4)O nano-catalyst samples are
[image:17.595.43.555.518.630.2]presented in table 2.
Table 2 Compared atomic ratios for TiO2 and Ti(SO4)O nano-catalysts using XPS and TEM-EDS
analyses
Bulk atomic ratio % determined by TEM-EDS analysis
Surface atomic ratio% determined by XPS analysis
O/Ti S/Ti O/Ti S/Ti
TiO2 1.55:1±0.005 --- 2.35:1±0.008 ---
Ti(SO4)O 4.45:1±0.006 0.74:1±0.002 4.80:1±0.005 1.00:1±0.078
The atomic ratio of O/Ti in TiO2-NPs measured by TEM-EDS was 1.55:1±0.005 whilst this ratio
was 2.35:1±0.008 by XPS. This could be due to the surface of the nano-catalyst being contaminated
17
survey scan spectrum at 285eV. The ratio of S/Ti and O/Ti in Ti(SO4)O nano-catalyst have also been
calculated from TEM-EDS and XPS analyses. According to both analyses the atomic ratio of S/Ti
was around 1:1 and for O/Ti was 5:1. Based on this result, it can be conclude that there was only one
oxygen in TiO2 is replaced by sulphate group. This result is consistent with XRD analysis of
Ti(SO4)O.
3.1.2.3 Brunauer–Emmett–Teller (BET) surface area
In general, surface area plays a key role in effectively enhancing the activity of solid acid catalysts
for esterification and transesterification processes as large surface area facilitates the reactant
molecules access to the acid sites on the solid catalyst surface. The nitrogen adsorption isotherms
were used to calculate the BET surface area for both samples whilst the desorption isotherms were
used to calculate the average pore size and total pore volume for both samples using the
Barrett-Joyner-Halenda (BJH) method. The detailed BET, average pore size and total pore volume of TiO2
and Ti(SO4)O nano-catalyst samples are summarised in Table 3. Based on these results, the loading
of sulphate groups on TiO2 has resulted in relatively lower BET surface area as compared to the
TiO2; this may be explained by the aggregation of the very small crystallites in synthesized
nano-catalyst with their low ordering and crystallinity (see figure 7a). It was also found that the average
pore size and total pore volume of Ti(SO4)O nano-catalyst increased compared to TiO2
nano-particles. This might be due to the effect of sulphate group which is incorporated into the TiO2
structure and could perhaps account for the increase in the concentration of the structural disorder
18
Table 3 Summary of the properties of TiO2 and Ti(SO4)O nano-catalysts
Type of catalyst
BET surface
area (m2/g)
BJH mean
pore size (nm)
BJH total pore
volume (cm3/g)
TiO2 48.6398 12.8722 0.156571
Ti(SO4)O 44.4563 22.7347 0.312459
The nitrogen absorption-desorption isotherms of TiO2 and Ti(SO4)O nano-catalysts could be
classified as type IV with one hysteresis loops at a relative pressure range of 0.75-1.0 as depicted in
figure 4. The experimental results clearly confirmed that both samples are mesoporous with the type
of hysteresis loops H1 according to the IUPAC classification witnessed for uniform pore sizes due
to differences in absorption and desorption [82]. In the case of Ti(SO4)O, nevertheless, the pore size
distribution is broader compared to TiO2 NPs sample which is more preferable for minimizing
diffusion limitations for long alkyl chain hydrocarbons in FFA/triglyceride (TG) [83]. It is also
believed that the prepared Ti(SO4)O possesses some interesting characteristics such as mixed large
particles with very fine particles, large and accessible pore surfaces, specifically useful for
photocatalysis.
0.0 0.2 0.4 0.6 0.8 1.0
0 50 100 150 200
0 200 400 600 800 1000
0.0 0.1 0.2 0.3 0.4 0.5 0.6
Average pore size Total pore volume
Pore width (Å)
Pore Volum e ( cm 3/g) 0.00 0.05 0.10 0.15 0.20 0.25 0.30 0.35 dv/d log( w) p or e vo lume (cm 3/g) (a) Adsorption Desorption
Relative pressure (P/Po)
Quant
ity
adsorb
ed (cm
3 /gm STP
)
0.0 0.2 0.4 0.6 0.8 1.0
0 1 2 3 4 5
0 200 400 600 800 1000 1200
0.00 0.02 0.04 0.06 0.08 0.10 0.12 0.14 0.16
Average pore size Total pore volume
Pore width (Å)
Pore Volum e ( cm 3/g) 0.00 0.02 0.04 0.06 0.08 0.10 0.12 0.14 0.16 0.18 0.20 dv/d log( w) p or e vo lume (cm 3/g) (b) Adsorption Desorption
Relative pressure (P/Po)
Quantity ads
orbed (cm
3 /gm S
TP
[image:19.595.54.543.512.695.2])
Figure 4: N2 adsorption-desorption isotherms and total pore volumes for (a) Ti(SO4)O and (b)TiO2
19
3.1.2.4 Morphology of the nano-sized catalysts
Figure 5 (a) and (b) shows the SEM images of TiO2 and Ti(SO4)O samples, respectively, at 100K
magnification. It can be seen that TiO2-NPs (Figure 5a) have relatively uniform size particles with
some agglomerates, whereas titanium sulphate oxide nano-catalyst (Figure 5b) has completely
different particle size distribution.
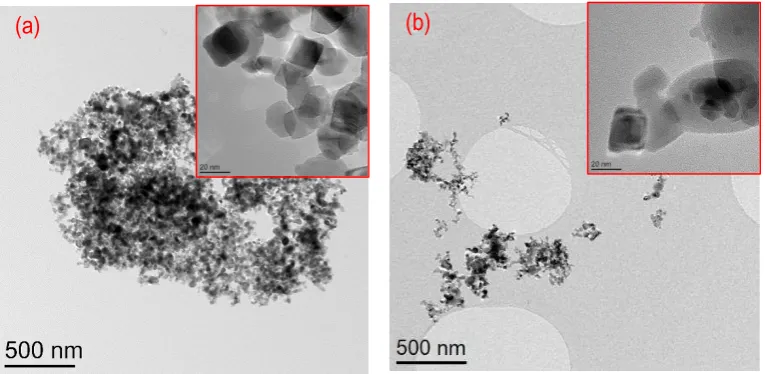
High resolution TEM (HRTEM) clearly confirmed the actual size of the particles, crystallographic
phases and morphologies as depicted in Figure 6 (a) and (b) for TiO2 and Ti(SO4)O nano-catalyst
samples, respectively. It can be observed that the Ti(SO4)Oparticles aggregate to each other forming
a network, possibly due to the electrostatic attraction among SO species.
[image:20.595.83.511.324.482.2]
Figure 5: SEM micrograph images of (a) TiO2 and (b) Ti(SO4)O nano-catalyst samples, in case of
Ti(SO4)O showing the presence of different size of particles.
(b) (a)
[image:20.595.107.490.547.734.2]20
Figure 6: TEM images of (a) TiO2 showing uniform size of particles having irregular morphology
and (b) Ti(SO4)O nano-catalyst showing the presence of mixed large particles with very fine
particles.
The number based particle size distributions of TiO2 and Ti(SO4)O nano-catalysts are presented as
histograms in figure S2 (supplementary information). The synthesised Ti(SO4)O were
non-uniformly distributed and with an average particle size diameter of ~25 nm (as per 108 particles in
different TEM images). In contrast, the particles of TiO2-NPs were less scattered with an average
particle size diameter of ~22.34 nm which is in agreement with the data from supplier. It is also
noticeable from TEM images that most TiO2-NPs have tetragonal or hexagonal morphologies.
HRTEM image confirms polycrystalline TiO2 particles as depicted in figure 7a. The visible lattice
fringes (figure 7a) with interplanar spacing of 3.518Å correspond to (101) lattice planes of TiO2
according to JCPDS-ICDD file 04-014-5762. HRTEM image proves that prepared Ti(SO4)O
nano-catalyst contains a small fraction of polymorphous as depicted in figure7. It was also found that these
results are in agreement with XRD result for Ti(SO4)O nano-catalyst (see figure 1). The lattice
fringes (figure 7c) with interplanar spacing of 3.078Å correspond to (301) lattice planes of Ti(SO4)O
(JCPDS-ICDD 04-011-4951). This was further confirmed by the selected area electron diffraction
(SAED) pattern of the TiO2-NPs sample showing a set of diffused spot rings, as shown in figure
7(b), whilst the SAED pattern of Ti(SO4)O nano-catalyst shows brightness and spotty rings are
shown in figure 7(d).
The details of studies of the d-spacing values calculated from SAED spotty rings with the reported
d-spacing values for TiO2 and Ti(SO4)O in the JCPDS-ICDD card numbers 04-014-5762 (Anatase,
TiO2), 01-072-4815 (Rutile, TiO2) and 04-011-4951 (Ti(SO4)O) are presented in table S3
(supplementary information). It is noteworthy that the results of ICDD agree with d-spacing values
obtained from XRD and SAED in this investigation. These results further confirm the successful
21
[image:22.595.124.475.48.405.2]
Figure 7: Images of HRTEM for (a) TiO2 confirmed the 101 lattice planes and (c) prepared
Ti(SO4)O confirmed the 301 lattice planes; whilst images of (b and d) showing the SAED patterns
for TiO2 and Ti(SO4)O, respectively.
TEM-EDS analysis of prepared Ti(SO4)O nano-catalyst showed an extra strong peak on the EDS
graph at 2.15keV (Figure S3, supplementary information), corresponding to the sulphur element. In
both TEM-EDS graphs, extra peaks of C and Cu were observed due to the carbon-coated copper
TEM grids used during analysis of the samples as shown in figure S3. Furthermore, the ratio of the
intensities of titanium signal to sulphur signal was around 1:1wt% at several different whole captured
areas in TEM images for the synthesised Ti(SO4)O. The presence of a large amount of sulphur spread
over the entire area of the prepared nano-catalyst has been further verified by TEM-mapping analysis
(figure 3c, supplementary information). These findings provide direct evidence that sulphur,
titanium and oxygen are the main elements present in the prepared nano-catalyst. Meanwhile, Ti(SO4)O
Amorphous region
Crystalline region 0.3078 nm
(c)
TiO2
0.3518 nm
(a)
[301] [111] [201] [112] Ti(SO4)O
[122]
[222] [410] [610]
[200]
(d)
[200] A [210] R [110] R
[101] A
[004] A [200] R [211] A [220] R [221] R
(b)
22 titanium and oxygen are the only elements present in the raw material nano-catalyst (TiO2-NPs),
except cu and c from TEM grids (see figure S3a, supplementary information).
3.1.2.5 Stability analysis
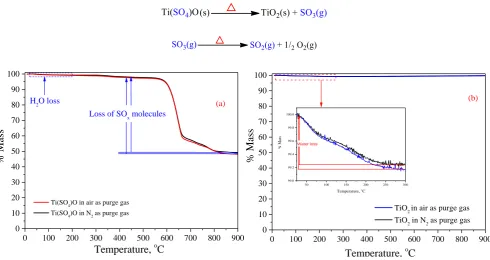
TGA was carried out to identify the thermal and oxidation stability of the nano-catalyst samples
during heating from 25°C to 900°C. Figure 8 reveals the stability of Ti(SO4)O and TiO2 samples in
nitrogen (thermal) and air (oxidative). The TGA curve of Ti(SO4)O displayed a small weight loss at
50°C to 200°C, indicating the desorption of water molecules from the surface of the nano-catalyst
(see figure 8a). One can see that Ti(SO4)O sample has an almost negligible weight loss up to 600°C
heating in both air and N2 purge gases. These results clearly indicate that the sulphate groups are
fairly stable in the structure of the prepared nano-catalyst. The results also showed significant weight
loss (about 47%) at 600°C to 800°C. In contrast, there is no further mass loss up to 900°C. This
might be due to the degradation of sulphate groups in the Ti(SO4)O nano-catalyst sample, as can be
described by the following equations:
0 100 200 300 400 500 600 700 800 900 0 10 20 30 40 50 60 70 80 90 100
Ti(SO4)O in air as purge gas
Ti(SO4)O in N2 as purge gas
% Ma
ss
Temperature, oC
H2O loss
Loss of SOx molecules
(a)
0 100 200 300 400 500 600 700 800 900 0 10 20 30 40 50 60 70 80 90 100
50 100 150 200 250 300
99.0 99.2 99.4 99.6 99.8 100.0 % Mas s
Temperature, o
C Water loss
% Ma
ss
Temperature, oC
TiO2 in air as purge gas
TiO2 in N2 as purge gas
(b)
[image:23.595.53.544.418.678.2]
23
On the other hand, the mass loss of the unmodified TiO2 nano-particle (see figure 8b) shows that
there was only one stage of weight loss from ambient temperature to 220°C, due to the desorption
of H2O molecules from the surface of TiO2 nano-particles, evidence of which was observed also in
absorption peaks in FT-IR spectrum at 1690.1cm-1 and 3400cm-1 (see figure 2). It can be noticed
also that the stability of the nano-catalysts in nitrogen as a purge gas (inert) and air as a purge gas
(oxidiser) show similar behaviour.
4000 3500 3000 2500 2000 1500 1000 500
0.00 0.01 0.02 0.03 0.04 0.05 0.06
H2
O
H2 O CO
2
gas
SO2 gas (+99.9% of purity) Ti(SO4)O in air as purge gas
CO2 gas
CO
2
gas
SO
2
gas
SO2 gas
Abs
orbanc
e
(Abs
)
Wave numbers (cm-1)
SO2 gas CO2 gas
CO 2 gas
H2
[image:24.595.86.512.224.539.2]O
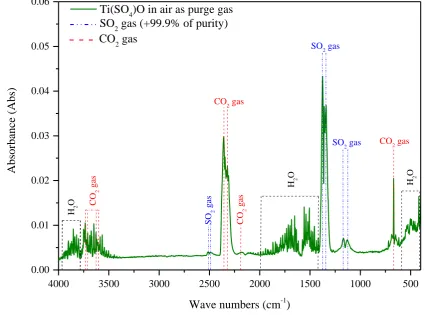
Figure 9: 2D representation of FT-IR spectrum for evolved gaseous from Ti(SO4)O
The 2D representation of output FT-IR spectrum for evolved gases from the TGA-FTIR analysis for
Ti(SO4)O are presented in figure 9. It can be observed that the main evolved gases have been
identified as SO2-loose, CO2-loose, and H2O-loose through spectral interpretation and comparison
with database reference spectra for pure SO2 and CO2. In Grand-Schmidt thermographs for Ti(SO4)O
nano-catalyst, four regions with intense peaks are observed which are: (i) bands between (3800cm
24
always present when the sample is sensitive to moisture; (ii) peaks between 3580cm-1-3780cm-1 and
at (2250cm-1-2400cm-1) as well as at around (600cm-1-720cm-1) are related to O=C=O vibration
bands contaminated CO2 from atmosphere; (iii) bands between (1080cm-1-1400cm-1) and at region
(2460cm-1-2052cm-1) due to O=S=O vibration bands from decomposition of the nano-catalyst; and
(iv) peaks showed at low wavenumber (400cm-1-580cm-1) attributed to an intermolecular bond
bending vibrations which are usually not taken into account. It should also be noted that there was
no hydrogen sulfide gas detected during the pyrolysis of this nano-catalyst, confirming that there
was no sulfonic acid attached on the surface of TiO2-NPs.
In the case of TiO2 NPs, there were only CO2 and H2O species released at various time periods. The
amount of CO2 and SO2 evolved species versus time of TiO2 and Ti(SO4)O nano-catalysts in air and
N2 as purge gases during pyrolysis are shown in figure 10 (a & b).
In both samples the wavenumber ranges (2150cm-1 to 2400cm-1) and (1250cm-1 to 1400cm-1) were
chosen to process the chemigram profiles of CO2 gaseous and SO2 gaseous in both nano-catalysts,
respectively. The analysis of CO2 chemigram profiles showed negligible amounts of CO2 gases are
released from the pyrolysis of both nano-catalysts; whereas, the surface of Ti(SO4)O nano-catalyst
seen possessed a higher value of contaminated CO2 gases as compared to the surface of TiO2 NPs,
(see figure 10a). Meanwhile, the evolved SO2 gaseous (as shown in figure 10b) in the decomposition
of Ti(SO4)O nano-catalyst started after 54 minutes of the pyrolysis process with high concentration
then the width of the peak increased with time up to the end of pyrolysis. These results further
25
0 10 20 30 40 50 60 70 80 90 100
-1.0 -0.5 0.0 0.5 1.0 1.5 2.0
In
tensi
ty
Time, min
CO2 profile of TiO2 in air
CO2 profile of Ti(SO4)O in air
CO2 profile of Ti(SO4)O in N2
CO2 profile of TiO2 in N2
[a]
0 20 40 60 80 100
0 1 2 3 4 5
In
tensi
ty
Time, min
SO2 profile of Ti(SO4)O in air SO2 profile of TiO2 in air SO2 profile of Ti(SO4)O in N2 SO2 profile of TiO2 in N2
[image:26.595.47.552.52.224.2][b]
Figure 10: Chemigram profiles of (a) CO2 (b) SO2 species released from TiO2 (b) Ti(SO4)O
nano-catalyst samples
3.2 Catalytic performance
The FAME yield was investigated under different catalytic process parameters including methanol
to UCO mole ratio, reaction temperature, catalyst loading, and time of
esterification/transesterification, see figure 11, in order to establish the optimum reaction conditions
for the esterification/transesterification process of UCO to biodiesel. The
esterification/transesterification of UCO with methanol using Ti(SO4)O as a solid acid catalyst is a
liquid-liquid-solid reaction (three phase system) at which the mass transfer rate of reactant molecules
between the UCO-methanol-catalyst phases is very slow. The conversion rate is normally found to
26
[image:27.595.50.539.50.352.2]
Figure 11: The effects of (a) reaction time, (b) Ti(SO4)O nano-catalyst loading to UCO, (c) mole
ratio of methanol to UCO, and (d) reaction temperature on the percentage of FAME yield.
The reaction time was varied between 30 to 540 minutes, while keeping other reaction process
parameters constant at 1.0 mass% of Ti(SO4)O catalyst loading to UCO, 6:1 molar ratio of methanol
to UCO, 65oC reaction temperature, 600RPM agitation rate, 0.14% moisture content, and 2.034
mass% free fatty acid contents in feedstock. It can be noted that the increase of reaction time from
30 minutes to 3 hours led to the enhancement of FAME yield to 89% as shown in Figure 11(a). This
can be explained by the rate constants for mono-glycerides and di-glycerides conversion to glycerol
and mono-glycerides being very low compared to triglycerides [86]. Additionally, a longer reaction
time (after 6 hours) resulted in slowly reduced production yield, possibly due to increasing the
probability of pushing the reverse reaction. Similar results has been reported by Nayebzadeh [29]
where a further increase in esterification reaction time resulted in a production yield decrease.
The optimum ratio of Ti(SO4)O catalyst loading was determined under the other fixed reaction
conditions, i.e. at 3hrs reaction time, 6:1 molar ratio of methanol to UCO, 65oC reaction temperature,
0 20 40 60 80 100
0 60 120 180 240 300 360 420 480 540
% F A M E y ield
Reaction time, min
0 20 40 60 80 100
0 0.2 0.4 0.6 0.8 1 1.2 1.4 1.6 1.8 2
% F A M E y ield
% Catalyst loading to oil
0 20 40 60 80 100
0 3 6 9 12 15 18
% F A M E Yie ld
Methanol to oil mole ratio
3:1 6:1 9:1 12:1 15:1 18:1
0 20 40 60 80 100
25 35 45 55 65 75 85 95
% F A M E y ield
Reaction temperature, oC
(a) (b)
27 600RPM agitation rate, 0.14% moisture content, and 2.034 mass% free fatty acid. Figure 11(b)
depicts that 1.5% of Ti(SO4)O was the optimum amount in achieving the highest production yield
of 92.5% under aforementioned reaction conditions This is due to fact that increasing the catalyst
concentration in the system leads to an increase in the total number of active sites which results in
faster reaction rate to reach reaction equilibrium [87].
The stoichiometric ratio for transesterification reaction, theoretically, requires three moles of
methanol per mole of TG but esterification reaction requires one mole of methanol per mole of FFA.
However, the transesterification process experimentally requires an excess of methanol in order to
push the equilibrium reaction forward direction of methyl esters as the transesterification process is
a reverse reaction [88]. Maximium conversion of triglycerides into FAME is ensured by the use of
excess methanol due to esterification/transesterification being a reversible reaction. Figure 11(c)
shows the effect of various mole ratios of methanol to UCO under the other fixed reaction process
at 3hrs reaction time, 1.5 mass% Ti(SO4)O catalyst loading to oil, 65oC reaction temperature,
600RPM agitation rate, 0.14%moisture content, and 2.034 mass% FFA contents. The highest yield
of 94.3% was achieved at 9:1 mole ratio of methanol to UCO. It can be noted that an increase in
methanol to UCO from 1:1 to 3:1 resulted in a slight effect on the FAME yield, while further excess
of methanol from 4:1 to 9:1 increased the production yield up to the highest FAME yield.
Afterwards, there was a decline in the production yield with higher mole ratios higher than 12:1.
This can be explained by an additional amount of methanol helping to drive the reversible side of
reaction to re-form mono-glyceride with di-glyceride and the solubility of the by-product could also
be increased in the solution. In addition, water (by-product) is obtained during the esterification of
FFAs in UCO feedstock lowers the activity of the catalyst.
The rate of esterification/transesterification reaction is highly affected by the reaction temperature
according to Arrhenius’s equation. A higher temperature also reduces the viscosities of the oils,
28 different temperatures depending on the fatty acid profiles of raw sample oils and the type of catalyst.
The effect of temperature on the FAME yield using Ti(SO4)O as a solid acid catalyst was examined
by varying the reaction temperatures from 25oC to 90oC while other process parameters were kept
constant at 3hrs reaction time, 1.5 mass% Ti(SO4)O catalyst loading, 9:1 molar ratio of methanol to
UCO, 600RPM agitation rate, 0.14%moisture content, and 2.034 mass% free fatty acid content. It
was found that the yield consistently increased at higher reaction temperature as shown in Figure
11(d). This can be explained by the fact that esterification/transesterification is an equilibrium
process and at 25oC reaction temperature energy was not enough to break down the ester bond in the
TG molecules, whilst increase of the reaction temperatures to 55oC improves the FAME yield by
27.4%. A further increase of reaction temperature significantly enhanced the production yield by
66.3% possibly due to the fact that the reaction temperature at 65oC generates more nucleophilic
sites in the system. Therefore with a temperature slightly higher than the boiling point of methanol,
the nucleophilic attack on the carboxylic/carbonyl groups in FFA/TG are further increased.
Moreover, the highest yield of FAME (97.1%) was produced at 75oC, due to the acceleration of the
mass transfer rate between the UCO-methanol-catalyst phases; higher temperature helps the
activation of carboxylic/carbonyl groups in FFA/TG by protonation and the methanol nucleophilic
attack on the carboxylic/carbonyl groups [89]. In this work the optimum reaction temperature was
found to be lower than previous work, most probably due to the high acidity of the catalysts leading
to higher activity during the reaction. Further investigations on the kinetics of this reaction could be
carried out and reported in future publications.
The presence of FFA in the feedstock has a great influence on the poisoning of solid acid catalysts
due to the formation of water from the esterification process[88]. Oleic acid was added to virgin oil
to assess the effect of FFA on the catalytic activity of Ti(SO4)Oas solid acid nano-catalyst. The
amount of FFA in oil was varied from 0.5 to 7% whilst the other parameters were set constant at
29
molar ratio of methanol to oil, 75oC reaction temperature, 600RPM agitation rate, and 0.14%
[image:30.595.43.562.166.239.2]moisture content.
Table 4: The effect of FFA in feedstock on the percentage of FAME yield
Oleic acid to oil, wt % 0.5% 1% 2% 3% 4% 5% 5.5% 6% 6.5% 7%
FAME yield % 97.1 97 97.1 97.01 96.14 95.69 93.42 91.37 75.39 64.5
Noticeable from table 4, there was a slight decrease of yield up to 6.0wt% FFAs in oil, then there
was a significant decrease after 6wt%, probably as the rapid esterification of oleic acid promotes the
reverse methanolysis reaction of FAME and glycerol which demotes the transesterification
process[90]. For that reason the esterification/transesterification reaction could be carried out at
higher temperature and shorter time for raw materials containing high amount of FFA to in order to
achieve maximum yield of FAME [88, 89, 91]. The investigation of the effect of high temperature
on the yield of raw materials containing high FFA could the subject of future studies.
The reusability of Ti(SO4)O solid acid catalyst was also investigated to determine the
nano-catalyst life time as it can help reducing the production cost for industrial purposes. It was found that
the Ti(SO4)O can be re-used up to 8 cycles with a slight drop in catalytic activity (Figure 12) for the
esterification/transesterification reactions using the optimised parametric processes conditions (3hrs
reaction time, 1.5 mass% Ti(SO4)O loading , 9:1 molar ratio of methanol to UCO, 75oC reaction
30
Figure 12: The effect of reusability of Ti(SO4)O nano-catalyst on the percentage of FAME yield.
The results revealed that the FAME yield significantly decreased for 9 and 10 trials by 11.19% and
24.16%, respectively (see Figure 12); this could be probably due to the blockage of active centres of
catalyst by triglyceride (TG)/product or catalyst leaching [12, 92]. The powder XRD experiments
were carried out for the recycled nano-catalyst after each run in order to investigate the catalytic
deactivation. The result showed that Ti(SO4)O solid acid nano-catalyst maintained its structure after
8 runs as shown in Figures 13 and 14. The XRD patterns of recycled Ti(SO4)O from run 1 to run 7
shows that there was no loss of SO groups or formation of any new phases as shown in Figure 13.
This is an indication of the stability of the sulfate group in Ti(SO4)O nano-catalyst and durability for
the first 7 cycles in simultaneous esterification and transesterification of UCO into biodiesel.
97.1 97.1 97.0 97.1 96.85 97.0 96.45 94.12
85.91
72.94
0 20 40 60 80 100
1 2 3 4 5 6 7 8 9 10
F
AME y
ield%
31
15 20 25 30 35 40
Run-7
Run-6
Run-5
Run-4
Run-3
Run-2
Position [o2Theta](Copper(Cu))
[image:32.595.109.488.53.336.2]Run-1
Figure 13: The powder XRD patterns of re-used Ti(SO4)O nano-catalyst for run 1 to run 7.
15 20 25 30 35 40
Run 10
Run 9
Run 8
Position [o2Theta](Copper(Cu))
Run 7
24.0 24.5 25.0 25.5 26.0 26.5 27.0
Position [o2Theta](Copper(Cu))
Run 10
Run 9
Run 8
Run 7
[image:32.595.94.490.381.683.2]32
Figure 14 shows formation of diffraction peak at 2 value of 25.32° assigned to the (101) reflection
for the anatase structure of TiO2 and increase of its intensity with continued re-use of the
nano-catalyst beyond 8 runs (9% and 34.7% of anatase phase after 9 and 10 runs, respectively). The
decrease in acidity of Ti(SO4)O nano-catalyst loss of SO species might affect the esterification of
FFA in UCO feedstock. In contrast, some researchers reported that leaching of SO species was
not the main cause for the decline in the catalytic activation of different sulfonated catalysts [93, 94].
However; in this work catalyst has a different structure than the sulphated metal oxide and XRD
results confirmed that the catalytic deactivation of prepared solid acid nano-catalyst is caused by
leaching of SO species (see Figure 14). The regeneration of the Ti(SO4)O solid acid nano-catalyst
and the performance of the regenerated nano-catalyst for simultaneous esterification and
transesterification of UCO would be the subject of future studies.
3.3 Biodiesel characterizations
The biodiesel produced in the esterification/transesterification processes from UCO was
characterized according to ASTM and EN standards. These results are summarised in Table 5. It can
[image:33.595.65.534.507.702.2]be noted that the produced biodiesel is in the range of acceptable standard specifications of biodiesel.
Table 5 Properties of biodiesel produced from UCO over Ti(SO4)O nano-catalyst
Property Unit
Limits
Synthesised biodiesel
ASTM D6751 EN14214
Flash point oC 93 min 101 min 155
Kinematic viscosity mm2/s 1.9-6.0 3.5-5.0 4.58
FAME content % mass --- 96.5 min 97.1
Acid number mgKOH/g 0.8 max 0.5 max 0.32
33 Optical microscopy was carried out at different temperatures to detect the formed crystals in the fuel.
Figure 15 illustrates the optical microscopy images for prepared biodiesel using hot-stage
microscopy (HSM) at different temperatures. It can be observed that there were no detectable
crystals during cooling the sample from 50oC to -6oC. Formation of several tiny needle-like crystals
was observed below -9°C. The nucleation of these tiny needle-like crystals increased at -15oC whilst
the size of crystals increased during further by cooling to -21oC.
[image:34.595.75.523.210.586.2]
Figure 15: HSM images of the prepared biodiesel at different temperatures
3.4 Discussions
The use of chlorosulfonic acid as a reagent for sulfonation of nano-sized titanium dioxide is a
promising direction for loading of sulphur species into titanium dioxide. The obtained titanium
sulphate oxide or titanium oxysulfate nano-catalyst has a unique and different chemical structure
+25oC 0oC -3oC
-6oC -9oC -12oC
34 than titanium dioxide (see figure 1) and those from published work on sulphated metal oxides [30,
34, 41, 83, 95, 96]. This obvious change in the chemical structure makes the prepared Ti(SO4)O
nano-catalyst more stable compared to all reported sulphated metal oxide [41] as in previous
catalysis the sulphate species located on the surface of metal oxides which makes the molecule
unstable [30, 34]. The stability of synthesised Ti(SO4)O nano-catalyst is due to the formation of
polydentate sulphate species inside the structure of TiO2 which also leads to a higher tolerance to
high percentage of FFAs in raw material for biodiesel production. This might be due to the synergic
activation of polydentate sulphate species inside the structure of TiO2 nano-particle resulting in an
increase of the Lewis and Brønstedacid sites of the nano-catalyst. The effect of different TiO2 phases
(anatase, rutile and brookite) and different SOx loadings on the nano-sized TiO2 template on the
catalytic performance would be the subject of future studies in order to have a better understanding
about the influence of Lewis and Brønstedacid sites on the yield of FAME produced from
simultaneous esterification and transesterification of UCO. Furthermore, there was no evidence that
the presence of absorbed carbon dioxide from atmosphere had an influence on the catalytic activity
of Ti(SO4)O catalyst, but further investigations should be performed in the future studies in order
to better understand the surface chemistry of this catalyst under different conditions. The amount
of yield and optimised process conditions (e.g. catalyst loading, methanol to UCO molar ratio,
reaction time, temperature, tolerance to FFA and catalyst reusability) have been significantly
improved using the catalyst synthesised in this work as compared to the reported sulphated metal
oxides [30, 34]. Finally, the conditions for simultaneous esterification and transesterification
processes using previous solid acid catalysts compared to the current study are presented in Table
35 Table 6 A comparison of reported optimum process condition for the biodiesel production using
solid acid nano-catalyst
Current study Wang et al. [48] Chen et al. [34]
Oil/fat feedstock UCO UCO Cottonseed oil
Methanol to oil ratio 9:1 10:1 12:1
Type of catalyst Ti(SO4)O SO /TiO2/La+3 SO /TiO2 SO /ZrO2
Amount of catalyst% 1.5 5 2
Time, hr 3 1 8
Particle size, nm 25 Not reported Not reported
Surface area, m2/g 44.47 229 99.2 91.5
T, oC 75 110 230
FAME yield % 97.1 >90 90 80
Catalyst recycled 8 5 >4
4. CONCLUSIONS
A novel method has been used to impregnate sulphate group into TiO2-NPs to synthesise titanium
sulphate oxide or titanium oxide sulfate [Ti(SO4)O] nano-catalyst, which can be used as a solid super
acidic heterogeneous catalyst for different applications due to its high activity and stability. Different
analytical techniques have been employed to differentiate the prepared Ti(SO4)O nano-catalyst from
TiO2-NPs, all confirming a 100% Ti(SO4)O phase. The synthesised nano catalyst and its
performance has not been reported in the literature. It was found that Ti(SO4)O can be used as a
novel solid acid nano-catalyst for biodiesel production from low quality and cheap feedstock such
as UCO. The effect of operating process conditions such as reaction time, catalyst loading, methanol
to UCO ratio, reaction temperature, %FFA, and re-usability/stability on the biodiesel yield were
examined. It was found that under certain process parameters a FAME yield of 97.1% can be
achieved using Ti(SO4)Oas a nano-catalyst. The heterogeneous nano-catalyst was found to be most
effective for the feedstock containing FFA up to ≤6wt%. This result indicated that the novel solid
acid nano-catalyst can be used for simultaneous esterification and transesterification of UCO to
36 acid catalysts. The nano-catalyst can be re-cycled and re-used up to eight times without deactivation
of the active sites, overall with superior functionality, significantly improved process conditions and
higher tolerance to FFA as compared to other reported metal oxide catalyst. Additionally, the
produced biodiesel was analysed according to the ASTM and EN standards and the specifications
are within acceptable biodiesel limits.
ACKNOWLEDGEMENTS
The authors would like to acknowledge the Kurdistan Regional Government (KRG) for providing
fund (HCDP/R2-DE-23) for this research and Dr Mohammed Rehan, Dr Adrian Cunliffe, Dr Tim
Comyn, Dr Michael Ward, Mrs Susanne Patel and Mr Stuart Micklethwaite for their technical
assistance.
APPENDIX A. SUPPLEMENTARY DATA
Supplementary data associated with this article can be found in the online version.
REFERENCES
1. Keskin, A., M. Gürü, and D. Altıparmak, Biodiesel production from tall oil with synthesized Mn and Ni based additives: Effects of the additives on fuel consumption and emissions. Fuel,
2007. 86(7-8): p. 1139-1143.
2. Ma, F. and M.A. Hanna, Biodiesel production: a review1. Bioresource Technology, 1999. 70(1):
p. 1-15.
3. Salvi, B. and N. Panwar, Biodiesel resources and production technologies–A review. Renewable
and sustainable energy reviews, 2012. 16(6): p. 3680-3689.
4. Al Zuhair, S., Production of biodiesel: possibilities and challenges. Biofuels, Bioproducts and
Biorefining, 2007. 1(1): p. 57-66.
5. Gardy, J., A. Hassanpour, X. Lai, A. Cunliffe, and M. Rehan, The influence of blending process
on the quality of rapeseed oil-used cooking oil biodiesels. Environmental Science, 2014. 3: p. 233-238.
6. Zhang, Y., M.A. Dubé, D.D. McLean, and M. Kates, Biodiesel production from waste cooking
oil: 2. Economic assessment and sensitivity analysis. Bioresource Technology, 2003. 90(3): p. 229-240.
7. Javidialesaadi, A. and S. Raeissi, Biodiesel production from high free fatty acid-content oils: Experimental investigation of the pretreatment step. APCBEE Procedia, 2013. 5: p. 474-478.
8. Chai, M., Q. Tu, M. Lu, and Y.J. Yang, Esterification pretreatment of free fatty acid in biodiesel
production, from laboratory to industry. Fuel Processing Technology, 2014. 125: p. 106-113.
9. Lotero, E., Y. Liu, D.E. Lopez, K. Suwannakarn, D.A. Bruce, and J.G. Goodwin, Synthesis of