Building and Applying Geographical Information System Grids
Galip Aydin1,2, Ahmet Sayar1, 2, Harshawardhan Gadgil1,2, Mehmet S. Aktas1,2, Geoffrey C. Fox1,2,3, Sunghoon Ko1, Hasan Bulut1,2,and Marlon E. Pierce1
1
Community Grids Laboratory
2
Department of Computer Science
3
Department of Physics Indiana University
{gaydin, asayar, hgadgil, maktas, hbulut, mpierce}@cs.indiana.edu {gcf, shko}@grids.ucs.indiana.edu
Abstract: We discuss the development and application of Web Service-based Geographical Information System Grids. Following the WS-I+ approach of building Grids on Web Service standards, we have developed Data Grid components for archival and real-time data, map generating services that can be used to build user interfaces, information services for storing both stateless and stateful metadata, and service orchestration and management tools. Our goal is to support dynamically assembled Grid service collections that combine both Geographical Information System services with more traditional Grid capabilities such as file transfer and remote code execution. We are applying these tools to problems in earthquake modeling and forecasting, but we are attempting to build general purpose tools by using and extending appropriate standards.
1. Introduction: Information Architecture for the Data Deluge
As Grid technologies [1][2][3][4] and their applications mature, a common theme in many projects has been the recognition that distributed data access is at least as important as scientific computation. Data access is often thought of as dealing with large data archives and their replicas [5][6][7], but in this paper we argue that continuous data streaming, especially for real-time applications, is also essential. In general we see the future of many Grid applications as being dominated by data stream filtering, management, event detection, and data mining on data streams from sensors. The connection between sensor data sources and Geographical Information Systems (GIS) is particularly strong. Developing a Web Service architecture that allows us to manage these data sources, connect them to data filters and applications, and deliver them to users in a comprehensible fashion serves as our focus in this paper. This subject thus naturally encompasses GIS service implementations, information systems, streaming data management software, messaging substrate technology, and workflow. We will present our work on these topics in this paper, but we begin with some general architectural principles.
1.1. Sensor Filter Grids
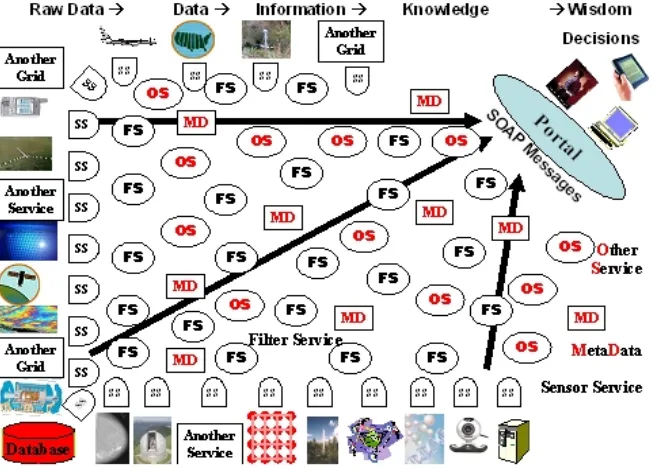
(SFG). These Grids are built around streams supported by a powerful messaging system to achieve high interactivity and performance for distributed analysis. The approach is applicable to management and analysis of general distributed information resources including those found in data analysis as well as the documents and presentations associated with a scientific activity. Our approach exploits the multi-tier federated and hierarchical structure of most problems of the type sketched in Figure 1.
[image:2.612.144.473.279.514.2]A Sensor Filter Grid can support the scenario of Figure 1. One can define a particular Sensor Filter Grid to correspond to a particular workflow linking services together and produce the associated support for this workflow. Figure 2 shows what we call the microscopic workflow in Sensor Filter Grid federating different information sources together. Different instances of this paradigm correspond to different configuration parameters and to different choices of component application services in the workflow. The different instances share the overall paradigm of workflow, sensors and filters as well as general Grid system services. We discuss implementations of these ideas in Sections 5-7.
Figure 1 Vision of Sensor Filter Grid with filters (FS) shown from many fields, processing SOAP messages from sensors (SS), Grid(let)s and services controlled by meta-data (MD) and supported by other services (OS).
A Sensor Filter Grid is built around three distinctive features: information services that present data through traditional service interfaces; filters that accept data with these interfaces, transform them and present them with the same interfaces; and streaming connections between all services that provide on the fly archiving, high-performance transport, security and fault tolerance. A very common feature is that the filters are composable in a distributed federated hierarchical fashion. We suggest that scientific data analysis has this characteristic whereas for example distributed simulations would typically not be composable in this fashion.
application dependent dataflow. We term this the microscopic workflow as it is embedded in the Gridlets shown in Figure 4. The filters in this Grid style combine hierarchically e.g. in information retrieval one can merge ranked lists to obtain a new ranked list while in statistical analysis, moments and histograms can easily be combined.
FS =
BFS
BFS BFS
BFS BFS
[image:3.612.230.372.150.310.2]BFS
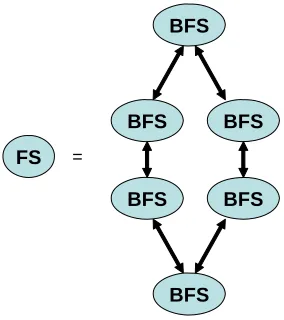
Figure 2 A Filter Service (FS) is a general workflow (the microscopic workflow) of Basic Filter Services (BFS).
Information Resource
Receive Request/Select
Get Status
Multi-Resolution Data Get
IS =
Information Service
BFS =
Basic Filter Service
Filter Resource
Receive Request/Select
Get Status
Multi-Resolution Data Get Issue
Request/Select
Request Status
Multi-Resolution Data Put
Figure 3 A Sensor Filter Grid is built from information resources wrapped as Web Services and basic filters that either transform or aggregate information. Information services and filters support identical service Interfaces
[image:3.612.126.485.358.564.2]type of support is independent of the Sensor Filter Grid application area; one must just distinguish service specification from the location and number of services. Note that there is no implication that all filter actions are identical; one will design the messages on the data streams between filters so they are self describing. Thus, in information retrieval the filter services are designed so they can accept full documents (specified by a URI), title or simple metadata. This flexible construction allows filter trees to be built that don't depend on number and exact features of information resources.
1.2. Role of Data Streams
A critical feature of the architecture is the use of a powerful messaging infrastructure NaradaBrokering [8][9] for linking between the services in Figure 3 and Figure 4. This allows all services to be linked by managed reliable streams. NaradaBrokering can be deployed as a distributed set of brokers, and (in current releases) as Apache Axis handlers. This release supports WS-ReliableMessaging [10], WS-Eventing and WS-Notification [11]. These capabilities allow fault tolerance and asynchronous messaging with publish-subscribe semantics [12]. We are developing a sophisticated management environment that controls and monitors all streams in a Grid [13][14] and extends fault tolerance across streams, services and message brokers. The latter allows one to control the flow of data into filters so that there is no overflow. NaradaBrokering supports the subscription of redundant services to aid in fault tolerance. The Web Service messages flowing in NaradaBrokering can be archived at any link. This provides for dynamic caching to support system performance and is also used in message throttling. This NaradaBrokering archiving service replaces the replica management familiar from current particle physics Grids [7]. The archive service is of course supported by a metadata catalog to manage it.
NaradaBrokering supports software multicast and so it is straightforward to build collaborative sessions by multicasting the links. NaradaBrokering has been successfully used for audio-video conferencing and other collaborative tools in the commercial Anabas product and the open source GlobalMMCS project [15][16]. A current successful use of this technology is for integrating seismic archives with data assimilation techniques [17] for medium-range (5-10) earthquake forecasting. We are also developing real-time GPS sensors used by NASA for Earthquake monitoring [14]. We deploy simple versions of the architectures proposed here with sensors, filters and data mining codes linked by real-time streams.
We need to ensure that our architecture streams information as fast as possible between services while retaining the advantage of Grids and Web Services. This can be achieved as all service messages are handled by the “system” through NaradaBrokering which formally one “binds” to SOAP as the transport. There are two important aspects that need to be optimized – the transport protocol and the representation of the information in the message. For the protocol we exploit NaradaBrokering’s ability to support general protocols which can be chosen independently of the application with in a service model the last handler in a container choosing the protocol. UDP, TCP, parallel TCP, HTTP, HTTPS are currently supported. One should also investigate the FAST kernel [18]. NaradaBrokering can also link to network monitoring tools and here we should study links to the MonALISA agent-based global monitoring and control system [19]. This is widely deployed in the physics community and now part of the Virtual Data Toolkit [20].
developing ways of representing XML in binary formats for fast message exchange [21][22] [23]. We are developing [24] a Web Service negotiation language for higher performance Web Services to negotiate both the protocol described above as well as the representation scheme such as choice between Fast and Binary XML. Initial negotiation will be done using standard SOAP angle-bracketed messages to determine the supported representation and transport protocol capabilities. We will employ handlers to take care of the conversion and transport issues, which will make the negotiation and transport process transparent to the services. Once the services agree on the conditions of the data exchange, handlers convert XML data into an appropriate binary format and stream it over a high performance transport protocol using NaradaBrokering.
FS
IS
FS IS
FS IS
[image:5.612.162.451.229.333.2]FS IS Gridlet =
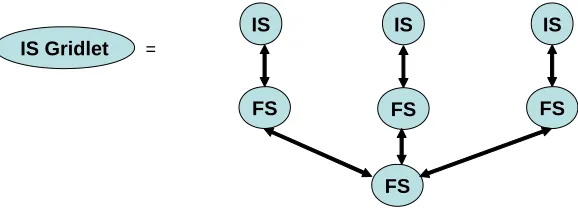
Figure 4 A Gridlet is defined by combining information services and filters. The Multiple IS in a Gridlet can be explicitly defined or generated by IS virtualization using Sensor Filter Grid directory and Metadata services
1.3. Overview of Paper
In this paper we describe our efforts to implement the general architecture outlined above, with specific applications to our SERVOGrid project. Our general approach is based on the “WS-I+” approach [4] to building Grids: we start from core Web Service standards (SOAP, WSDL, UDDI) and build outward on other applicable World Wide Web Consortium and OASIS standards. General overviews of Grid technology are available from [1][3].
Section 8 proposes that GIS Grid and Web Services may be usefully abstracted and applied to other, non-GIS domains. More extensive technical documentation on this project is available from the SERVOGrid Technical Documentation report [27]. More information and project downloads are available from [28].
2. Web Feature Services to Support Data Grids
Geographical Information System standards provide useful data models and specifications for data transport. In this section we discuss using these to build services for archival data storage and access through Web Service protocols. We use this to provide access to Global Positioning System records, earthquake fault descriptions, and seismic activity records. More detail on supported formats and available data can be found in [27]. We address problems in supporting real-time streaming data is addressed in Section 5.
2.1. Building Web Feature Services with Web Service Principals
The Open Geospatial Consortium Web Feature Service (WFS) [29] implementation specification defines interfaces for data access and manipulation operations on geographic features using HTTP as the distributed computing platform. Via these interfaces, a web user or service can combine, use and manage geographic data from different sources by invoking several standard operations.
As a minimal requirement a basic Web Feature Service should be able to provide requested geographical information as Geographic Markup Language [30] feature collections. However, more advanced versions also support create, update, delete and lock operations. Three operations must be supported by a basic Web Feature Service: GetCapabilities,
DescribeFeatureType and GetFeature.
Web Feature Services allows clients to access and manipulate the geographic features without having to consider the underlying data stores. Clients’ only view of the data is through the Web Feature Service interface which allows the data providers to integrate various types of data stores with one Web Feature Service instance. Clients interact with a Web Feature Service by submitting database queries encoded in Open Geospatial Consortium Filter Encoding Implementation and in compliance with the Open Geospatial Consortium’s Common Query Language.
We have initially implemented a Web Services version of basic WFS which supports the three mandatory operations through a WSDL interface. Each operation takes an XML document as argument and returns another XML document as response. While implementing these operations in a Web Service context, we had to choose appropriate types corresponding to the programming world. Ideally, we would define these in the <wsdl:types> section of our WSDL service definition, but unfortunately support for complicated, developer-defined types in Apache Axis (our deployment framework) is limited.
Since the requests and responses are well-defined XML documents one possibility is to create object representations of these in our favorite programming language, i.e. we can create a Java Object for each GetFeature request document and the returning Geographic Markup Language document can be cast into another Java object. That is, we will make the service itself (rather than the container) responsible for XML serialization and de-serialization. In this case the communication between the Web Feature Service and the client is based on exchanging Java objects. However this approach severely undermines the interoperability with clients who might use other programming languages such as C++ or Python to communicate with our service. As a simpler solution we have used strings as argument and return types in these operations. This allows clients who use other programming APIs to communicate with our Web Service to simply send and receive XML documents without any format conversions. However this method also has a significant shortcoming; since the Web Service returns the resulting XML document as an <xsd:string>, this has to be constructed in memory and the size will depend on several parameters such as the system configuration and memory allocated to the Java Virtual Machine etc. Consequently there will be a limit on the size of the returned XML documents.
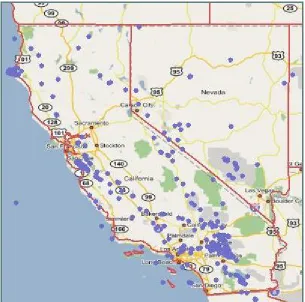
We have tested our Web Service implementation of WFS in several scenarios such as producing fault maps of Southern California, displaying seismic history of particular regions on the map etc. A very interesting application domain was integrating our GIS services with Pattern Informatics [32] code to forecast future seismic activities in a selected geographic region. This is described in more detail in [17].
To measure the performance of our WFS implementation we made several tests using seismic catalog for year 1992 (the most eventful year) from Southern California Earthquake Data Center (SCEDC). Tests were performed for the following lower bounds with seismic event magnitudes: M>5.0, 4.5, 4.0, 3.5, and 3.0. These correspond to increasing data file size, as shown in Table 1. The entire catalog from 1932 to 2004 has 401,403 entries.
Table 1 SCEDC entries for test year 1992
Event Magnitude Lower Bound
Number of Seismic Events
GML Result Size (KB)
5.0 19 11
4.5 67 36
4.0 209 106
3.5 587 287
3.0 1790 880
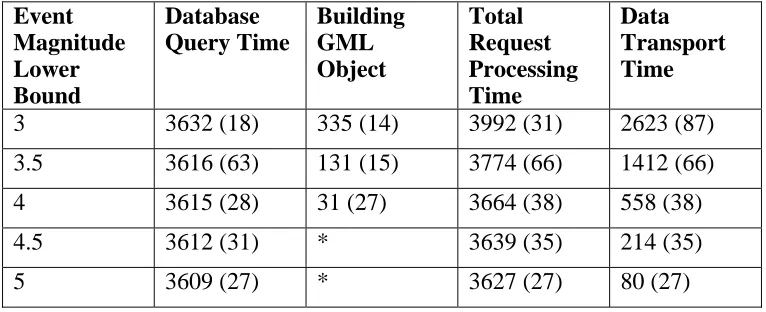
the request (encoded as a GML Filter) and uses this to construct a corresponding MySQL query. The results of the database querying process are used to create a GML FeatureCollection which usually contains multiple features (1790 features for magnitude 3 and larger). We measure WFS performance by timing the steps required to process GetFeature requests. The tests are made over 15 runs. Data from 1/1/1992 to 12/31/1992 were requested and latitude/longitude bounding box (-117.0, 32.0)-(-114.0-37.0) was used. Table 2 shows the results of the performance tests. Measurements are in milliseconds, standard deviations are given in parentheses. Timings less than 10ms are marked with (*).
Table 2 Web Feature Service performance is reported in milliseconds. Standard deviations are given in parenthesis.
Event Magnitude Lower Bound
Database Query Time
Building GML Object
Total Request Processing Time
Data Transport Time
3 3632 (18) 335 (14) 3992 (31) 2623 (87)
3.5 3616 (63) 131 (15) 3774 (66) 1412 (66)
4 3615 (28) 31 (27) 3664 (38) 558 (38)
4.5 3612 (31) * 3639 (35) 214 (35)
5 3609 (27) * 3627 (27) 80 (27)
For each event magnitude we make four different measurements. Although there are few other steps involved in the process such as initialization of the Java objects and extraction of the database query from the user request, they do not take significant amount of time and are not determinative in the total response time. Database query time displayed in column 2 is the major contributor to the total response time and demonstrates a similar value for all the data sizes. Building GML objects from database query results was another major time consuming process in our previous tests [17] especially for larger GML payloads however with the new improvements this process only takes about 10% at most and can be ignored for the larger event magnitudes. “Total Request Processing Time” column shows the total amount of time spent on the server side for processing a user request. From the client’s point of view the performance of the WFS is simply the amount of time between submission of the request and the retrieval of the result. For this reason we also measure the data transport time. However the actual transport time will greatly depend on the quality of the network connection between the client and the WFS server, and the transport timings we give her are only sample results for our test set up.
These results demonstrate significant improvement from our earlier results discussed in [17]. Although the previous results did not include the data transport time since it was computed by another system component, we can say that the internal optimizations made in WFS to better handle GML creation gave significant results.
Performance tests teach us valuable lessons in terms of the capabilities and limits of our implementation. From the above result we draw following conclusions. First, for small data payloads the response time is acceptable. However for larger data sets the performance decreases sharply and the response time is relatively long. Second, there exists a maximum threshold for the amount of data to be transported.
results and throws an out of memory exception due to the fact that it is not possible to create an in memory string representation of the resulting GML document
2.2. Streaming Web Feature Services
Scientific applications such as Pattern Informatics [32] and RDAHMM [32] require large amounts of data to be transferred between servers and clients. Our Web Services-based WFS implementation proved to be appropriate for transporting smaller data payloads; however for large data sets either the performance is low or the system does not work. For these reasons we have investigated alternative ways for data transport and researched use of topic based publish-subscribe messaging systems for streaming the data. Our research on NaradaBrokering shows that it can be used to stream large amount of data between nodes without significant overhead. Additional capabilities such as reliable messaging and support for different transport protocols already inherent in NaradaBrokering show that it is a powerful yet easy to integrate messaging infrastructure. For these reasons we have developed a novel Web Feature Service that integrates Open Geospatial Consortium specifications with Web Service-SOAP calls and NaradaBrokering messaging system.
Our streaming Web Feature Service works similarly with the non-streaming version, however instead of using HTTP as the transfer medium we publish the results to a NaradaBrokering topic. The clients make the requests with standard SOAP messages but for retrieving the results a NaradaBrokering subscriber class is used. The ability to stream the results over NaradaBrokering topics also gives us another opportunity for improving the performance: we utilize MySQL’s ability to stream results from database row by row thus create and publish the GML feature members as they become available. This allows us to start publishing the results after a short query processing time without waiting for the whole result set to be returned from the database as in the conventional implementation.
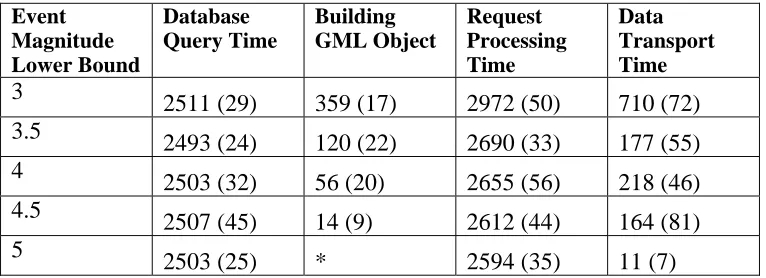
[image:9.612.116.499.538.677.2]Initial performance test results for out streaming-WFS implementation is discussed in brief in [32]. Here we give a detailed description of the test scenario and compare both WFS versions. The performance tests are made with the same parameters used for testing the non-streaming version; we used SCEDC seismic catalog for year 1992 and queried data for seismic event magnitudes M>5.0, 4.5, 4.0, 3.5, and 3.0. Table 3 shows the timings taken for various steps. All measurements are in milliseconds and standard deviations are given in parentheses. Timings less than 10ms are marked with (*).
Table 3 Streaming Web Feature Service performance for seismic records (in millisecond) is reported.
Event Magnitude Lower Bound Database Query Time Building GML Object Request Processing Time Data Transport Time 3
2511 (29) 359 (17) 2972 (50) 710 (72) 3.5
2493 (24) 120 (22) 2690 (33) 177 (55) 4
2503 (32) 56 (20) 2655 (56) 218 (46) 4.5
2507 (45) 14 (9) 2612 (44) 164 (81) 5
2503 (25) * 2594 (35) 11 (7)
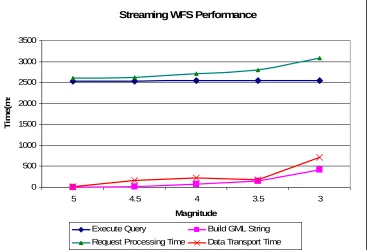
payload the transport time is only 17% of database query time. Overall the streaming-WFS outperforms non-streaming version by a significant margin for large data payloads and demonstrate an equal or better performance for smaller data sizes. Another important point is that there is no size limit for the data to be transported between WFS server and the client in streaming version which is a major advantage. Figure 5 and Figure 6 plot these results.
Streaming WFS Performance
0 500 1000 1500 2000 2500 3000 3500
5 4.5 4 3.5 3
Magnitude
Ti
m
e
(m
s
[image:10.612.123.491.148.398.2]Execute Query Build GML String Request Processing Time Data Transport Time
Figure 5 Performance of streaming Web Feature Service
Non-Streaming WFS Performance
0 500 1000 1500 2000 2500 3000 3500 4000 4500
5 4.5 4 3.5 3
Magnitude
Ti
m
e
(
m
s
Figure 6 Performance of non-streaming Web Feature Service
2.3. Web Feature Service Future Work
Although we have improved the performance of our initial WFS implementation and solved the data payload size limit by developing a streaming version, we still have to investigate further improvements, as the transport time will eventually dominate the relatively flat database query time. One interesting field to explore is binary XML representation schemes [21][22] [23]. We are currently developing a framework for Web Services to negotiate various characteristics of their communication for better performances. We will apply our research in this area to negotiate transport protocol and binary XML format for encoding GML feature collections. We think that by encoding XML in a binary format we will be able to reduce the size of the data significantly and by using alternative transport protocols such as UDP we will be able to transfer data faster.
3. Visualization Web Services for Geographical Information Systems
In the previous section we addressed the problems of accessing data sources using Geographical Information Service data models and services. GIS standards such as the Open Geospatial Consortium’s Web Map Services (WMS) [25] introduce methods and environments to visualize, manipulate, and analyze geospatial data using maps. These map servers typically compose maps as layers. These layers in turn may come from distributed sources: Web Feature Services provide abstract feature representations that can be converted to images, and other map servers may contribute map images. These supporting services must be found using information services and metadata descriptions. Thus, map generation services provide interesting problems in distributed service coordination.
Map generation is also obviously where GIS services meet user interfaces. In this section we examine several issues: how do we implement a Web Map Server to support Web Service standards, how do we integrate this server with other (data and information) services, and what approaches should we use to create client interfaces and manage the client-service interactions.
3.1. Challenges in GIS Visualization Systems
To provide context for our distributed map service research and development work, we begin with a discussion of general challenges in building these systems
Interoperable and easy to integrate services: As we will discuss in more detail below, Web Map Services depend on other services to do their work: distributed map servers can aggregate both abstract plotting instructions and images from several sources. By building Web Map Services that use Web Service standards and generally follow Web Services Architecture [31] principles, we can make use of general purpose information services and workflow standards that can be used to create composite maps using distributed computing techniques [38].
Supporting legacy and Web Service messaging and transport: Open Geospatial Consortium specifications for the Web Map Services must support both HTML Get/Post and SOAP over HTTP protocols. Each of these access methods uses HTTP as its underlying transport protocol. Although Web Services can operate over almost any internet protocol, HTTP is the preferred protocol for legacy GIS applications. The most well-known drawback of the HTTP protocol is the lack of support for asynchronous messaging. On the other hand, Web Services provide valuable capabilities such as providing standard interfaces to access various remote resources, ability to launch and manage applications remotely, or control collaborative sessions etc.
Bridging between multiple map servers: We must be able to aggregate capabilities from different mapping services running on different hosts. These are referred to as Cascading Web Map Services. In that context, a map server acts like a client to another Web Map Service and as a server to the clients. The client does not need to keep track of several Web Map Service servers; it only has to be aware of one. The cascading Web Map Service reports the capabilities of the other Web Map Service as its own and aggregates the contents and capabilities of several distinct Web Map Service servers into one service. In our project [17], we have been using Landsat 7 satellite imagery map from Web Map Service at NASA OnEarth [37][38].
3.2. Creating Maps from Geographic Data
Web Map and Feature Services cooperate to create map images. XML-represented geographical features obtained from Web Feature Services are converted by Web Map servers into images using matrix-pixel (raster data), or points, lines and polygons (vector data). The basic operations related to mappings include discovering the physical address of the data providers, transferring the data from data servers and rendering it to create a map. A map is not the data itself. Maps create information from raw geographic data, vector or coverage data. Maps are generally rendered in pictorial formats such as JPEG (Joint Photographic Expert Group), GIF (Graphics Interchange Format), and PNG (Potable Network Graphics). Web Map Service also produces maps from vector-based graphical elements using Scalable Vector Graphics (SVG).
A Web Map Service provides three main services: getCapabilities, getMap and GetFeatureInfo. GetCapabilities and getMap are required to produce a map, and GetFeatureInfo is an optional metadata service. In this section, we only give information about the workflow of producing maps. For more details about our Web Map Service implementation, please see [39].
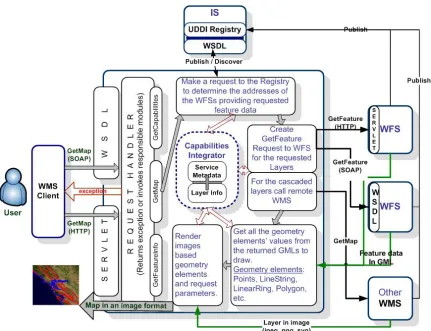
Maps are created upon a specific request (getMap) from the clients. Chained processes to produce maps are illustrated in Figure 7. After getting the getMap request, the Web Map Service goes over the flow depicted in Figure 7 and if everything succeeds, then returns the result as an image in a format defined in the getMap request. All the supported image formats are defined in Web Map Service capability document. Requests for the image formats should be made in accordance with the Web Map Service’s capability file. Clients should make first getCapabilities
request to be able to set appropriate parameters for their getMap requests.
Web Mapping Services are provided over the HTTP Get/Post and SOAP/HTTP protocol. Each of these access methods uses HTTP as its underlying protocol. The image is returned back to the Web Map Service Client as a SOAP attachment; the client invokes getMap through the Web Service interface. If the Web Map Service encounters any problem during handling of the request, it sends an exception message back to the Web Map Service Client. If the request is well formed, then the Web Map Service first parses the parameters and gets their values from the
some other Web Map Service services.
Figure 7 Web Map Server architecture showing basic servers and interactions to create maps
The Web Map Service first determines what layers are requested, in which bounding box, in which form, and so forth. After determining all the request parameters, it makes find_service and
getAccess_point requests to information service providers (Section 6) to determine the WFS providing requested feature data. These requests are done as SOAP messages to the information service interfaces which are implemented as Web Services. GetAccess_point returns the Web Service access point address of the Web Feature Service that provides the requested feature. Web Map Service makes getFeature request to the returned Web Feature Service and gets the requested feature data in GML format. The Web Map Service derives geometry elements from the GML file to visualize the feature data. These geometry elements in GML are Point, Polygon, LineString, LinearRing, MultiPoint, MultiPolygon, MultiGeometry, etc. At each step of the process displayed in the figure, Web Map Service modules are checked against the Web Map Service’s capabilities file. The capabilities file keeps information about the service metadata and provided layers.
3.3. Different Approaches to Web-Based Client Architectures
“thick client” implementations that combine broad levels of data collection, manipulation, and presentation. In the thin client model, most of the processing is done on the server side. The client is responsible only for rendering the display. All computations are performed on the server (typically developed with Java Servlets, PHP, or similar technologies). Thin clients must go back to the server to process any user interface events (like button clicks and form submissions). In contrast, a thick client model assumes some non-trivial data processing on the client side. These clients can validate forms and handle events without making a request back to the server. Thick client examples include Java applets and Java Web Start applications as well as JavaScript.
We have examined map clients using both of these approaches and are currently examining a hybrid approach. In this way we hope to take advantage of both approaches’ advantages. In order to achieve this, we create a middle proxy server for the real map server. Each client makes its request to this middle server. The middle server must implement caching and session information for each connected clients. This prevents unnecessary, repeated data transfers and increases transaction performance. In this scenario, the workload comes from integration of images produced from caches and newly coming data. A drawback is the storage limit in the middle server keeping cached image data.
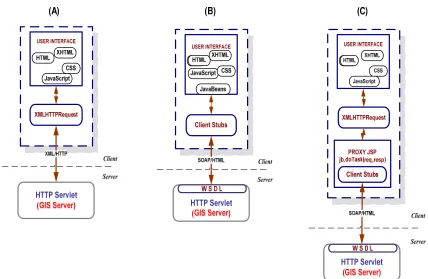
Figure 8: (A) Pure AJAX Approach, (B) Web Services Approach, and (C) Hybrid (AJAX + Web Services) Approach
[image:14.612.89.517.333.612.2]format from one protocol to another. Since there is no ready to use common protocol to handle messages communications between AJAX and Web Services, we implemented a simple message conversion technique (see (C) in Figure 8). This essentially works by having the XMLHttpRequest communicate with a servlet, which in turn acts as a client to a remote Web service. This allows us to easily convert between SOAP invocations and HTTP POSTS. It also has the benefit of avoiding JavaScript sandbox limitations: normally the XmlHttpRequest object in the browser can only interact with its originating Web server. An example result is show in Figure 9.
Figure 9: Google Map is overlaid California Earthquake seismic data and state boundary layers from the Web Feature Service. Seismic events locations (in response to calls to a Web Feature Service) are represented with points.
4. Integrating Web Map Servers and Google Maps
In the previous section, we discussed our efforts to build an Open Geospatial Consortium (OGC) compatible Web Map Server, as well as methods for building clients to this service. The key division is between the thin client model (which requires requests for each user interaction) and the thick client model (which allows some processing and event handling on the client side). The former approach is more commonly seen with standard clients to Web Map Service systems, while Google Maps exemplifies the latter approach. We discussed how we can integrate both techniques.
has the advantage that it allows us to treat Google Maps as just another map server in a larger, integrated Geographical Information System deployment: the Google Maps themselves are wrapped and accessed through services rather than clients. This is useful for non-interactive processing that does not involve Web Browser clients.
Google Maps is a free web map server application and technology provided by Google at http://maps.google.com. It was first introduced in early 2005 and provides high resolution satellite images along with hybrid views that combine the illustrated map and satellite view. The Google Maps client has a simple interface and creates map images using a large amount of JavaScript. As the user drags the map, the grid squares are downloaded from the server performing asynchronous network requests with JavaScript and XML (i.e. AJAX). The Google Maps features of providing user-interactive interfaces, a map API [41] and rich map images have been attractive to many third party areas [42] including scientific applications. However, Google Maps is not Open Geospatial Consortium compliant and, to our knowledge, there are no current Open Geospatial Consortium standard interfaces for layering, combining, or importing and exporting data between Google Maps and open mapping environments. Besides publishing Google Maps images through Web Map Service, others have introduced adding Open Geospatial Consortium based Web Map Server layers to Google Map client [43].
In this section, we introduce a Google Maps connector which provides Open Geospatial Consortium standard interfaces for higher interoperability in Grid computing environment. To accomplish this, we first investigate Google Maps mapping procedure. This information is meant for the proof of concept. Some use cases that involve scraping the map images from Google’s servers may be against the terms of service, so it is advised that these be reviewed. For more information on the inner workings of Google Maps, see [44][45].
4.1. Map Tiles
Google Maps are made of dozens to thousands of tile images, depending on the zoom level. Google Maps uses 256x256 pixel tiles for their map images. Each Google tile has corresponding latitude, longitude and zoom Value. These are represented by x, y, and zoom. Here is what a tile path from Google showing San Francisco looks like:
http://mt.google.com/mt?v=w2.6&x=20&y=49&zoom=10 (A)
The x and y coordinates specify the location at the given zoom level; zoom = 0 is the highest possible, and zoom is a logarithmic scale. The value ‘v=’ is version number and as of the date of this paper, it is w2.6. To get the x, y tile number, we compute the address of the tile which contains the given coordinates and zoom level, as well as their pixel address on the entire map. Next, based on the tile number and zoom level, find the minimum and maximum x, y pixel on the entire map. The later is used to crop part of a map image before outputting to the requestor. Computing zoom level will discuss later in this section.
Processing satellite maps is totally different than Google illustrated map. The satellite map tiles are also encoded as 256x256 jpegs and its URL showing San Francisco is look likes:
http://kh.google.com/kh?v=3&t=tqtsqrqt (B)
A satellite URL ‘v=’ parameter value is v=3 as of the date of this paper. The last parameters of the satellite URL is a string of letters encoding the location of a particular map square. This simple hierarchical structure is known as quad tree. Google labels the four quadrants q, r, s & t.
The topmost tile contains the entire world map, and is referenced with an address of t, adding an
adding q to the top-left. This continues inside each quadrant until the maximum detail is reached. Since we know the x, y, zoom values of the Google Map tile, it is easy to find corresponding q, r, s, t based on their quad tree characteristic. The detailed conversion information between these is available at [46].
A Google Map connector provides a parameter layers to distinguish illustrated and satellite map. The form of the URL-encoded request showing satellite map of California with bbox values is as follows.
http://GoogleMapsConnectorServer/cgi-bin/wms.cgi?layers=satellite& height=500&width=400&bbox=-124.85,32.26,-113.56,42.74 (C)
The width and height values are optional. If these are omitted, a returned map image is not cropped or resized.
4.2. Bounding box and zoom level
We need at least bbox, width and height interfaces to comply with Web Map Server specifications. The bounding box (bbox) is a set of four comma-separated decimal, or integer values. When the map projection is a Platte Carre of longitude and latitude coordinates, X refers to the longitudinal axis and Y to the latitudinal axis.
Based on the given bounding box value, finding the matching zoom level of the Google Map is necessary to compute tile coordinates. Information explaining a selection box for Google Maps is available at [47]. Based on this script file, an array of 18 zoom-level-area data is used to determine the correct zoom level of the Google Map. With given bbox values, the size of the (pixel) area is
areaSize = | (maxX - minX) * (maxY - minY) |.
When
zoomLevelAreaData[i] < areaSize < zoomLevelAreaData[i+1],
the corresponding index i is the zoom level. For instance, the size of the bbox of above URL-encoded request (C) is 118.3192 and its zoom level is 11. Here is a sample of area data;
zoomLevelAreaData = (0.000044782205316291115, 0.00017912880077214252, 0.0007165152014842625, 0.0028660594751396392, 0.01146422704873143, 0.04585681809304249, 0.18342716717851734, 0.7337069855714002, 2.9348010091822907, 11.738430973389503, 46.94408531995497, 187.64344725577126, 748.5823131256056, 2961.473356669126, 11242.849261491675,
36095.54334444813, 86649.85238489839, 177134.48041308092)
4.3. Implementation Details
We have implemented Open Geospatial Consortium compliant Google Maps connector using
XAMPP [48] to facilitate the installation of a free cross platform Web server able to serve dynamic pages. This software package contains Apache, MySql, PHP and Perl. To crop, resize and convert map images, PerlMagick is adopted. PerlMagick is a free graphics module designed to be used online. It is based upon the ImageMagick library and uses the module to read, manipulate, or write an image or image sequence from within a Perl script. This makes it very suitable for Web CGI scripts and can be used for the automated and interactive manipulation of images.
including satellite are cached each time on the Google connector server to run to save time on future runs. After grabbing all corresponding tiles, combining these together is needed. There are script files available providing this feature on the Web [49]. Based on this, a Perl script using ImageMagick command has been used to gather and stitch image together. However, this script needs additional functions to crop and resize the map images based on the tile pixel and given width and height values.
To return a map image to the requestor, it must be treated as binary mode otherwise some part of image is garbled. We use Perl's built-in function binmode to indicate that we are outputting binary data. System command call inside Perl script is not working on Windows when it is used as CGI in Tomcat. Therefore Fedora 4 has been used for the web server and CGI scripts.
One must be careful when integrating maps with different projection conventions. As discussed at the end of previous section, NASA’s OnEarth map service is based on Plate-Carree projection and Google Maps are based on Mercator map projection. For relatively small areas (a bounding box with sides of few hundred kilometers, such as is required to show the western coast of the United States, Figure 9), the difference is relatively small area
comparing a whole earth, and the gap of the map layers between these two projections is negligible. However, transforming between those two to support general GIS application should be provided for the large area maps or more precise multilayer display in the future.
5. Streaming Services for GPS and Other Data
Recent technological developments have allowed Web-accessible sensors to be deployed in a large variety of environments. Environmental monitoring, air pollution and water quality measurements, detection of the seismic events and understanding the long-term motions of the Earth crust are only a few areas where the extent of the deployment of sensor networks can easily be seen. Extensive use of sensing devices and deployment of the networks of sensors that can communicate with each other to achieve a larger sensing task will fundamentally change information gathering and processing [50]. However, the rapid proliferation of sensors presents unique challenges different than the traditional computer network problems.
Several studies have discussed the technological aspects of the challenges with the sensor devices, such as power consumption, wireless communication problems, autonomous operation, and adaptability to the environmental conditions [51][52]. Here we describe service architecture to support real-time information gathering and processing from GPS sensors by leveraging SOA principles and open GIS standards.
Most scientific applications that couple high performance computing, simulation or visualization codes with databases or real-time data sources require more than remote procedure calls that typical Web Services rely upon. These applications are sometimes composite systems where some of the components require output from others and they are asynchronous: it may take hours or days to complete. Such properties require additional layers of control and capabilities from Web Services which introduces the necessity for a messaging substrate that can provide these extra features. In the next section we discuss the application of NaradaBrokering (a topic based publish-subscribe messaging system that can provide us several useful capabilities) for managing and serving real-time streaming data.
5.1. Streaming Data with NaradaBrokering
middleware which facilitates communications between entities (which includes clients, resources, services and proxies) through the exchange of messages. Second, it provides a notification framework by efficiently routing messages from the originators to only the registered consumers of the message in question.
NaradaBrokering facilitates the idea of loosely coupled systems by supporting asynchronous communication, and it can be used to support different interactions by encapsulating them in specialized messages called events. Events can encapsulate information pertaining to transactions, data interchange, method invocations, system conditions and finally the search, discovery and subsequent sharing of resources.
Some of the important features of NaradaBrokering can be summarized as follows:
• Ensures reliable delivery of events in the case of broker or client failures and prolonged entity disconnects.
• Provides compressing and decompressing services to deal with events with large payloads. Additionally there is also a fragmentation service which fragments large file-based payloads into smaller ones. A coalescing service then merges these fragments into the large file at the receiver side.
• Provides support for multiple transport protocols such as TCP (blocking and non-blocking), UDP, SSL, HTTP, RTP, HHMS (optimized for PDA and cell-phone access) and GridFTP with protocol chosen independently at each link
• Implements high-performance protocols (message transit time of 1 to 2 ms per hop)
• Order-preserving optimized message delivery
• Quality of Service (QoS) and security profiles for sent and received messages
• Interface with reliable storage for persistent events, reliable delivery via WS-Reliable Messaging.
• Discovery Service to find nearest brokers /resources
In summary, NaradaBrokering supports many-to-many messaging for distributed systems, where messages may range from SOAP envelopes to binary packets. The connections between publishers, brokers, and subscribers are “virtualized” in that we can choose between different protocols for delivery and between different qualities of service (guaranteed delivery, once-only delivery, replayed delivery, secure delivery, and so forth). For a general discussion of messaging substrates for Grids and Web Services, see [9][12].
In the following sections, we describe how NaradaBrokering stream management software may be used to deliver real-time data through successive filters to consuming applications. We are developing this particularly with the goal to support on-line versions of the RDAHMM application [32], which may potentially be used to detect aseismic events in GPS data streams.
5.2. Sensor Grid Components
Sensor Grid Agent: This service provides interfaces for clients to access/query available data products. It may have both visual (maps) and textual (HTML forms) elements to help users construct queries. The basic idea behind this service is to simplify clients’ communication with the SensorGrid. A scientist may use this agent to request sensor observations for a particular geographical region and time. For instance by selecting a rectangular region on an interactive map and entering time boundaries we can construct queries such as “Get GPS measurements for San Diego County for September 2005”. In addition to helping users construct queries for archived geospatial data Sensor Grid Agent displays available real-time sensors as well.
Information Service: Web Services are stateless; they do not keep session related information. We need to use additional services to provide session support. Sensor Grid architecture consists of multiple independent Web Services which do not keep any information about each other. The Information Service is used to keep several futures of the services in the system to make easy access to these services possible. For instance all Open Geospatial Consortium conformant data services provide a capabilities document (in XML) that describes the types and constraints of the data they can serve. Information services provide a registry through which the users can locate available services in the system and discover their futures. For more on our information services work, see Section 6. This has GIS specific extensions appropriate for our architecture.
Web Feature Service: WFS provides a repository for GIS archival data and is described in Section 2. In addition to the streaming support described there, we are investigating using binary XML to provide highly efficient XML representations that should provide significant performance enhancements in current services.
Sensor Collection Service: Open Geospatial Consortium Sensor Web Enablement is intended to be a revolutionary approach for exploiting Web-connected sensors such as flood gauges, air pollution monitors, satellite-borne earth imaging devices etc. The goal of SWE is to creation of Web-based sensor networks. That is to make all sensors and repositories of sensor data discoverable, accessible and where applicable controllable via the Web [54][54].
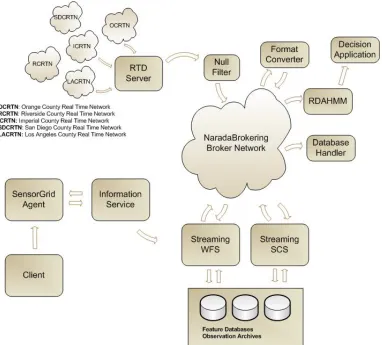
Figure 10 Major Components of the Sensor Grid architecture are shown: filters are used to convert data formats obtained from the data source (such as the Global Positioning System RTD server) and can be delivered to numerous clients, including data analysis applications (RDAHMM), streaming feature servers, and user interfaces. Clients control subscriptions through information services.
5.2.1. Filter Chains
To process sensor streams in real-time we are researching use of publish/subscribe based messaging system. We will test deploying geo-processing applications and format converters as successive filters. We can leverage NaradaBrokering topics for publishing for this purpose.
GIS applications consume data in different formats. To support various types of geo-processing tools we need to provide data in different formats, for this reason we can deploy format converters successively on the NaradaBrokering topics.
5.2.2. Typical Query Scenario
Sensor Collection Service also keeps information about the sensors themselves. This information is encoded in SensorML [55]. After receiving the broker address and the topic name, client may subscribe to the NaradaBrokering server to receive real-time data.
5.3. Real time streaming support for GPS Networks
The Global Positioning System has been used in geodesy to identify long-term tectonic deformation and static displacements while Continuous GPS has proven very effective for measurement of the interseismic, coseismic and postseismic deformation [57]. Today networks of individual GPS Stations (monuments) are deployed along the active fault lines, and data from these are continuously being collected by several organizations. One of the first organizations to use GPS in detection of the seismic events and for scientific simulations is Southern California Integrated GPS Network (SCIGN) [58]. One of the collaborators in SCIGN is Scripps Orbit and Permanent Array Center (SOPAC) [59] which maintains several GPS networks and archives high-precision GPS data, particularly for the study of earthquake hazards, tectonic plate motion, crustal deformation, and meteorology. Real time sub-networks maintained by SOPAC include Orange County, Riverside County (Metropolitan Water District), San Diego County, and Parkfield. These networks provide real-time position data (less than 1 sec latency) and operate at high rate (1 – 2 Hz). Raw data from the GPS stations are continuously collected by a Common Link proxy (RTD server) and archived in RINEX files.
The data collected from the GPS stations are served in 3 formats:
• RAW: For archiving and record purposes, not interesting for scientific applications, not available in real-time.
• RTCM: Published real-time and no records are kept. This is useful for RTCM capable GPS receivers as reference.
• Positions: Positions of the stations. Updated and presented every second. GPS Time Series can be produced using these positions and they can be in different epochs such as hourly, daily etc.
The most interesting of these formats to our application scientist collaborators is the position information, which can be used in scientific calculations, simulation or visualization applications. The RTD server however outputs the position messages in a binary format called RYO. More importantly, RTD signals include all GPS stations (typically 5-15) in a particular network.
To receive station positions, clients open a socket connection to the RTD server. An obvious downside of this approach is the extensive load this might introduce to the server when multiple clients are connected, so the many-to-many publishing style discussed above also address this problem.
After the RTD server receives raw data from the stations it applies some filters and for each network generates a message. This message contains a collection of position information for every individual station from which the position data has been collected in that particular instant. In addition to the position information there are other measurements in a message such as quality of the measurement, variances, etc.
5.3.1. Chain of Filters
formats. Once we receive the original binary data we immediately publish this to a NaradaBrokering topic (null filter), another filter that converts the binary message to ASCII subscribes to this topic and publishes the output message to another topic. We have developed a GML schema to describe the GPS position messages. Another filter application subscribes to ASCII message topic and publishes GML representation of the position messages to a different topic. This approach allows us to keep the original data intact and different formats of the messages accessible by multiple clients in a streaming fashion.
Decoding RYO Messages
[image:23.612.180.432.231.393.2]RYO Message Type 1 (Figure 11) starts with a 5-byte Header which is followed by a 47-byte GPS Position message. Three types of optional blocks may follow the Position Message and a 2-byte checksum is located at the end of the message.
Figure 11 RYO Type 1 Message Parts
A non-blocking Java Socket connection is opened to RTP server to collect RYO messages. We use thread programming techniques for this purpose. We have developed an RYO Decoder application which uses binary conversion tools to convert RYO messages into text messages. Furthermore, since we do not expect clients to know about the GPS time format we convert GPSWeek and GPSmsOfWeek values to Gregorian calendar format (i.e. 2005-19-07/04:19:44PM-EST). Additionally since we anticipate some clients to expect position information in terms of Latitude and Longitude, we calculate Latitude, Longitude and Height values from XYZT Position.
5.3.2. GML Schema for Position Messages and Data Binding
We developed a GML conformant Schema to describe Position Messages. The Schema is based on RichObservation type which is an extended version of GML3 Observation model [60]. This model supports Observation Array and Observation Collection types useful in describing SOPAC Position messages since they are collections of multiple individual station positions. We follow strong naming conventions for naming the elements to make the Schema more understandable to the clients.
We used Apache XML Beans for data binding purposes and created an application that reads ASCII position messages and generate GML instances using the code generated by XML Beans. SOPAC GML Schema and sample instances are available here:
5.3.3. Integrating NaradaBrokering
[image:24.612.93.526.186.386.2]We use NaradaBrokering to provide real-time access to data in various formats, as described above. We have developed filters to publish RYO, ASCII and GML formatted position messages to different NaradaBrokering topics. Clients can subscribe to any of these topics to receive position messages in that particular format. Figure 12 depicts use of NaradaBrokering Topics in the system and provides a zoomed-in view of Figure 10.
Figure 12 SOPAC GPS Services
5.3.4. GPS Station Messages and Filters
As discussed above, station messages collected from GPS stations have several sub-sections. We have developed several filters that simplify or convert the messages since not all the parts of a position message are needed by most clients. We describe such a client that displays real-time station positions on Google Maps in the next section. Here we give sample output messages from different filters:
The first filter in our architecture is a null filter which forwards original RYO binary messages from RTD server to a NaradaBrokering topic. The output of this filter is a binary message.
The second filter is called ryo2ascii which converts RYO messages to ASCII and publishes to a NB topic. An example of the decoded RYO message is shown in Appendix 10.2. The ryo2ascii filter converts the whole RYO message and does not filter out anything.
Most of the information included in a position message is unnecessary for many clients, so we can apply further filtering. For instance we have developed a user interface to display the current positions of the stations on a map. For this particular application we only need station names and their positions in terms of latitude and longitude. For this client interface we have developed ryo2pos filter which converts RYO messages to simple position messages. Following is a sample output message from ryo2pos filter:
LEMA 2005-12-12 03:58:37PM-EST 36.29202028791537 -119.78237425030088 35.90217063464758
message. This small application is an example of how individual filters can be chained using NaradaBrokering to achieve specific tasks. Another example application integrated using this approach is RDAHMM which only requires X, Y, Z or Lat, Lon Height values for a given station. We can easily write a filter to strip unwanted parts from the message and output only the position information.
5.3.5. Current System Configuration
[image:25.612.73.545.251.547.2]Currently the system is being tested for eight GPS networks with only one NaradaBrokering server installed on xsopac.ucsd.edu:3045. However we are planning to deploy multiple, distributed brokers for further performance tests. Table 4 shows the latest information about these networks. PARKFIELD is an archived network’s data stream that includes a recent earthquake event on the Parkfield fault.
Table 4 Sensor Grid’s supported GPS networks.
Network Name
RTD Server Address
Stations
LACRTN 132.239.154.69:5014 VTIS, HBCO, CVHS, LORS, TABL, UCSB, AZU1, CSDH, DYHS, VDCY, UCLP, CIT1, LAPC
PARKFIELD n/a HOGS, POMM, MIDA, CRBT, CARH, LAND, MNMC, LOWS, RNCH, CAND, MASW, TBLP, HUNT
OCRTN 132.239.154.69:5010 OEOC, CAT2, WHYT, TRAK, SACY, MJPK, SCMS, SBCC, FVPK, BLSA
SDCRTN 132.239.154.69:5013 P486, MONP, RAAP, MVFD, P472, SIO5, DVLW, PMOB, P480, DSME, OGHS
IMPERIAL 132.239.154.69:5012 SLMS, CRRS, USGC, DHLG, GLRS
DVLRTN 132.239.152.72:8001 DVLE, DVNE, DVSW, DVSE, ESRW, DVLS, DVNW, ESE2
CVSRN 132.239.154.69:5015 COMA, RBRU, LEMA
RCRTN 132.239.154.69:5011 PIN2, WIDC, KYVW, PSAP, COTD, PIN1, MLFP, CNPP, BILL, EWPP, AZRY
Table 5 shows the NaradaBrokering topic names for several filters.
Table 5 GPS station topics for RYO and ASCII formats.
Network Name RYO Topic
(null filter Publishes to)
ASCII topic
(ryo2ascii filter Publishes to)
[image:25.612.70.562.254.548.2]CVSRN /SOPAC/GPS/CVSRN/RYO /SOPAC/GPS/CVSRN/ASCII RCRTN /SOPAC/GPS/RCRTN/RYO /SOPAC/GPS/RCRTN/ASCII
Similarly the ryo2pos filter subscribes to the appropriate RYO topic and publishes to for instance /SOPAC/GPS/LACRTN/POS topic.
5.4. Displaying GPS Station Positions Using AJAX Methods
To demonstrate the technologies discussed earlier we have developed several JSP based client interfaces leveraging AJAX techniques. The user interfaces we discuss here demonstrate use of a topic based publish-subscribe messaging for managing and serving real-time data coupled with several real-time data filters.
AJAX or Asynchronous JavaScript and XML is a relatively new web development technique for creating highly interactive web interfaces. AJAX is not a technology by itself rather a name for using a collection of several well-known technologies together. It employs XHTML or HTML, JavaScript, DOM and XMLHttpRequest. XMLHttpRequest is originally developed by Microsoft and available since Internet Explorer 5.0. It is supported today by most major browsers. This object is used to exchange data with the server asynchronously.
For this architecture we use an online XML document (an RSS-like feed) provided by SOPAC to retrieve up-to-date list of available GPS stations [61]. This data is obtained from other filter we developed in collaboration with Scripps. This document contains several properties of each GPS station:
<station>
<network>
<name>LACRTN</name> <ip>132.239.154.69</ip> <port>5014</port>
</network> <id>vtis</id>
<longitude>-118.294</longitude> <latitude>33.713</latitude> <status>up</status>
</station>
This format is much more simplistic than the GML encoding discussed earlier, but it may be easily integrated with the JavaScript DOM parser used in AJAX. Figure 13 shows all of the GPS stations managed by SOPAC. The GPS networks are color-coded.
Figure 13 SOPAC GPS networks in Southern California
[image:27.612.152.463.185.666.2]5.5. Conclusion and Future Work
The work described in this section will form the foundation of many future applications. The simplest of these (shown in Figure 14) is useful as a heartbeat monitor for GPS networks. However, this is primarily a proof of concept and verification that the fundamental system described above is operational. We are currently integrating individual GPS network station feeds with the aforementioned RDAHMM event-detection code (itself wrapped as another filter). Our hope is to be able to use RDAHMM for the near real-time detection of GPS signal changes near earthquake faults.
6. Information Services to Support Geographical Information System
Grids
Geographical Information System-based Grid applications introduce a large amount of services managed by different organizations or individuals to let users acquire, process and share geospatial-data, resources and geo-processing applications.
As Web Service Architecture principles [31] have gained importance, an emerging need has appeared for methodologies to locate desired services that provide access and data mining capabilities to geospatial data. Also, as these services interact with each other within a workflow session to produce a common functionality such as earthquake forecasting [32], another emerging need has also appeared for storing/querying transitory metadata needed to describe session state information.
In service-oriented Grids, Information Services support the discovery and handling of both static and session-related, transitory metadata associated to services. Here, we discuss the limitations in existing Information Services and introduce a novel system as a solution. We design a hybrid Information Service supporting both large amounts of relatively slowly varying data and rapidly updated, dynamically generated information. To do this we use and extend the following two Web Service standards: Universal Description, Discovery, and Integration (UDDI) and Web Services Context (WS-Context) in our design.
We utilize existing UDDI Specifications [62] and design an extension to UDDI Data Structure and UDDI XML API to be able to associate both prescriptive and descriptive metadata with service entries. There have been some solutions introduced to provide better retrieval mechanism by extending existing UDDI Specifications. UDDIe [63] project introduces the idea of associating metadata and lifetime with UDDI Registry service descriptions where retrieval relies on the matches of attribute name-value pairs between service description and service requests. UDDI-MT [64] improves the metadata representation from attribute name-value pairs into RDF triples. A similar approach to leverage UDDI Specifications was introduced by METEOR-S [65] project which identifies different semantics when describing a service, such as data, functional, quality of service and executions. In our design, we also extend the UDDI Information Model, by providing an extension where we associate metadata with service descriptions similar to existing solutions where we use name-value pairs to describe characteristics of services. Apart from the existing methodologies, we provide both general and domain-specific query capabilities. An example for domain-specific query capability could be XPATH queries on the auxiliary and domain-specific metadata files stored in the UDDI Registry.
solve a particular problem. Our particular approach to service orchestration is described in Section 7. There are varying specifications, such as WSRF, Context, Transfer, and WS-Metadata Exchange, introduced to define stateful interactions among services. Among them, we choose WS-Context Specifications [66] to create a metadata catalog system for storing transitory metadata needed to describe distributed session state information. Unlike the other specifications defining service communications, WS-Context models session metadata repository as an external entity where more than two services can easily access/store highly dynamic metadata.
We highlight the following problems in Information Services supporting Grid Applications. First, classic Grid Information Services are not built along a model that can support dynamically assembled services. Second, existing solutions to Information Services, i.e., data-hosting systems, focus on storing information on pre-defined locations and ignore changing user demands when making decisions on metadata access and storage. Third, classic Grid Information Services do not provide a uniform programming interface for publishing and discovery of both dynamically generated and static information.
We therefore see this as an important area of investigation. Here, we research/investigate a novel architecture for fault tolerant and high performance Information Services, maintaining dynamic session-related metadata of widely distributed services and providing uniform interface to both interaction-independent and session-related context.
6.1. An Integrated Information System Architecture
We designed and built a novel architecture [67] for a WS-Context complaint metadata catalog service supporting distributed or central paradigms. The main intended use of our approach is to support information in dynamically assembled Grids where services are tied together in a dynamic workflow to solve a particular problem. Also, the intended scale for our design is in the order of thousand entities that are participating in a workflow session.
We based the programming interface of our system on two widely used specifications: WS-Context and Universal Description, Discovery and Integration (UDDI). We extend both specifications to provide advanced capabilities to support handling and discovery of not only quasi-static, stateless metadata, but also session related metadata. Our approach is to utilize the existing state-of-art systems for handling and discovering static metadata and address the problems of distributed management of dynamic metadata.