1-1-1997
Cell-specific and interferon-inducible expression of
chicken major histocompatibility class II genes
Chung-Hsin Chung-Hsin
Iowa State UniversityFollow this and additional works at:https://lib.dr.iastate.edu/rtd
This Thesis is brought to you for free and open access by the Iowa State University Capstones, Theses and Dissertations at Iowa State University Digital Repository. It has been accepted for inclusion in Retrospective Theses and Dissertations by an authorized administrator of Iowa State University Digital Repository. For more information, please [email protected].
Recommended Citation
Chung-Hsin, Chung-Hsin, "Cell-specific and interferon-inducible expression of chicken major histocompatibility class II genes" (1997).Retrospective Theses and Dissertations. 17844.
chicken major histocompatibility class II genes
by
Chung-Hsin Hsu
A thesis submitted to the graduate faculty
in partial fulfillment of the requirements for the degree of MASTER OF SCIENCE
Major: Immunobiology
Major Professors: Susan J. Lamont and Susan L. Carpenter
Iowa State University Ames, Iowa
Graduate College Iowa State University
This is to certify that the Master's thesis of
Chung-Hsin Hsu
has met the requirements of Iowa State University
TABLE OF CONTENTS
ABSTRACT
INTRODUCTION
LITERATURE REVIEW
The structure and functions of the major histocompatibility complex The structure and functions of the chicken MHC
Regulation of MHC expression Interferon
Cell specificity of MHC class II genes
MATERIALS AND METHODS
Cell lineCell culture conditions
Antibody to chicken MHC class II protein Interferons
Flow cytometry
Optimization of the conditions Induction of MHC class II surface antigen by IFN
Statistical analysis
p234 probe and 32p-labeling Chicken ~-actin probe
Northern blot 31
RESULTS
33Flow cytometry 33
Optimum conditions for detection of chicken MHC class II surface antigen
by flow cytometry analysis 33
Cell-specific expression of chicken MHC
class II surface antigen 33
Induction of chicken MHC class II cell-surface
antigen by IFN-rich cell culture supernatant 37 Induction of chicken MHC class II cell-surf ace
antigen by recombinant chicken IFN 52
Northern blot analysis 55
DISCUSSIONS
66Effect of IFN on cell-specific expression
of MHC class II gene expression 66
Transcriptional control of chicken
MHC class II gene 71
APPENDIX
77REFERENCE CITED
78
ABSTRACT
The immune system is an adaptive defense system that is
capable of producing many kinds of cells and molecules that
work together to eliminate foreign invaders of vertebrate
animals. In this system, B cells, T cells and macrophages
work together through the help of the major
histocompatibility complex (MHC) molecules to carry out the
task. The MHC class II antigens are mainly restricted in
expression to B cells, macrophages, activated T cells and
other antigen-presenting cells. They can also be expressed in
some other class II-negative cells when induced by
Interferongamma (IFNTI, Tumor necrosis factoralpha (TNF
-a), Interleukin-4 (IL-4) and other stimulatory factors. In
mammals, interferon-gamma (IFN-y) can induce MHC class I and
class II expression on macrophages. This is also true in the
chicken. The goal of this research was to characterize cells
for differences in constitutive or IFN-inducible regulation
of avian MHC class II gene expression. Here we examined
chicken cell lines of different cell types with different
basal levels of MHC class II surface antigen expression.
These cells were evaluated for levels of MHC class II surface
without interferon exposure. Presence and level of transcription of the gene in a chicken macrophage cell line, before and after induction with IFN, a B cell line and a T cell line was also determined by Northern blot analysis. Here we found that the constitutive expression of chicken MHC class II gene is restricted to the B cells, and is inducible in macrophage to a very high level upon recombinant chicken IFN treatment. The T cell line showed a very weak increase in chicken MHC class II surface antigen level when induced with recombinant IFN but not with the IFN-rich supernatant. The DT-40 pre-B cell was weakly induced by p34(200) IFN-rich supernatant. Northern blot analysis demonstrated the differences in the chicken MHC class II surface antigen level correlated with the transcriptional level of class II gene in B cells and macrophages. However, high abundance of chicken MHC class II RNA transcripts in T cells, comparable to that of the macrophages induced with 1:200 dilution of ChIFN, were detected, even though the class II surface antigen was not detected by flow cytometry. The outcome of this research supported the previous findings of Kasper et al. (1994) that chicken MHC class II antigen expression can be induced in macrophages upon IFN treatment, although a lower level of
when compared to the work of Kasper et al. However, the level
of chicken MHC class II antigen induction in MQ-NCSU greatly
increased when recombinant IFN was used. This result
supported Schultz et al (1995) in that this recombinant ChIFN
is a chicken homologue of mammalian IFN-y. The research
established a gene regulation system for the study of the
chicken MHC class II gene regulation. Further studies of how
this cell-specificity is achieved among these different
immune cells can contribute to a greater general
understanding of cell-specific regulation and the study of
constitutive and inducible gene regulation of MHC class II
INTRODUCTION
The immune system is an adaptive defense system that protects the vertebrate from invading pathogens and cancer (Kuby, 1992). It is capable of producing many kinds of cells and molecules that work together to eliminate foreign invaders of the body. In the immune system (Kuby, 1992), B lymphocytes, T lymphocyte and antigen presenting cells such as macrophages, dendri tic cells and B cells that carry antigen in a form that can stimulate lymphocytes (Roitt et al., 1993) work together to achieve this process with the help of major histocompatibility complex (MHC) molecules and many cytokines. The MHC class II antigens are mainly restricted in expression to B cells, macrophages, activated T cells and other antigen-presenting cells . They can also be expressed in some other class II-negative cells when induced by Interferon-gamma (IFN-~, Tumor necrosis factor-alpha (TNF
-a), Interleukin-4 ( IL-4) and other stimulatory factors.
molecules has only been done in the class II genes of the peripheral blood monocytes (Kasper et al , 1994). Al though there are similarities between the chicken and mammalian MHC, chicken MHC genes differ from those of mammals in organization and sequence (Guillemot et al., 1989) .
induced at any condition tested, and the MHC class II
negative T cells were weakly induced (p<0.05) by recombinant
chicken IFN. MHC class II negative pre-B cells were induced
very weakly (p<0.05) by partially-purified p34(200) at higher
concentration. It was also found that the high abundance MHC
class II mRNA transcripts were not translated into MHC class
II proteins. The extension of this research such as
footprinting and in vitro studies of the transcriptional
factors will contribute to a greater general understanding of
how cell-specific regulation of the MHC class II gene is
achieved in the chicken cell lines through the action of the
cis and trans regulatory elements, and also contribute to
the the study of inducible transcriptional regulation of the
LITERATURE REVIEW
To generate an effective immune response, two major
groups of cells are needed. They are the lymphocytes and the
antigen-presenting cells (APCs). Specificity, diversity,
memory and self/nonself recognition of the immune response
are mediated by the lymphocytes. Lymphocytes recognize
antigens by means of membrane receptors specific for the
foreign material. The two major population of lymphocytes
are the B lymphocytes and the T lymphocytes. B lymphocytes
mature within the bone marrow and leave the bone marrow
carrying a unique antigen-binding receptor, which is called
an antibody molecule. When the B cell encounters an antigen
which is specific to the membrane-bound antibody, the B cell
begins to divide rapidly and differentiates into memory B
cells, which continue to express membrane-bound antibody with
the same specificity as the original parent cell, and plasma
cells, which produce antibody of the same specificity but in
a secreted form. T lymphocytes also arise from hematopoetic
stem cells in the bone marrow, but migrate to the thymus
gland to mature. T cells express a unique membrane receptor
for antigen which recognizes antigen only in association with
cell membrane proteins known as major histocompatibili ty
The structure and functions of the major histocompatibility complex
The Major Histocompatibility Complex (MHC) is a
chromosomal region containing a family of immune-related
genes which are involved in many cellular properties of
importance to the immune response (Schierman and Nordskog,
1961; Klein, 1986). In mammals, the MHC is grouped by
structure and function into three classes, named class I,
class II and class III. The class I genes encode for
cell-surface glycoproteins, which are present on almost all types
of cells, and are responsible for recognizing foreign tissues
and virally infected cells. The class II genes also encode
cell-surface glycoproteins which are constitutively present
on immunocompetent B cells and dendritic cells (Germain
1986). In addition, a large number of molecules can induce
class II antigens on many kinds of cell types. Both class I
and class II antigens are involved in the cell-cell
interaction in the immune responses in the immune system.
Both class I and class II genes participate in non-self
recognition (Kuby, 1992) The class III genes encode several
complement proteins, as well as a diverse collection of at
least 20 other genes (Blair et al., 1995), including
21-hydroxylase and tumor necrosis factor. There are no
established functional or structural similarities between
class III gene products and the class I or class II
The structures of class I and class II antigens have
been defined in detail. The class I antigen consists of two
chains, an glycosylated
a
chain of molecular weight of about45 Kd and a non-polymorphic P2 microglobulin. The
a
chainanchors in the plasma membrane and has three domains. The P2
microglobulin is non-covalently associated with the a chain
and has a molecular weight of about 12 Kd. This protein is
not encoded in the MHC. The class II antigens are
heterodimers consisting of a heavy
a
chain and a light Pchain. The molecular weights of the
a
chain and thep
chainare about 34 Kd and 29 Kd respectively (Groenen et al. 1990).
Several functional domains can be distinguished: for class I
genes, the ai, a1, a3 and P2 extracellular domains; for class
II genes, the ai, a1, Pl and P2extracellular domains. Both
classes also have a transmembrane segment and cytoplasmic
tail.
Class I and class II proteins are responsible for
stimulating different populations of T cells. Class I
proteins bind endogenous antigens that have been processed
within the cell and present them at the surface to T cells.
The class I proteins present antigens primarily to CD8
antigen positive, cytotoxic T cells. Class II proteins bind
exogenous antigens that have also been processed in the cell
but presented by antigen presenting cells (APCs) such as
macrophages and dendritic cells. Class II proteins usually
bound by TCR:CD3 complex of the CD8 T cells, initiate CTL killing of intracellular bacteria/virus-infected cells. Class II antigens, when bounded by TCR:CD3 complex of the CD4 T cells, facilitate the degradation of endocytosed extracellular antigens which are presented by APCs (Blair et al. I 1995).
The structure and functions of the chicken MHC
The chicken MHC, also designated as the chi cken B complex, was first described as a locus controlling blood group antigens in 1948 (Briles et al., 1950). Later, i t was identified as the chicken MHC by its polymorphism and its control of alloreactivity (Schierman and Nordskog, 1961). It differs from its mammalian counterpart in size and organization (Guil lemot et al., 1989) . The biochemical structure, functional attributes and tissue distribut ion of the B l ocus antigens show that they are the chicken equivalents of the mammalian MHC molecules. However, the chicken B complex is not only responsible for graft versus host reaction, viral infection, cell to cel l interaction and
immune responses (Nordskog et al., 1987; Schierman and Collins, 1987; Vainio et al., 1987), but is also associated with resistance to certain diseases and some biological
The chicken MHC genes consist of three classes (Nordskog
et al., 1987; Vainio et al. , 1987) . The class I (B-F) and
class II (B-L) antigens are similar to those of mammals in
their function and structure. However, the class IV (B-G)
molecules are unique, because they are expressed primarily on
red eel 1 s and their progenitors, and no corresponding
polymorphic molecules have been found in other animals (Pink
et al., 1977). The B-G genes encode differentiation antigens
restricted to the erythroid lineage designated as class IV
which is not present in the mammals ( Salomensen et al.,
1991). In addition, six class I, five class II and one
class IV genes were found in the B complex of chicken MHC
haplotype B12 (Guillemot et al., 1989).
As in the other species, the chicken MHC molecules
display extensive polymorphism. Both serological tests and
restriction fragment length polymorphism (RFLP) analysis have
shown that the MHC antigens differ extensively among
different haplotypes. In previous studies (Auffray et al.,
1986; Hala et al., 1988), five different B-Lfi genes from the
CB-B12 and two from the GB-B6 haplotype have been molecularly
cloned.
The organization of the class I and class II MHC genes
of the chicken is unlike the corresponding mammalian MHC
genes. Hala et al. (1988) have searched for recombinations in
crosses between the congenic lines CB (B12 ) and CC (B4 ) by
restriction enzyme fragment length polymorphism (RFLP)
analyses and indicated that B-F and B-L genes are tightly
linked together at a distance of below 0.01 centimorgan and
therefore is lack of recombination (Hala et al. , 1988). Also,
the chicken MHC is located on the microchromosome that also
contains all of the ribosomal ribonucleic acid (rDNA) genes
that are detected as a nucleolar organizer region (Bloom et
al., 1987). From the studies of Guillemot and colleagues, it
was shown that the B complex is much more compact than mouse
H-2 or human HLA complexes (Guillemot et al., 1989) The
chicken MHC class I and class II genes are interspersed. The
B-L and B-F genes are only separated by a distance of 10 to
20 Kb , which is 2 orders of magnitude closer than the H-2
and HLA genes. In addition, the genes in the B complex are
about 10 times smaller than the mammalian MHCs because of
their shorter intrans. The total size of the B complex is not
yet known. However, the minimum size of the B-F/B-L region
is about 250 Kb, and the size of the B complex might be a
minimum of 850 Kb and a maximum of 2000 Kb (Guillemot et al.,
1988). With the studies made by mapping two rDNA genes to
one end of a B complex cosmid cluster, i t was found that the
B complex is tightly linked to the nucleolus organizing
region (NOR) on the chromosome (Guillemot et al. , 1988). So,
it was suggested that the B-G genes which are not directly
linked to the B-F/B-L loci are located either close to the
chromosome (Guillemot et al., 1988). Recently, another
chromosomal locus, Rfp-Y, has been discovered to contain
chicken MHC genes but is unlinked to the B complex (Briles et
al., 1993; Miller et al., 1994). The Rfp-Y genes, however,
have been mapped to the cosmid cluster II/IV (name of cluster
assigned by Guillemont et al., 1988), which is located on the
MHC microchromosome 16 (Fig .1) (Miller et al., 1994a; Miller
et al., 1994b) .
The first study of chicken MHC class I and class II
genes was conducted using mammalian probes (Anderson et al.,
1987; Auffray et al., 1987; Bourlet et al., 1988; Guillemot
et al., 1988; Guillemot et al., 1989). A chicken DNA probe
produced by screening a chicken genomic library at low
stringency with a human HLA-DQP cDNA probe was later used
as a probe for chicken B-L gene analysis (Andersson et al,
1987). This probe was used to isolate three class II MHC gene
clones from a highly inbred (99%) chicken line G-B2
(haplotype B6) (Xu et al., 1989).
A genomic library was constructed and three class II MHC
genes were isolated from this phage library using a chicken
B-LP probe p234 which is a p2 specific probe. The clones were
named CCII-2, CCII-4 and CCII-7 (CCII stands for Chicken
Class II) (Xu et al., 1989) . They were restriction mapped,
and the B-L genes in each clone were localized by Southern
blotting. The B-LP genes in each of the three clones were
Ila 11p 11p 10. lo.
---
--
:im_-
----~--- ----
-- . . --NOR
'* ;
>12.1
chromosome 16 or 17
around 8 Mb
chromosome 16
B-G 8.4
cluster I
130 Kb
21.6 TAP
unlinked In
backcross
family
• • • . I
--
...
--
..
--
---
--
--B·G genes
B·G genes
cluster V
60 Kb
11p
--
-
---
13.1. rRNA- -
genes cluster Ill100 Kb
unlinked In
backcross family
cluster VI 75 Kb
Rfp-Y locus
lo lo 11p lip
-
-
---
-
-
-....-----
-17.8
cluster ll/lV 100 Kb
Fig.1 Current view of the chicken Mhc and genomic regions
containing related genes. This is a map modified from map
produced by Kaufman et. al. (1993)
-47c
named CCII-2-1, CCII-4-1 and CCII-7-1. Restriction maps were constructed by Southern hybridizaton with
Pl
exonoligonucleotide probe [A2] probes. It appeared that because of the absence of
and 3 'UT oligonucleotide [ 39]
the CCII-2-1 was a pseudogene
Pl
exon and 3'UT in thep
genecloned, therefore, only the CCII-4-1 and CCII-7-1 were sequenced. After the sequences of the two genomic subclones were obtained, the results implied that both CCII-4 and CCII-7 were active genes which would be interesting for further study (Xu et al., 1989).
Regulation of MHC expression
Regulation of gene expression of H-2 and HLA has been extensively studied. For the class I MHC gene, a sequence upstream of the H-2K gene binds a nuclear factor H2TF1 and stimulates the expression of the class I MHC on all cell types. This sequence was also found to interact with a tissue specific nuclear factor NF-kB (Baldwin and Sharp, 1988), which also binds to the immunoglobulin k chain gene enhancer
in B cells.
Interferon-garruna (IFN-~, Tumor necrosis factoralpha (TNF
-a), Interleukin-4 (IL-4) and other stimulatory factors.
Macrophages can express class II antigens inductively only
after stimulation (Benoist and Mathis, 1990). Studies in the
human MHC showed that several specific sequences irrunediately
upstream of the class II gene initiation site and the
DNA-binding factors are important in the expression of class II
antigens on the cell surface (Glimcher and Kara, 1992). These
factors can modulate the expression of the class II antigens
in a cell-dependent manner by a variety of positive and
negative stimuli and the outcome is directly involved in the
control of normal and abnormal irrunune responses.
Little information is available regarding MHC class II
gene regulation in the chicken. It was found that sequences
in the 5' flanking region of B-LfiII were similar to S, X and
Y boxes in marrunals' class II genes, but with some mutations
in these elements that rendered the B-LfiII gene inactive
(Zoorob et al., 1990). Also, an ATTGG sequence is located
within the Y box and two of the mutations in the B-LfiIII gene
are just within this sequence, implying that CCAAT-binding
factor might play a significant role in the expression of B-L
genes. The B-L genes lack the typical TATA box or CCAAT box
and an adenosine surrounded by pyrimidines may act as the
transcription initiation site. Finally, there are SPI-binding
sites (Kroemer et al., 1990). The structure and expression of
al.(1990) Recent studies on the chicken class I genes
revealed the sequence of beta 2-microglobulin gene as a
small, GC-rich gene with X and Y boxes in the promoter
(Riegert et al., 1996). Class I gene expression can be
induced by IFN (Zoller et al., 1992).
There is evidence that the expression of class I and
class II MHC genes are regulated differently in mouse
compared to human (Sartoris et al. , 19 9 0) . Therefore,
although they have similar sequences, one cannot assume that
these regulatory elements act in the same manner among
different species. Especially, none of the sequences
considered to be highly conserved appears exactly like those
in B-L/3II except the transcription initiation site. When
examining the chicken MHC in the G-B2 line, the X box is
conserved quite well but there are quite a few mismatches in
the Y box (Chen et al., 1997) .
From our laboratory's past work on the CCII-7-1 clone,
it was shown that in the 5' upstream region, the regulatory
elements located in the region of about -150 to -500 bp from
the translation initiation site have 60% to 100% similarities
to the human MHC. Much work has been done to analyze the
regulatory elements and their functions in CCII-7-1 (a
subclone of CCII-7 which contains the promoter of that gene) .
The presence of the S, X, Y boxes in the promoter has been
identified in the chicken. Comparison between the sequence of
sequence, indicated that regulatory elements besides S, X, Y
boxes were also present. Using the chloramphenicol acetyl
transferase (CAT) reporter system, a 0. 7 Kb 5' flanking
region of the CCII-7-1 subclone was proven to be a functional
promoter containing the conserved S, X, Y boxes, negative
regulatory elements and other cis-acting elements (Chen et
al., 1993), which are crucial for constitutive and
interferon-inducible regulation of class II expression in
human and murine cells (Dorn et al., 1987) . However,
surprisingly, deletion analyses indicated that S, X, Y boxes
did not have a significant influence on promoter activity
(Chen et al., 1993) in macrophages. Glucocorticoids were
shown to decrease interferon-induced gene expression in the
same transient transfection assay system of chicken class II
promoter construct and CAT reporter gene (Chen et al., 1993).
Interferon
Activation of both the humoral and cell-mediated immune
response requires lymphokines produced by TH cells. To ensure
careful regulation of the immune response, TH cells can only
be activated by antigen recognition when the antigen is
displayed together with MHC on the surface of APCs, which
Interferons (IFNs) are a family of proteins first
characterized by antiviral assays, but are also potent immune
regulators that modulate cell differentiation and
antiproliferation factors. In the humans, they are divided
into IFN-a, IFN-P and IFN-y in accordance to varying degrees
in antigenicity, nucleotide and amino acid sequence,
structure and biological function (Kuby, 1992). IFN-a is made
by leukocytes in response to virus or nucleic acids. It is
actually a family of structurally related molecules (Pestka,
et al., 1987). Most of them are glycosylated. The apparent
molecular weights of the human IFN-a range from 16,000 to
27,000 (Rubinstein et al., 1979; Staehelin et al., 1981).
IFN-P is derived from fibroblasts in response to viruses or
nucleic acids. The human IFN-P exhibit an apparent molecular
weight of approximately 20,000. The amino acid composition is
similar to that observed in human IFN-a, and was demonstrated
to be a glycoprotein (Knight and Fahley, 1982). Human IFN-y is
produced by T cells in response to antigen or mi togen
activation, with an apparent weight of 15, 000 to 25, 000
(Friedlander et al., 1984; Yip et al., 1984) . All three
groups of IFN have antiviral activity and induce an increase
in surface expression of class I MHC antigens (Heron et
al.,1978). The main action of IFN-a and IFN-P is to induce an
antiviral state (Kuby, 1992) and are therefore used to
inhibit cell growth in certain rare cancers such as renal
IFN-y has been shown to be an important activator of
macrophages, including up-regulation of immunoglobulin Fe
receptors, MHC class I and class II antigens (Pestka et al.,
1987). Also, when IFN-y is added together with interleukin-4
to B cells, the class switch to IgE is blocked (Kuby, 1992).
Promoters that respond to IFNs have consensus
DNA-binding sites, which were originally called interferon
consensus sequences ( ICS) They are also known as
IFN-responsi ve elements (IRE). These are the elements to which
activators bind and through which gene expression is enhanced
(Freidman et al., 1984). It is now known that upon
stimulation with interferon, STATl and STAT2 are
phosphorylated to form a heterodimer with p48, resulting in
the complete form of the ISGF3 complex. The ISGF3 complex
binds to ICSs in promoters of most IFN-a/~-responsive genes
and transactivate the genes through signal transduction
pathways (Lee and Benveniste, 1996; Gustafon and Ginder,
1996) .
Recombinant DNA technology has led to the availability
of large quantities of pure human IFN and thus the studies of
the effect of the IFNs and the structural analysis on them.
However, relatively little study has been conducted in the
avian species due to less readily accessible recombinant
cytokines. Kaspers et al. (1994) have reported that
expression of MHC class II molecules in chicken macrophages
derived from Con A induced spleen cell. Only limited
descriptions of avian interferon have been published. Chicken
IFN was first discovered as an antiviral activity secreted by
virus-infected choriollantoic membranes (Isaac and
Lindenmann, 1957) Chicken IFN from virus-infected chicken
eggs (Krempien et al., 1985) or embryonic chicken cells
(Kohase et al., 1986; Kroemer et al., 1990) was partially
purified and found to be a glycoprotein of approximately
25KDa.
Although mammalian IFNs presently are grouped into five
families of genes: IFNs-alpha, -beta, -omega, -tau (all are
Type I), and -gamma (Type II) (Sekellick et al., 1994),
chicken IFN appears to consists of a single antigenic species
(Kohase et al., 1986, Beladi et al., 1993) that is largely
acid-stable and unusually resistant to heat inactivation.
This ChIFN is neutralized with antibody prepared against
acid-stable IFN (Yoshida and Marcus, 1990), suggesting a
single type of IFN (Sekellick et al., 1994). Recently, a gene
encoding chicken IFN was cloned from a cDNA library made from
primary chick embryo cells (Sekellick et al., 1994). This
cDNA clone showed 80% homology with mammalian type I
interferon. This cDNA clone was expressed in E.Coli or COS
cells and a recombinant IFN produced (Schultz et al., 1995).
Other methods of producing IFN include concanavalin A
induction (Kaspers et al., 1994) and virus induction of
et al., 1996). The purified recombinant chicken IFN was shown
to be a powerful antiviral agent which has a specific
antiviral activity of approximately 108 IU/mg protein and has
high Mx promoter-inducing activity. This recombinant IFN
lacks macrophage activating factor (MAF) activity, therefore
is not a general activator like LPS, but has specific IFN-y
like action in inducing macrophage to express MHC class II
surface antigen. It is a glycoprotein of about 20kDa, and
believed to be a chicken homologue of IFN-y in its action to
activate macrophages in releasing NO and induce MHC class II
expression. However the activity spectrum resembles mammalian
type I IFN (Schultz et al., 1995).
Cell specificity of MHC class II genes
As the embryo develops, cells specialize for function in
tissues. In the animal kingdom, the higher eukaryote contains
a very wide range of different cell types, each of which
expresses specific genes encoding particular products
necessary for the specialized function of that cell type.
Many of the genes are expressed temporally in specific
tissues, at specific development stages or in response to
environmental stimuli of many kinds. Examples of the cells
pancreas, liver, skeletal muscle cells, B cells, activated T cells, and many others (Liu et al., 1996).
Mammalian MHC class II genes are also expressed constitutively in B cells, but are inducible in macrophages upon stimulation (Basham and Merigan, 1983) Studies have demonstrated that the conserved DNA elements termed X and Y boxes found in mammalian MHC class II gene (Benoist and Mathis, 1990) are crucial for class II promoter activity in both B cells and IFN-y-induced cells. Also, many other
DNA-binding factors could contribute to the differential expression of the gene in different tissues.
achieve cell-specific expression in many other cell types .
This regulated expression contributes importantly to maintain
the dynamic but homeostatic status of the mammalian body.
The specific goal of this research was to analyze
cell-specif ic and IFN-inducible expression of avian MHC class II
genes. Cells that differ in constitutive or IFN-inducible
regulation of avian MHC class II gene expression will be
identified, so as to set up a model in the research for the
study of cell-specific gene expression. The extension of
this research will contribute to a greater general
understanding of cell-specific regulation and the study of
MATERIALS AND METHODS
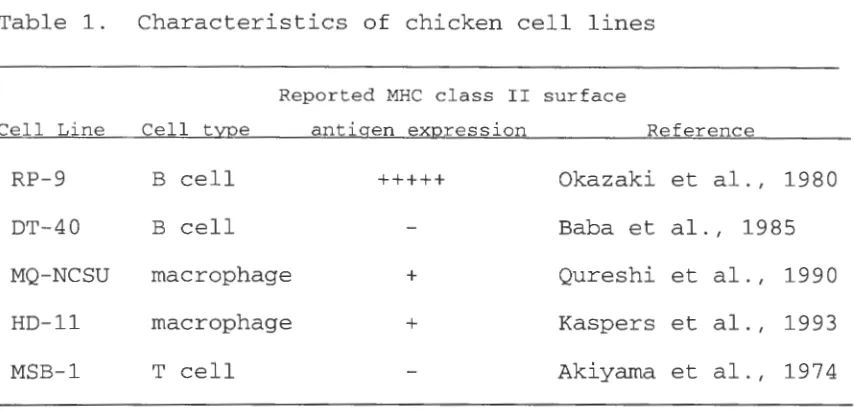
Cell lines
Several chicken cell lines were selected for this study.
RP-9 is a lymphoid leukosis virus transformed B cell line
which expresses high levels of chicken MHC class II surf ace
antigen. DT-40 is an avian leukosis virus transformed B cell
line having low level of the class II surface antigen
expression. MSB-1 is a Marek's disease virus transformed T
cell line which does not express class II antigen
constitutively. MQ-NCSU is a Marek's disease virus
transformed macrophage cell line which does not express class
II antigen constitutively. The MQ-NCSU was donated by M.A.
Qureshi (North Carolina State University) . Both DT-40 and
MSB-1 cell lines were donated by C. Thompson (University of
Chicago). HD-11 is an MC29 virus transformed chicken
macrophage cell line which does not express class II antigen
constitutively. RP-9 was donated by Hans Cheng (Avian
Disease and Oncology Laboratory, East Lansing, MI) and HD-11
cell line was donated by H.S. Lillehoj (USDA, Agricultural
Research Service, Beltsville MD). Characteristics of the
Table 1. Characteristics of chicken cell lines
Reported MHC class II surface
Cell Line Cell type antigen expression Reference
RP-9 B cell +++++ Okazaki et al. , 1980
DT-40 B cell Baba et al., 1985
MQ-NCSU macrophage + Qureshi et al., 1990
HD-11 macrophage + Kaspers et al., 1993
MSB-1 T cell Akiyama et al., 1974
Cell culture conditions
The RP-9 cells were maintained in 2:1 Leibowitz L-15 :
McCoy 5A medium supplemented with 20% chicken serum and 10%
newborn calf serum (NCS) . DT-40 cells were maintained in
Dulbecco's modified Eagle's medium (DMEM) supplemented with
10% NCS. MQ-NCSU cells were maintained in 1:1 Leibowitz
L-15 : McCoy 5A medium supplemented with 10% NCS. HD-11 cells
were maintained in RPMI supplemented with 10% NCS. MSB-1
cells were maintained in DMEM supplemented with 10% NCS.
Chicken embryo fibroblasts were collected from 9-11 day old
embryos by decapitation, mincing the tissue into smaller
pieces and then trypsinizing at room temperature for 45 min.
[image:31.574.59.486.81.287.2]solution at 1500 g for 4 minutes and discarding the fluid,
the cells were washed with Hank's balanced salt solution and
then resuspended into DMEM supplemented with 10% NCS. All
culture media were also supplemented with 1000 U/ml
penicillin-streptomycin and 2mM glutamine. All cell lines
were incubated at 42°c with 5% C02 in 75cm2 canted-neck flasks
(Falcon).
Antibody to chicken MHC class II protein
The monoclonal antibody (mAb) used in this study was
Cia-1, which is of IgMK species and is reactive with a
monomorphic determinant of the Ia-like (B-L, or MHC class II)
antigens (Ewert et al., 1984). This antibody reacts with
determinants on B cells in all avian species tested, but does
not detect antigens on lymphocytes of representative mammals,
reptiles and amphibians. In addition to labelling the MHC
class II antigen on B cells, this antibody defines a
subpopulation of the monocyte-macrophage series and reacts
with mitogen(Con A)-activated T cells (Ewert et al., 1984).
The mAb was kindly donated by Dr. D. L. Ewert (Wis tar
Interferon
The p34 IFN-rich supernatant was used in the first stage
of this research due to the general unavailability of the
chicken recombinant IFN which was used in the later stage of
the research. The p34 is a partially-purified IFN-rich
supernatant prepared by stimulating spleen lymphocytes
obtained from SC chickens with 10 mg concanavalin A for 48
hr. The supernatant was partially purified by first passing
the supernatant to a controlled pore glass column
equilibrated in PBS, pH 7.2, then collected by washing the
column with 0.5 M Tris-HCl, pH 9.5, containing 1.5 M NaCl
(Kaspers et al., 1994) . This parially purified IFN-rich
supernantant was then named p34(200). This IFN was generously
donated by Dr. H.S. Lillehoj (USDA, Agricultural Research
Service, Beltsville MD). The recombinant chicken IFN (ChIFN)
used in the study was prepared by expressing in E.Coli a cDNA
encoding ChIFN cloned from virus-infected primary chicken
embryo cells. The recombinant ChIFN alone has no Macrophage
Activity Factor (MAF) activity, which might be caused by an
unrelated cytokine (Schultz et al., 1995). It is specific in
its mammalian type II IFN action, which is believed to
chicken homologue of mammalian IFN-y. This ChIFN is a gift
Flow cytometry
Flow cytometry analysis was used to determine optimum
conditions on mAb usage, secondary antibody usage, basal
chicken MHC class II surface antigen expression level of
different cell types, the amount of IFN and time needed for
optimum induction of the chicken MHC class II surface antigen
with IFN, and the induced class II antigen expression levels.
Cia-1 mAb was used in all the assays for all the cell
types. In all assays, either the RP-9, DT-40, MQ-NCSU,
HD-11, MSB-1 cell lines and 9 to 11 days chicken embryo
fibroblasts selected for each different experiment were
suspended in
albumin and
lX PBS, supplemented with 4% bovine serum
0.2% NaN3 (PBA) at 2x10⁸ / ml; 50µ1 were
transferred to individual 3 ml polypropylene tubes and
incubated with 50µ1 of the appropiate diluted anti-chicken Ia
mAb (1:400) Isotype control mAb (Sigma, mouse IgMA) were
used in all assays. The cells were incubated on ice for 30
min, washed two times with PBA , and resuspended in 50 µl PBA
buffer. 50µ1 of fluorescein-conjugated goat antibody to mouse
IgG-IgM (Cappel) were added and the cells incubated for 30
min on ice. After a final washing, the cells were resuspended
in lml PBA and stained with 2µ1 of 5mg/ml Propidium Iodide,
and f luorometric analysis was performed on an EPICS XL flow
cytometer (Coulter Corporation, Miami, FL). Live cel ls gated
forward scatter, were analyzed for fluorescein fluorescence.
The results were displayed as frequency distribution
histograms of log1o of the fluorescein fluorescence of at
least 5000 cells. In modern flow cytometry, photons produced
by the fluorescence emmision are converted into electrons
which form voltage pulses. These voltage pulses are digitized
to values proportional to the intensity of the fluorescence
emitted. The digital values are then converted mathematically
for presentation on a log scale. The accuracy of this linear
to log conversion permits the comparison of antigen
expression level between individual samples by comparing the
mean fluorescence values. The flow cytometry data shown in
each table and figure were generated by subtracting the mean
fluorescence value of the isotype controls from the mean
fluorescence value of the era-I labeled groups individually
and calculated as mean ± SEM. The ranges and means of the
isotype control of each cell type is enclosed at the
appendix.
Optimization of conditions
To determine optimum conditions for labelling the cells
with era-I mAb, several tests were conducted. For optimum mAb
dilution for the assay, RP-9 cells were subjected to the
different dilutions (1:25, 1:50, 1:100, 1:200, 1:400, 1:800
1:1600) of the mAb. Optimum secondary Ab dilution for the
assay was also tested by repeating the assay with the
exception of using different dilutions (1:25, 1: 50, 1:75) of
secondary Ab to RP-9 cells when using 1:400 dilution of the
Cia-1 mAb. Flow cytometry analysis was then performed using
1: 400 dilution of era-I and 1: 50 dilution of secondary
antibody to measure basal and induced MHC class II expression
of each cell type used in this study.
Induction of MHC class II surface antigen by IFN
To determine the best condition of interferon dilution
and time that could give the MQ-NCSU and HD-11 macrophages
the highest level of induction, 1: 1000, 1: 2000 and 1: 4000
dilutions of p34(200) IFN-rich supernatant were added to the
cell cultures for 24, 36, 48 and 60 hour. After the desired
incubation time was reached, cells were prepared and
subjected to flow cytometry analysis using the previous
discussed procedure.
When recombinant IFN became available, flow cytometry
analysis was again performed on MQ-NCSU, to determine the
equivalent dilution of the recombinant ChIFN to the IFN-rich
supernatant. The determined dilution was used as a starting
the recombinant ChIFN to use in the assay. The above
determined optimum concentration was then used to determine
the optimum chicken class II MHC surf ace antigen expression
level that can be induced in MQ-NCSU. One group of MQ-NCSU
was incubated with 1:2000 dilution of the p34(200) IFN-rich
supernatant, the others with 1:1000, 1:400, 1:200 and 1:100
dilutions of the recombinant ChIFN.
The MQ-NCSU, RP-9 and MSB-1 cells were cultured in the
presence of ChIFN and analysed for the comparison for the
level of IFN-induced MHC class II expression using the
general flow cytometry analysis protocol described above.
Statistical analysis
Student's t-test was used to analyse the significance of
difference in expression level in each paired experimental
group. It is designed for the analysis of small sample
populations. The null hypothesis of the Student's t-test
assumes that there is no difference between two populations
tested. Therefore the greater the P value the greater the
probability that the two populations are the same and vice
versa (Watson, 1992) . In this research, the difference
between two populations were determined to be significant
p234 probe and 32P-labelling
The p234 is a chicken MHC class II P2 exon specific
probe produced by screening a chickenAL47 genomic library
with a human HLA-DQP cDNA probe at low stringency. The size
of this fragment is 234 bp (Bourlet et al., 1988). Thi s probe
DNA was a gift from C. Auffray of Institut d' Embryologie,
France. 250 µg of denatured p234 DNA was random primed with
500µM dATP, 500µM dGTP, 500µM dTTP and 50µCi [a-32p]dCTP
using 5 units of Klenow fragment. The labeled probe was used
in the hybridization of the Northern blot.
Chicken P-actin probe
The P-actin probe used in this research was a 590 bp
cDNA which encodes for the 3' untranslated region of a
chicken P-actin gene. The cDNA was constructed from an mRNA
of embryonic chick brain. This cDNA probe specifically for
chicken only (Cleveland et al. , 1980). This cDNA is a gift
from Dr. Donald Beitz (Iowa State University) 120 µg of
denatured P-actin DNA was random primed with 500µM dATP,
Klenow fragment. The labeled probe was used in the
hybridization of the Northern blot.
Northern blot
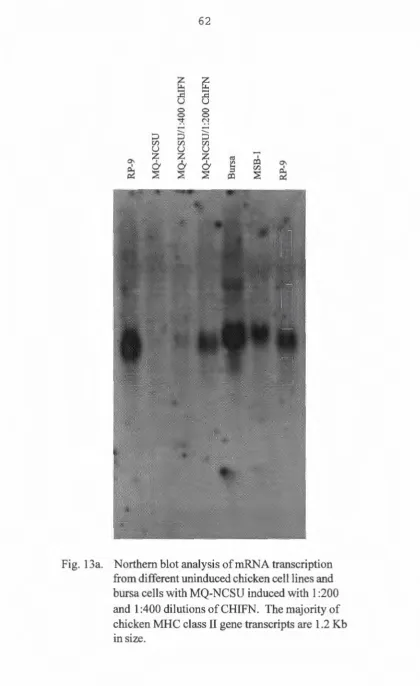
To relate the presence of the MHC class II antigen is
with the presence of its mRNA transcript, and also, to see if
the induced MHC class II antigen expression is due to
induction of the messenger RNA (mRNA) transcript, mRNA was
isolated for Northern blot analysis. Messenger RNA was
isolated from RP-9, DT-40, uninduced MQ-NCSU, and chicken
recombinant IFN induced MQ-NCSU, using the Ambion Poly(A)+
RNA isolation kit. RNA quantity was determined by
spectrophotometer. Thirty micrograms of mRNA from each of
the above mentioned cell types were loaded onto a 1. 5%
formaldehyde gel, and electrphoresed at 75 volts for 3 hours.
At the end of the run, the gel was prepared by immersed
shaking in an alkaline solution (lM NaOH,lM Nacl) for 15 min,
then in O.lM Tris pH 7.5 for 15 min, and finally in 20X SSC
for 3 0 min before transferring onto a nylon membrane.
Transfer was done by the upward osmosis method overnight. The
membrane was fixed by an autolinker (Stratagene) . The
prepared membranes were first prehybridized and hybridi zed at
-actin DNA probe after the p234 probe was striped, for
detection of the expression of chicken class II gene and to
standardize RNA quantity transfered to the nylon membrane
respectively. The prehybridization and hybridization solution
consisted of SX SSPE, SX Denhart's solution, 0.1% SDS,
lOOµg /ml denatured salmon sperm DNA, and 5 0% molecular
biology grade formamide. The membranes were washed with SX
SSC, 1% SDS for 20 minutes once and with 0.1 X SSC, 2% SDS
for twenty minutes twice, and subjected to autoradiography
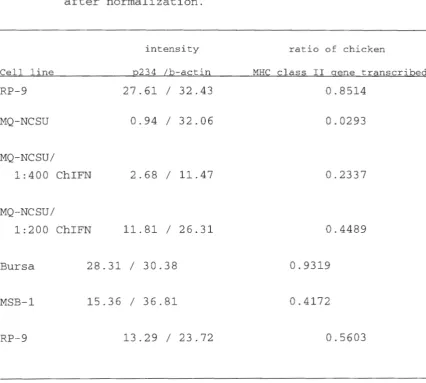
with Fuji medical X-ray film. The intensity of the detected
bands on the two autoradiograms were measured by an imaging
densitometer (Bio-Rad, Model GS-670). The abundancy of the
chicken MHC class II mRNA detected were normalized by
RESULTS
Flow cytometry
Optimum conditions for detection of chicken MHC class II surface antigen by flow cytometry analysis
A test (n=l) of flow cytometry analysis was conducted
using different concentration of Cia-1 monoclonal antibody
for labelling chicken MHC class II surface antigens on RP-9
cells. 97.9% of the cells in the suspension were labelled by
Cia-1, showing expression of chicken MHC class II surface
antigen. The result showed an increase of mean fluorescence
value at antibody dilutions of 1:25 to 1:400, which decreased
at the 1:800, and 1:1600 dilutions (Fig.2). Therefore, a
1:400 dilution of the monoclonal antibody was used for the
rest of the experiments.
Cell-specific expression of chicken MHC class II surface
antigen
The basal levels of chicken MHC class II expression were
measured in each cell line as a standard point for comparison
100
95
...
90
Q) .:
u
c
85
Q) u
Cf)
Q) ,_
0
80
~
LL c ro Q)
75
~
70
I
65
I
I
I .
~
60
1 /25
1 /50
1/100 1 /200 1 /400 1 /800 1
/1600
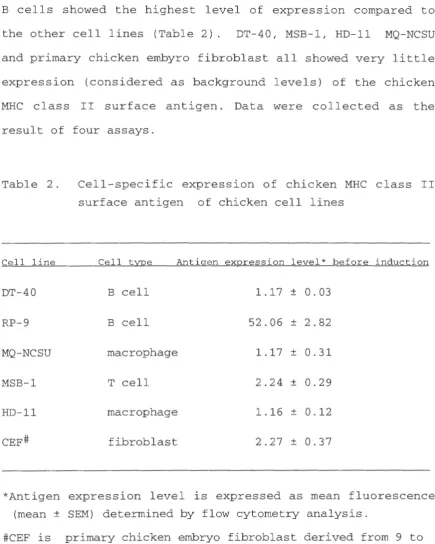
B cells showed the highest level of expression compared to
the other cell lines (Table 2). DT-40, MSB-1, HD-11 MQ-NCSU
and primary chicken embyro fibroblast all showed very little
expression (considered as background levels) of the chicken
MHC class II surface antigen. Data were collected as the
result of four assays.
Table 2.
Cell line
DT-40
RP-9
MQ-NCSU
MSB-1
HD-11
CEF#
Cell-specific expression of chicken MHC class II surf ace antigen of chicken cell lines
Cell type Antigen expression level* before induction
B cell 1.17 ± 0.03
B cell 52.06 ± 2.82
macrophage 1.17 ± 0.31
T cell 2.24 ± 0.29
macrophage 1.16 ± 0.12
fibroblast 2.27 ± 0.37
*Antigen expression level is expressed as mean fluorescence (mean ± SEM) determined by flow cytometry analysis.
[image:45.577.58.494.82.627.2]Induction of chicken MHC class II surface antigen by IFN-rich supernatant
No increase in chicken MHC class II surface antigen
expression was detected on MQ-NCSU when induction was carried
out for only 24 hours (Fig.3). The MQ-NCSU cells seemed to
have highest induction at 1:2000 dilution of p34(200) for 60
hours, but this was not statistically significant (p =
0.6316) Several points on the data were analysed by
Student's t-test to see if the observed results were
significantly different between IFN-induced groups and
un-induced groups. P values of 0.6653 (1:2000, 48 hr), 0.6316
(1:2000, 60 hr), 0.5841 (1:4000, 48hr), and 0.6789 (1:4000,
60hr) determined that the expressions were not significantly
different at all those dilution and hours points. An increase
in expression level (mean antigen per cell value) was
detected by a mean fluorescence shift, and a bimodal peak in
the mean fluorescence shift usually occurred after 60 hr of
incubation with IFN (Fig.4).
To understand if this time point was a reasonable
condition for further induction work, MSB-1 T cell culture
supernatant was used as a control of the p34(200) IFN-rich
supernatant. Supernatant which is free of Con A stimulation
were first passed through a 0.2 mm filter to get rid of dead
cells and waste products generated during cell culture and
5
0
-t-~-.-~--.-~~~~--.--J5
12
24
36
48
60
Hour
c
l
T
1
T
12
24
36
48
60
Hour
Q)
20
-u
c:
Q) ~
15
-Q)
l
-o
:::l~
10
-n:s Q)
~
5
-B
~
0
-t-~-.-, ~~,~~l~~...--1,5
12
24
36
48
60
Hour
D
12
24
36
48
60
on MQ-NCSU. Curve shift towards the right indicates
increase in chicken MHC class II expression. A. NO IFN at
60 hr. B. With IFN for 24 hr. C. With IFN for 36 hr. D.
Fluorescence
A
1000 Jog -.-IA-FITC
Fluorescence Fluorescence
1
)
It_
\
'
e-c-J
cs:>
~
n I pro I l l I'""' 11111:::-,!'l'\ll'i.i .. r\.111""
. 1 1000
log a-IA-FITC log a-IA-FITC
Fluorescence Fluorescence E
I \
t
~
l
I ~,~+,~~~fl--~-~
~L__,1.,W!T-.~11-.11-... ~,_;_"'-"'~' ~h~11,:
.1 1000 .1 1000
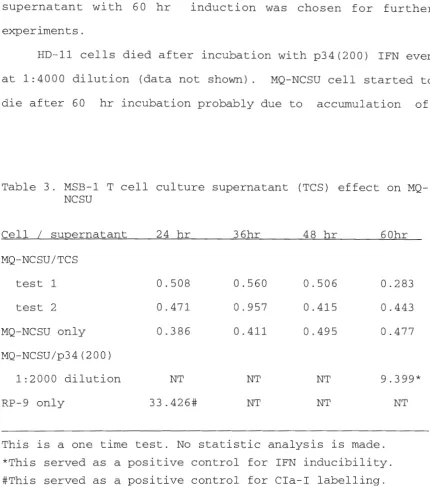
in the mean fluorescence value (Table 3). Therefore, at this point in the research, 1:2000 dilution of p34(200) IFN-rich supernatant with 60 hr induction was chosen for further experiments.
HD-11 cells died after incubation with p34(200) IFN even at 1:4000 dilution (data not shown). MQ-NCSU cell star ted to die after 60 hr incubation probably due to accumulation of
Table 3. MSB-1 T cell culture supernatant (TCS) effect on MQ-NCSU
Cell I supernatant 24 hr 36hr 48 hr 60hr MQ-NCSU/TCS
test 1 0.508 0.560 0.506 0.283 test 2 0.471 0.957 0.415 0.443 MQ-NCSU only 0.386 0.411 0.495 0.477 MQ-NCSU/p34(200)
1:2000 dilution NT NT NT 9.399*
RP-9 only 33.426# NT NT NT
[image:53.576.57.487.130.617.2]waste products produced by the cells. Also, any concentration
of IFN higher than the optimum dose led to increased cell
death (Fig.5)
MSB-1 cells were not induced by p34 IFN (Fig.6). Points
at which mean fluorescence level were slightly higher than
that of the average un-induced cells were analysed by the
Student's t-test. Expression of the MHC class II proteins was
not increased among any of the three groups (1:1000, 48 hr;
1:2000 48hr and 1:4000 24hr) and the uninduced MSB-1 cells,
(p
=
0.7892; p=
0.9597; p=
0.6317). The same analyses weremade on DT-40. Comparison of the effect of 1:1000 dilution of
p34(200) on DT-40 for 36 hour and uninduced DT-40 for 36 hr
indicated that the expression was weakly induced (p
=
0.0193)at this time point but fell at 48 hr time point (p
=
0.2243)(Fig.7). When RP-9 cells were incubated with p34 IFN, the
level of MHC class II protein expression was not increased
above the already high basal levels of expression at any IFN
concentration nor any time point (Fig.8). Points at which
mean fluorescence level were slightly higher than that of the
average uninduced RP-9 cells were analysed by the Student's
t-test. It was determined that MHC class II antigen level was
not induced at those points. (P values of 0.8850, 0.6636,
0.5009 and 0.7044 for 1:2000-48 hr, 1:2000-60 hr, 1:4000-48
hr and 1:4000-60 hr respectively).
In general, chicken MHC class II surface antigen level
to the right of the panel are dead cells stained with
Propidium Iodide. Percentage of cells alive is given
below each panel. Larger doses than optimum concentration
used for both p34(200) and recombinant ChIFN 5resulted in
more cell death. A. 60 hr, no IFN. B. 60 hr, optimum
p34(200) concentration. C. 60 hr, 2 fold amount of the
optimum concentration. D. 60 hr, optimum recombinant
ChIFN concentration. E. 60 hr, 2 fold amount of the
N
"'
.1
A
.•
Region ID
..,.
N
"'
.... B
U! ab! 11 ty
I
"'.<--.--~~~
I I l l l l l l·
~
•
11~11
11
~
1
~11=1111~
11
-,..,-n111
100~1
J
0.1
log PI
Regwn ID %
A 47.9
cs: .1
log PI
Re~1on ID %
A 45.9
A
Viability
log PI
.-J(
·· .. :::.., ..
%
71.9
.1
Region ID A
"' . 1
Region ID A
1000 I og PI
3 20.4
1000 log PI
expression level. Mean fluorescence (± SEM) determined
by flow cytometry analysis. A. No IFN. B. 1:1000
dilution of p34(200). C. 1:2000 dilution of p34(200). D.
1:4000 dilution of p34(200). Chicken MHC class II gene
expression was not effected by any concentration of
8 - , . . . - - - ,
7
a>(.) 6
c:::
a>
(.) 5
en
a>
0
4
::::::l
i;::
c:::
3
rn
a>
2
~
1
A
0
---+----,...---,----,---...,...--12
24
36
48
60
Hour
8
7
c
a> (.)
6
c::: a> (.)5
en a>I.-4
0 ::::::l i;::3
c::: rna>
2
~
1
0
I12
24
36
48
60
Hour
8
- , - - - ,
Q)
7
B
(.)
c:::
6
Q)
(.)
en
5
~
g
4
i;::
c:::
3
rn
~
2
~
1
0
-+--~-~-~--r-~12
24
36
48
60
Hour
8
7
D
a> (.)
6
c::: a> (.)5
en a>I.-4
0 ::::::l i;::c:::
3
rn
a>
2
~
1
0
12
24
36
48
60
expression level. Mean fluorescence (± SEM) determined
by flow cytometry analysis. Data without error bar were
single experiments. A. No IFN. B. 1:500 dilution of
p34(200). C. 1:1000 dilution of p34(200) . D. 1:2000
dilution of p34(200). E. 1:4000 dilution of p34(200) .
Chicken MHC class II gene expression was not effected by
7
7
~6
-
A
~6
B
r::: r:::
CD 5 -
CDS
(.) (.)
r.l'J
en
CD4
-
CD 4
' - '
-0 0
::J 3 -
::J3
t;:: t;::
~2
-
r+--+---.
C'O r:::2
CD
~1
~1
-0
I I I I0
12
24
36
48
60
12
24
36
48
60
Hour
Hour
7
7
CD6
c
CD6
D
(.) (.)
a3
5
a5
5
(.) (.)
~4
~4
'- '
-g3
g3
t;:: t;::
r:::
2
r:::2
ctl ctl
~1
~
1
0
0
12
24
36
48
60
12
24
36
48
60
Hour
Hour
7
I
~6
l
r:::
~
CD 5
(..)
en
CD4
'-~
0::J 3
t;::
I
I
r:::
2
I I•
·-·
•
ctl I
~
1
I-i
0
1
2
24
36
48
60
expression level. Mean fluorescence (± SEM) determined by flow cytometry analysis. A. No IFN. B. 1:2000 dilution
80
CD
70
A
f
f
f
(.)
!
c:
60
CD '
~50
CD040
:J
;:;::: 30
c
m2o
210
0
12
24
36
48
60
Hour
80
~
70
B
c CD
60
(.)
1
1
~
50
_L
"'-0 4"'-0
:J
;:;::: 30
§
20
~
10
0
12
24
36
48
60
Hour
CD
80
g
70
c
~60
I
T
!
T
~50
"'-!
l
040
1
:J;:;::: 30
I
@20
~
CD
10
2
0
12
24
36
48
60
B cells and non-expressing T cells. The surface antigen level
in MQ-NCSU seemed to be increased by this IFN, but was not
statistically significant. However, the surface antigen level
in DT-40 pre-B cells were weakly but significantly induced.
Induction of chicken MHC class II cell-surface antigen by recombinant chicken IFN
When recombinant chicken IFN (ChIFN) became available,
it was used to perform the assays because of its greater
purity and specificity. To determine the level of
recombinant ChIFN needed to induce MHC class II antigen
expression, the concentration of ChIFN that would give an
equivalent effect to p34(200) IFN-rich supernatant on MQ-NCSU
was first determined. It was found that a 1:2000 dilution of
the ChIFN had a similar effect as 1: 2000 dilution of
p34(200) (p = 0.5095) (Fig.9). This dilution point was then
used as a starting reference point to determine the optimum
IFN dilution for induction of the cells. It was found that
1:200 dilution of the CHIFN had a more profound effect of MHC
class II antigen induction on MQ-NCSU than 1:2000 p34(200) (p
=
0.02617). The same assay was performed with RP-9 and MSB-1,each chosen as representative of the B cell and T cell
categories of the immune cells. The RP-9 cells were not
inducible to even higher levels of MHC class II expression
IFN-rich supernatant on IFN-induced expressi on of MQ-NCSU at 24, 36, 48 and 60 hour intervals. A. No IFN. B. 1:2000 dilution of p34(200). C. 1:2000 dilution of the
recombinant chicken IFN. D. 1:200 dilution of the
recombinant chicken IFN. Results showed 1:200 dilution