Synthesis of the model of the socio-economic
system
Oleksandr Poliarus,*, Iryna Nazarenko2, Yevhen Poliakov1, Andrii Lebedynskyi1, and Sergii Ianushkevych1
1
Kharkiv National Automobile and Highway University, Department of metrology and life safety, 61000 Kharkiv, Ukraine
2Ukrainian State University of Railway Transport, Department of economics and management of industrial and commercial business, 61050 Kharkiv, Ukraine
Abstract. The identification of the socio-economic system, which includes the scientific and scientific-technical activities of Ukraine, using the three input and output signals, is carried out in the article. The synthesis of the model is based on the minimization of the functional, which is the distance in the functional space with the quadratic metric between the real output signal and the theoretical signal containing the unknown parameters of the system model. These parameters include the system time constant and the coefficients that describe the power transformation function of the nonlinear block. A comparison of real output signals and signals calculated using the linear model of the system with memory and the Hammerstein model for a nonlinear inertial model is carried out. It is shown that the errors of the output signals representation for the quadratic model are less than for the linear one and are different for various output signals. If these errors exceed the allowable ones, it is recommended to change the parameters of the model or the number of members of the power function of the nonlinear block transformation.
1 Introduction
In the VUCA world, the requirements for the quality of socio-economic systems models increase. The socio-economic system is a complex stochastic dynamic system that covers the processes of production, exchange, distribution and consumption of material and other goods.
Despite the existence of many simulation methods (econometric, neural networks, etc.), there is still no reliable method for obtaining a model of a socio-economic system based on its input and output data, which change over time. This process is a system identification. In this case, the system is represented as a "black box", due to the impossibility of considering the main influences on it from both higher-level systems and other systems that are in contact with it.
We will identify the socio-economic system, which includes the scientific and technical activities of Ukraine. For this system, according to [1], the change of input parameters only
*
after a certain period of time affects the dynamics of the output parameters, i.e., the system is inertial. Taking into account the resource indicators and indicators of the efficiency of science proposed in [1, p. 11; 2, p. 385; 3, p. 23], as well as features of the statistics of science in Ukraine, we have constructed the general model of the studied socio-economic system (Fig. 1).
Fig. 1. The general model of the socio-economic system under study
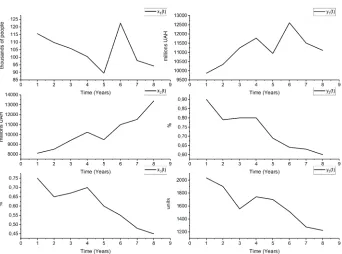
The actions or input signals come to the input of the system:
1( )
x t - the number of performers of scientific and technical works, thousand persons;
2( )
x t - costs of carrying out research and development (in current prices), mln. UAH;
3( )
x t - science-intensive gross domestic product (GDP), that is, the share of expenses for research and development in GDP,%.
The following signals are at the output of the system:
1( )
y t - the volume of performed scientific and technical works, UAH million;
2( )
y t - the share of the volume of performed scientific and scientific-technical works in GDP, %;
3( )
y t - the number of patents received for inventions (in the name of the national applicants), unit.
[image:2.482.91.437.142.223.2]The output data are given in Table 1.
Table 1. Output data (by [4] and earlier collections)
Years x1(t),
thousand people
x 2(t), mln. UAH
x 3(t),
%
y1(t), mln. UAH
y2(t),
%
y3(t), units
2010 115.6 8107.1 0.75 9867.1 0.90 2,034
2011 109.8 8513.4 0.65 10349.9 0.79 1,902
2012 105.9 9419.9 0.67 11252.7 0.80 1,557
2013 100.5 10248.5 0.70 11781.1 0.80 1,743
2014 89.5 9487.5 0.60 10950.7 0.69 1,701
2015 122.5 11003.6 0.55 12611.0 0.64 1,516
2016 97.9 11530.7 0.48 11516.5* 0.63* 1,277
2017 94.3 13379.3 0.45 11120.4* 0.6* 1,224
Note: * forecast (in the absence of statistical data due to changes in statistical reporting forms)
The graphs of time functions describing the behavior of input and output signals are shown in Fig. 2.
x 1(t)
x 2(t)
Socio-economic system “scientific and technical activity in Ukraine”
Influence of the system of the higherlevel - thestate
x 3(t) y1(t)
y2(t)
y3(t)
, 0 (2019) https://doi.org/10.1051/shsconf /20196706041
67
SHS Web of Conferences
NTI-UkrSURT 2019
Fig. 2. The example of input and output signals of the socio-economic model
2 Construction of a model
It is convenient for the researcher to use the simplest models of socio-economic systems that adequately describe their behavior. First of all, we assume that the model of the socio-economic system is linear, and after its testing it is possible to switch to more complex models, if significant defects of the model are revealed. For a linear model, the relationship between the vector of input signals x tr( ) and the vector of output signals y tr( ) is determined by the dependence
( ) ( ) ( ), y t = Ht x t
r r
(1) or in expanded form
1 11 12 13 1
2 21 22 23 2
3 31 32 33 3
( ) ( ) ( ) ( ) ( )
( ) ( ) ( ) ( ) ( ) ,
( ) ( ) ( ) ( ) ( )
y t h t h t h t x t
y t h t h t h t x t
y t h t h t h t x t
ж чц ж цжч цч
з ч з чз ч
з ч з чз ч
з ч=з чз ч
з ч з чз ч
з ч з чз ч
з чч з ччз чч
з з з
и ш и ши ш
where H( )t is matrix operator whose elements are pulse characteristics or pulse responsesh tij( ) ( ,i j=1,, i.e., the reaction of the system on d-impulse, and for
simulation conditions, this is the reaction of the system y ti( ) at the i output on the pulse action at the jinput. Consequently, at i output of the system using equation (1) we have:
1 1 2 2 3 3
( ) ( ) ( ) ( ) ( ) ( ) ( ).
i i i i
y t = h t x t +h t x t +h t x t (2)
[image:3.482.71.413.66.320.2]( ) ij, t ij ij ij A
h t e t
t
-= (3)
where Aij,tijare amplitude of the pulse characteristic and the system's time constant
respectively.
Then expression (2), using the equation of convolution, is transformed to form
2 3
1 1 2 2 3 3
( ) ij ( ) i ( ) i ( ) ,
t t t
i i i i
y t e x d e x d e x d
t t t
t t t
h t t h t t h t t
- -
-Ґ - Ґ - Ґ
-- Ґ - Ґ - Ґ
=
т
+т
+т
(4)where
t
is a time shift in the convolution equation.The solution of the equation (4) is carried out by the method of global random search (genetic algorithm), minimizing the functional
2
[ ( ) ( )] .
i i i
J y t m t dt
Ґ
- Ґ
=
т
- (5)where mi( )t is the right-hand side of equation (4) and depends on tij and hij
which are determined by global random search.
If the modulus of the average difference between y ti( ) and mi( )t at the final stage of
operation of the genetic algorithm exceeds the established threshold, then a linear model can be considered as an inadequate one, because it describes the connection between the input and the output of the system (Fig. 1) incorrectly. In this case, the Hammerstein model has the advantage and it virtually represents the system in the form of two consecutive blocks: nonlinear non-inertial and linear inertial. To evaluate the nonlinear properties of the system, we described a nonlinear block by a power (quadratic) function, for example, and then expression (2) has been transformed to the following form
1 1 1
2 2 2
3 3 3
2
10 11 12
2
20 21 22
2
30 31 32
( ) ( ) ( ) ( ) ( ) ( )
( ) ( ) ( ) ( ) ( )
( ) ( ) ( ) ( )
i i i i
i i i
i i i
i i i
i i i
i i i
y t a h t d a x t h t d a x t h t d
a h t d a x t h t d a x t h t d
a h t d a x t h t d a x t h
(t )d.
(6)
In the equation (6) there are 9 unknown coefficients aimk ( ,m k = 0,1, of power
function, which are determined by minimizing the functional (5), but in this case mi( )t is the right-hand side of the relation (6). These coefficients can be further specified, as well as the parameters of the system pulse characteristics (Fig. 1), if they are considered unknown, but the average value is presented through previously calculated parameters and coefficients. We restrict ourselves to previously obtained results.
3 The results of modeling
Figure 3 shows the dependence y ti( ) at the first input when i1. The calculation is
carried out both for the linear model of the system, and for the nonlinear one. In Fig. 3 the real signal at the first input of the system is also given.
, 0 (2019) https://doi.org/10.1051/shsconf /20196706041
67
SHS Web of Conferences
NTI-UkrSURT 2019
Fig. 3. Real and model signals on the first output of the system
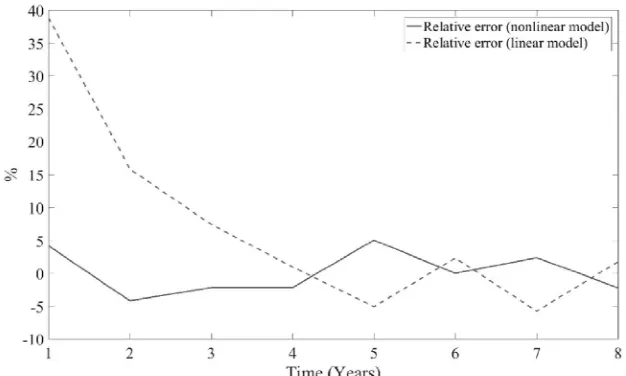
[image:5.482.79.402.73.266.2]The difference between the real signals and those calculated using linear and nonlinear models has been considered as the error. The graph of the relative error of output signal representation for two models is shown in Fig. 4.
Fig. 4. The relative errors of signal representation at the first output for two models: dashed
line – linear model, solid line – nonlinear one
[image:5.482.85.398.324.512.2]obtained in mathematical modeling, are qualitatively similar to the results of the study of the measuring pressure channel [6], and the latter are confirmed experimentally.
4 Conclusions
1. The developed model of socio-economic system describes the nonlinear and inertial properties of the system and allows determining the output dependencies with known input ones.
2. Errors of model output signals compared to real ones are equal to several percent at all outputs, but at some moments of time they reach 20 - 30%.
3. Considering the nonlinear properties of the system leads to a reduction of these errors several times at the first output and 5-10% at the third output, but in the second output the error, on the contrary, increases. This indicates that it is not always necessary to use the Hammerstein model and its first nonlinear block.
4. The given errors can be reduced by repeated application of the genetic algorithm together with changes of the model parameters. To create a better model you need to have a wide range of experimental data.
5. The obtained model must be tested on other experimental samples. It should be expected that the model may be unique, that is, fair only for Ukraine. The method itself is suitable for any socio-economic systems that are similar to the system studied in the article.
References
1. A. V. Todosiichuk. Science as a factor of social progress and economic growth. 2nd edition, supplemented and revised. Moscow, 2005 [Electronic source]. - Available at: https://docplayer.ru/26309550-A-v-todosiychuk-nauka-kak-faktor-socialnogo-progressa-i-ekonomicheskogo-rosta.html
2. M. Arkhipova, V. Vlasova. Monitoring and modeling of the main trends in the development of scientific activities in Russia. Economics, statistics and informatics, 2014, 6(2), 384-389 [Electronic source]. - Available at:
https://cyberleninka.ru/article/n/monitoring-i-modelirovanie-osnovnyh-tendentsiy-razvitiya-nauchnoy-deyatelnosti-v-rossii.
3. A. Burda. Fundamentals of research (lecture course), Krasnodar, 2015 [Electronic
source]. - Available at:
https://kubsau.ru/upload/iblock/40f/40f35535e069a955ca6fc10d13d484b7.pdf 4. Scientific and innovation activity of Ukraine: Statistical collection, Kyiv, 2018
[Electronic source]. - Available at:
http://www.ukrstat.gov.ua/druk/publicat/kat_u/2018/zb/09/zb_nauka_2017.pdf
5. O. V. Poliarus, Y. O. Poliakov, I. L. Nazarenko, Y. T. Borovyk, M. V. Kondratiuk. Detection of Jumps Parameters in Economic Processes (on the example of modelling profitability). International Journal of Engineering & Technology, 7, No 4.3, р. 488-496, [Electronic source]. - Available at: https://docplayer.ru/26309550- A-v-todosiychuk-nauka-kak-faktor-socialnogo-progressa-i-ekonomicheskogo-rosta.html
6. O. Poliarus, O. Koval, Ya. Medvedovska, Ye. Poliakov, S. Ianushkevych. Identification of a nonlinear inertial measuring pressure channel. - Ukrainian Metrological Journal, 2019, №1, р. 63-70.
, 0 (2019) https://doi.org/10.1051/shsconf /20196706041
67
SHS Web of Conferences
NTI-UkrSURT 2019
![Table 1. Output data (by [4] and earlier collections)](https://thumb-us.123doks.com/thumbv2/123dok_us/8243586.272653/2.482.91.437.142.223/table-output-data-earlier-collections.webp)