Abstract: Stock price prediction is always a most challenging task. Artificial Neural Network prediction clears the stock price prediction challenge by forming the training set. By using the past information as the network input, one can predict the expected output of the network. In order to predict the expected result as the accurate we add multi-layer perceptron to the knowledge set we formed from the past historical data available in the nifty NSE and Sensex BSE. This paper proves that proposing the learning knowledge set using multilayer neural network will predict the accurate closing price of future stock in stock market.
Keywords: Artificial Neural Network (ANN), Knowledge set, Multilayer neural perceptron network, stock market.
1. INTRODUCTION
In stock market, the identification of expected loss and profit is used for buying or selling a stock. Always the person in the stock market tries to make preventive measure with the help of the parameter feature related to the stock price. Historical data like open price, high price and low-price are used to identify the behavior of stock. The usage of these historical details creates high degree of accuracy in the prediction in stock market. In this paper we will work with these historical features of stock price by using multilayer neural perceptron network to predict the closing price of the stock.
A. Stock market
Stock market offers the investors to a public sale to buy or sell the stocks. Stock market is also known as the exchanges of regular activities including insurance of shares. Stock market, stock trading and stock exchange are some of the terms used interchangeably. Investors need low rick in stock investment. The investors mostly use diversified investment which has lower risk. To get huge financial capital
Revised Manuscript Received on September 22, 2019.
G.Sundar, Research Scholar, Bharath University, Chennai, [email protected].
Dr.K.Satyanarayana, Research Supervisor, Bharath University, Chennai.Principal & Prof, Dept. of Computer Science, Sindhi College, Chennai.
companies are used to sell the stocks. Individuals are also use the stock market to gain returns and outpace of their investments. The investment occurs in stock market only if the investors believe that the economy is growing. If the investors think that the economy is unmoving or frozen then they are not invest in stock. Nowadays any one can possibly purchase the stock in online.
Stock market is acts as primary market as well as secondary markets. The company which offers their share for first time for selling or buying is known as primary market. The regular buying and selling of the listed shares of the company in the stock exchange is known as secondary market. Both the primary and secondary stock market performs the trading execution at a fair price to the mutual buyers and sellers. There are two free-float market weighted stock index known as NIFTY 50 and BSE SENSEX.
The NIFTY 50 index is National Stock Exchange of India’s benchmark based stock market index for the Indian equality market. Full form the NIFTY is National Stock Exchange Fifty. It represents the weighted average of 50 Indian company stocks in 13 sectors. It is one of the two main stock indices used in India. The BSE SENSEX is the S&P Bombay Stock Exchange Sensitive Index or simply the SENSEX. It includes 30 company stocks in 13 sectors. Some of the sectors are shipping, banking, automobile, financial services, telecommunication, oil & gas, pharmaceuticals, metals, consumer goods, cement, information technology, metals, chemicals and media & entertainment.
B. Artificial Neural Network
ANN has been applied in many different domains with success. ANN follows generalization ability on a learned base of examples. Several methods of ANN have been designed to explicit their knowledge in a symbolic form. ANN is used to form the basis of empirical learning. ANN has been proven to be equal or superior to empirical learning systems over a wide range of domains. Empirical learning means generalize specific
theoretical knowledge about the problem domain.
Multi Layer Feed Forward Neural Network
Knowledge Base to Future Stock Market
Multi Layer Feed Forward Neural Network Knowledge Base to Future Stock Market Prediction
ANN used to make the assumptions about the functional dependencies between the input and output. ANN is a method of finding the relevant weights with the number of thresholds required for computation. The training of neural network is done by the investigation of the historical data. The training data selection is a critical task.
II. STANDARD STOCK KNOWLEDGE SYSTEM
Knowledge is a communication progression between the learner and the surroundings. The learner receives information from the surroundings, and processes the information to form knowledge. The learner uses this learned knowledge to help in making decisions and in solving problems. The performance of problem solving will feed back to the learner. This process occurs iteratively and continues until the knowledge gained. The surroundings serves as a stimulus to the learner, and the level and quality of information affect the strategy of learning. Generally, there are three main learning paradigms: supervised, semi-supervised, and unsupervised learning. The goal of the learning is to generate the regularities from the training set of input patterns. Among these three learning paradigms, although the level and quality of information from the environment vary, they share with one common learning strategy that learning comes passively from the environment.
Diagram 1 Typical Standard Stock Knowledge System model
The above Diagram 1 shows a typical knowledge set model. The typical system model of standard stock knowledge consists of the five necessary elements. All these elements are used to form the expected output from the historical data. The standard stock knowledge elements are
Learning element Knowledge Base
Performance neuron element Feedback elements
Standard knowledge system
B. Learning Element
It receives and processes the input obtained from past history. Learning technique is a process which is used for the making of learning element. It is also necessary for building the blocks of all Artificial Neural Network model based solution. It receives and processes the input obtained from past historical data. Learning method is used to form a new patterns or approaches which is entirely different from the existing methods. Using learning technique observations are formed from the past details of the system. This learning improves the knowledge defined by ANN technique. This is best in multi-layer perceptron class problems. The understanding of the problem is done by using this multi-layer function. Usually stock market problems are divided by fundamental analysis problems and technical analysis problems. Analysing of company’s future profitability with the help of its business environment and financial performance is known as fundamental analysis. Identifying the trends of stock market with the help of understanding the statistical charts is known as technical analysis problems. The learning element in this paper includes the analysis of the historical data which focus on the technical analysis. The learning elements of stock market prediction are date, open, high, low, and close.
Multilayer neural networks are made up of three or more layers. This network has more than one hidden layer between the input nodes and output nodes. The structure is shown in the below diagram 2.
Diagram 2 Multi-layer neural networks
In MLNN signals are travelled in both directions. This network introduces loops. This method is also known as interactive network. This network also has 3 major groups of layers. Input layers hidden layers and output layers. Input layers are used to represent the data, which is to be fed into the network. The one hidden layer
the connections between input and weights and hidden layers. These may be more the one hidden layer depending upon the network. The final layer is output layer which is used to represent the output unit depend on weights given between hidden layers.
C. Knowledge base
This is similar to data base. It may contain some basic initial knowledge. It receives more knowledge which may be new and so be added as it or it may replace the existing knowledge. Knowledge is a set mainly used for forming a statement about the future prediction. In scientific work observations and evidences are used to form a quantitative statement about the knowledge set. In this paper knowledge base of stock market is obtained by using artificial neural network technique. Knowledge base is formed for grouping the label from raw historical data. This is also used to identify the patterns in the data like numeric, string, or vector. Neural network is used identify these grouping label to identify the input layers for prediction. These labeled data are used to form training data set. This knowledge base is used to maps the inputs to outputs. The knowledge base is formed by using multi-layer perceptron. The layers are made of various nodes. These nodes are used to combines the data with a set of coefficients known as input layers. All these input layers are used to form the activation function to determine the progress of the network to form the outcome known as knowledge base of classification. This is passed as the signals to neuron in order to activate the function used in the network. The depth of the multi-layer perceptron neural network defines the node layers through which the data pass in to the pattern identification process. Hierarchical structure is formed to abstract the increasing complexity to handle the high-dimensional data set passed through the activation function. Artificial neural network has multi-layer perceptron which is best for discovering the hidden structures within the historical data. Knowledge base is formed using pattern learning in stock historical data to extract necessary features like date, open price, close price, high price, low price and volume. By using neural networks one learns and recognizes the relation between certain necessary features and optimal outcome. Diagram 3 describes the basis for prediction used from the knowledge base set.
Diagram 3 General structure of Knowledge base
The knowledge base is formed by using the independent learning elements with the corresponding related weights.
(1)
Here is the knowledge base of the neural network formed. ,,… are the independent learning elements and … are the weights related to the elements. In this stock prediction problem we have date as the independent learning elements.
D. Performance element
It uses the updated knowledge base to perform some tasks or solves some problems and produces the corresponding output. The performance element in our study is stock market. All patterns are depends on labeled datasets. Artificial neural network is used to learn the patterns between the labels and the data. The label which is used to generate the output of the data is used to train the neural network. The performance element is found by grouping of label in the data by detecting relationships between them. The predictive analysis is done to evaluate the performance element. The performance element of the future stock prediction is done by determining the closing price of a stock for the day. The closing price is also known as the target variable.
Generally the performance element is formed by generating neuron. The neuron generation is the beginning of the artificial neural network. It is the basic building block of brain. It is a simplified form of numerical processing unit. All neurons are inter-connected and operating in parallel. Each neuron takes input value from other neurons and transfers it as the function and sends it on to the next layer like cascading till it reach the output. ANN is developed to attempt to simulate human brain. The major key point of ANN is information processing. Neuron is helped to inter-connect the working of
Multi Layer Feed Forward Neural Network Knowledge Base to Future Stock Market Prediction
performance is described using the Diagram 4.
Diagram 4 Performance element of neural network
The closing price is predicted by using the moving average formula of multi-layer perceptron which uses the latest prediction of each data set. The data set is fragmented into train and validated set. In this paper we use last year data into fragmentation. Heuristics technique is used for processing the learning element. In the paper we form the learning element for the stock market prediction. The evaluation function for creating learning element for stock using heuristic function is denoted as “Y”. The performance element from the learning element is formed using the formula
Y = (2)
Where network are weights and are input attributes used in the function.Heuristic function is used for selecting best form the available set.
E. Feedback element
It has two inputs one from the learning system and another from standard system. The feedback system is used to determine what should be done in order to produce the correct output. In this paper a neural net is used to arrive with least error. The weights are collected and the start or end states are attempts to model data’s relationship. Neural networks are always accepting the ignorance. The weights and biases are not known clearly in neural network. It is always starts with the presumption and makes the better presumptions in sequential manner as it learns from mistakes.
The feedback element assumption with the network input and weight is defined as
assumption = input * weight
F. Standard Knowledge System
It is a trained person or a computer program that is able to produce the correct output. In order to check whether the system has learned well, the same input is given to the standard system. The outputs of the standard knowledge system and the performance element are given as input to the feedback element to form idealized system.
The sequence of the operation is repeated until the system gets desired perfection. The knowledge system is formed by using the activation function. The activation function determines the output node by fixing the inputs. The activation function is set at all the layer levels. Generally logistic regression function is used in the multi-layer perceptron neural network model knowledge system. This neural network includes many layers like input layers, hidden layers and output layers. Each of the output neural network nodes produces two possible outcomes in binary form known as 0 or 1. The logistic regression function is used to the conversion of the continuous parameter value into the binary output.
III. BUILDING THE MULTI-LAYER NEURAL NETWORK MODEL
First import the data from the historical data to CSV (comma-separated value) file. The construction of stock prediction model using multi-layer neural network has inputs like, date, open price, high price and low price. The linear regression is used in the single-layer network formation. The simplest form of the linear regression is expressed as, (3)
Where ‘Y’ is the estimated output, X is the input, m is the slope and b is the intercept of the vertical axis. This is extended up to multiple linear regressions, which has many input variables to produce one output. The output form is expressed as,
(4)
The above equation is used to form the multiple linear regressions at every node of the multi-layer neural network. In this network the previous layer is again pooled with the input from every other node.
In general the multi-layer neural network is represented as using the neurons in a hidden layer in feature detectors. This is used to detect feature in historical input data. It is used to combine all input to the output. The common rule is
Y = ∑ (weight * input) + bias (5)
This hybrid proportion with respect to the subsequent layer combinations are used to the error. The training set is used to form feature related to prediction. This is used to specify of modify weights between nodes. There is no specific way or method to choose bias value. It is randomly or chosen by the designer. Training set is formed
about stock. Then the network is given as input and processed to produce resultant output. In training set a detailed study of past data performance value are loaded as pattern to form general behavior pattern. The future value is drawn by screening the data references in loaded past pattern. The accuracy of prediction is depend on the analytical method used to predict. Data for the month of January for 7 years are taken as training set.
The training is done by using pattern learning method. The data of previous 7 years are used as inputs. The daily price value is given to the network. The network made used to predict the next value in order.
MSE = 1/nn∑1 = 1 (y1 - i)
2
(6)
IV. IMPLEMENTATION OF MULTI-LAYER FEED FORWARD NEURAL NETWORK
We construct the model which has four inputs (date, open price, high price, low price ) and one output neuron (closing price) and 30 hidden layers of neurons for each. The hidden layer uses the tanH activation function.
(7)
The multi-layer networks are formed using the tanH sigmoid function defined in the equation (7). The network described by the knowledge base equation set is shown in the diagram
This diagram explains multi-layer network with three input layers, 30 hidden layers and one output layers.
Diagram 5 Multi-layer feed forward network for stock market prediction
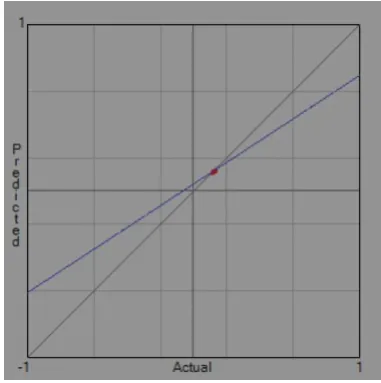
Regression line is formed to check the optimality of the network using linear function. This is described in the Diagram 5. The diagram shows the performance plot of the actual and predicted results of the BSE from 2015 to 2018.
Diagram 6 Performance plot of Multi-layer feed forward stock prediction
V. OUTPUT
[image:5.595.330.521.50.242.2]This section explains the details about the training set and the training set taken from the BSE stock exchange. The training set is taken from the BSE stock exchange from date 2-nov-2015 to 19-Apr-16.Totally 136 data is chosen for testing data.
Table 1 Training data for stock prediction using Multi-layer feed forward network
S.no. Date Open High Low Close Volume
1 19-Apr-16 111.1 112.45 109.16 112.29 30147644
2 18-Apr-16 109.74 110.81 109.2 110.45 21092654
3 15-Apr-16 110.79 110.97 109.2 109.64 20763396
4 14-Apr-16 110.62 112.04 110.26 110.84 28430914
5 13-Apr-16 112.23 112.65 106.52 110.51 88113011
6 12-Apr-16 109.34 111.16 108.99 110.61 26175943
7 11-Apr-16 110.7 110.91 108.77 108.99 39563863
8 8-Apr-16 114.25 114.33 109.9 110.63 48424776
9 7-Apr-16 113.79 114.89 113.07 113.64 20324759
Multi Layer Feed Forward Neural Network Knowledge Base to Future Stock Market Prediction
11 5-Apr-16 112.11 113.32 111.9 112.22 22752484
12 4-Apr-16 114.07 114.55 111.61 112.55 48382180
13 1-Apr-16 113.75 116.17 113.35 116.06 24725954
14 31-Mar-17 114.7 115.01 113.77 114.1 21138743
15 30-Mar-16 116.73 116.99 114.36 114.7 33180317
16 29-Mar-16 113.83 116.32 113.64 116.14 29765753
17 28-Mar-16 113.32 114.59 112.95 113.69 21312750
18 24-Mar-16 112.13 113.09 111.68 113.05 17063766
19 23-Mar-16 112.01 113.19 112 112.54 18468742
20 22-Mar-16 111.36 112.88 111.17 112.25 18957831
21 21-Mar-16 111.66 112.37 111.03 111.85 18394520
22 18-Mar-16 111.56 112.42 110.27 111.45 36216958
23 17-Mar-16 112.15 112.69 110.73 111.02 24204773
24 16-Mar-16 110.49 112.5 110.1 112.18 24619730
25 15-Mar-16 109.11 110.83 108.84 110.67 17618460
26 14-Mar-16 109.28 110.33 108.77 109.89 17236054
27 11-Mar-16 108.48 109.42 107.92 109.41 20581320
28 10-Mar-16 107.91 108.66 105.77 107.32 24780710
29 9-Mar-16 106.7 107.51 105.49 107.51 20449881
30 8-Mar-16 104.78 107.37 104.4 105.93 25493546
31 7-Mar-16 108.07 108.07 104.72 105.73 31436401
32 4-Mar-16 110.05 110.05 107.93 108.39 24872895
33 3-Mar-16 110.25 110.3 108.54 109.58 21333496
34 2-Mar-16 109.68 110.55 108.77 109.95 25641627
35 1-Mar-16 107.83 109.82 107.6 109.82 26694696
36 2/29/2017 107.6 108.91 106.75 106.92 32243645
37 26-Feb-16 108.7 109.45 107.16 107.92 26578891
38 25-Feb-16 107.11 108.07 105.61 108.07 29796180
39 24-Feb-16 104.21 106.95 102.74 106.88 34239396
40 23-Feb-16 106.85 107.47 105.12 105.46 25204873
41 22-Feb-16 105.49 108.25 105.34 107.16 35630883
42 19-Feb-16 102.55 105.02 102.06 104.57 32337444
43 18-Feb-16 105.8 106 103.03 103.47 29374587
44 17-Feb-16 101.94 105.72 100.4 105.2 43852623
45 16-Feb-16 103.8 103.93 100.24 101.61 45438324
46 12-Feb-16 103.74 104.24 101.09 102.01 36038104
47 11-Feb-16 99.6 105.11 98.88 101.91 43493102
48 10-Feb-16 101.55 103.25 100.24 101 44943948
49 9-Feb-16 97.14 102.4 96.82 99.54 62580050
50 8-Feb-16 100.41 102.68 97.46 99.75 71016537
51 5-Feb-16 109.51 109.58 103.18 104.07 76522716
52 4-Feb-16 111.8 111.94 109.25 110.49 38648485
53 3-Feb-16 115.27 115.34 109.75 112.69 56848084
54 2-Feb-16 114.8 117.59 113.2 114.61 59644925
55 1-Feb-16 112.27 115.72 112.01 115.09 45840867
56 29-Jan-17 108.99 112.84 108.84 112.21 62357459
57 28-Jan-16 107.2 110.34 104.81 109.11 1.07E+08
58 27-Jan-16 97.79 97.85 94.23 94.45 48311872
59 26-Jan-16 97.76 97.88 95.66 97.34 26637412
60 25-Jan-16 98.72 99.48 96.93 97.01 32319141
61 22-Jan-16 96.41 98.07 95.49 97.94 30331442
62 21-Jan-16 94.91 95.99 92.62 94.16 30468830
64 19-Jan-16 96.53 97.42 93.92 95.26 30620565
65 15-Jan-16 93.98 96.38 93.54 94.97 45935550
66 14-Jan-16 95.85 98.87 92.45 98.37 48488509
67 13-Jan-16 100.58 100.58 95.21 95.44 33091576
68 12-Jan-16 99 99.96 97.55 99.37 28395390
69 11-Jan-16 97.91 98.6 95.39 97.51 29932385
70 8-Jan-16 99.88 100.5 97.03 97.33 35402298
71 7-Jan-16 100.5 101.43 97.3 97.92 45172906
72 6-Jan-16 101.13 103.77 100.9 102.97 25096183
73 5-Jan-16 102.89 103.71 101.66 102.73 23258238
74 4-Jan-16 101.95 102.24 99.75 102.22 37717312
75 31-Dec-17 106 106.17 104.62 104.66 18391064
76 30-Dec-15 107 107.25 106.06 106.22 13115007
77 29-Dec-15 106.42 107.74 106.25 107.26 17179901
78 28-Dec-16 105.02 105.98 104.53 105.93 13069733
79 24-Dec-15 104.74 105.32 104.5 105.02 6512134
80 23-Dec-15 105.89 106.11 103.86 104.63 19599673
81 22-Dec-15 105.22 105.66 104.81 105.51 14597122
82 21-Dec-15 104.91 105.15 103.6 104.77 16138786
83 18-Dec-15 106.08 106.59 103.97 104.04 35994199
84 17-Dec-15 107.49 107.75 106.13 106.22 21675686
85 16-Dec-15 105.37 107.09 104.19 106.79 22680547
86 15-Dec-15 105.3 105.8 104.28 104.55 21764331
87 14-Dec-15 102.28 104.74 101.46 104.66 24648093
88 11-Dec-15 104.15 104.34 101.91 102.12 26427727
89 10-Dec-15 105.05 106.4 104.41 105.42 17454312
90 9-Dec-15 106.18 106.44 103.55 104.6 23517268
91 8-Dec-15 104 106.91 103.95 106.49 20401791
92 7-Dec-15 106.48 106.83 104.66 105.61 15474890
93 4-Dec-15 104.75 107.73 104.11 106.18 21224721
94 3-Dec-15 103.95 106.85 103.35 104.38 23236485
95 2-Dec-15 107 107.92 105.79 106.07 24295162
96 1-Dec-15 104.83 107.15 104.5 107.12 22715616
97 30-Nov-15 105.84 106.1 103.75 104.24 20008996
98 27-Nov-15 105.78 105.96 104.86 105.45 5912671
99 25-Nov-15 106.33 106.6 105.1 105.41 15150785
100 24-Nov-15 106 106.49 104.39 105.74 23462829
101 23-Nov-15 107.19 107.47 106.08 106.95 19733283
102 20-Nov-15 106.84 107.87 106.62 107.32 22085405
103 19-Nov-15 107.36 107.73 105.95 106.26 25477683
104 18-Nov-15 105.8 107.88 105.39 107.77 23679764
105 17-Nov-15 104.62 106.2 104.14 105.13 26649223
106 16-Nov-15 103.32 104.17 100.47 104.04 49140589
107 13-Nov-15 107.71 108.25 103.83 103.95 29438853
108 12-Nov-15 108.48 109.39 108 108.02 20763843
109 11-Nov-15 108.27 109.87 107.11 109.01 25003046
110 10-Nov-15 106.17 108.15 105.24 107.91 24409940
111 9-Nov-15 107 108.25 105.86 106.49 26326885
112 6-Nov-15 108.04 108.74 105.91 107.1 34898019
113 5-Nov-15 108.8 110.65 107.95 108.76 63013501
114 4-Nov-15 103.19 104.14 102.48 103.94 38606400
115 3-Nov-15 103.22 103.65 102.4 102.58 21096752
116 2-Nov-15 101.72 103.47 101.18 103.31 23876266
Multi Layer Feed Forward Neural Network Knowledge Base to Future Stock Market Prediction
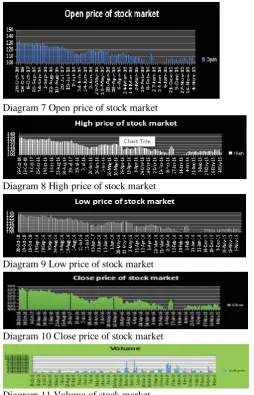
016. This testing set is defined in Table2. Totally 135 data with open, high, low, close and volumes are taken from the historical data. The R statistical tool is used to find the predicted value for the closing price and the corresponding error are measured using equation (6). The actual value, predicted value and the errors are displayed in the Table 3. The various stock predictions input historical data from BSE stock exchange with their corresponding plots are described in the following charts from diagram 7 to diagram 11. The plots are describing the values of open, high, low, close and volume. The diagram 12 shows the whole historical data with respect to the corresponding date.
Diagram 7 Open price of stock market
Diagram 8 High price of stock market
Diagram 9 Low price of stock market
Diagram 10 Close price of stock market
Diagram 11 Volume of stock market
The stock market input layers like open, high and low with the output layer closing price is described by the following performance chart.
[image:8.595.44.299.236.632.2]Diagram 12 Volume of stock market
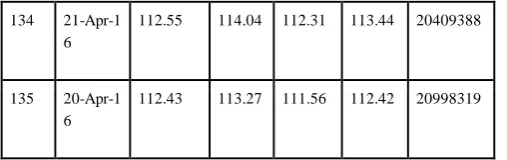
Table 2: Testing data for stock prediction using Multi-layer feed forward network
S.no. Date Open High Low Close Volume
1 28-Oct-1
8
130.5 132.97 129.93 131.29 24545547
2 27-Oct-1
8
131.74 131.8 129.27 129.69 16741393
3 26-Oct-1
8
131.64t 132.26 130.94 131.04 13084731
4 25-Oct-1
8
133.5 133.5 132.22 132.29 13336787
5 24-Oct-1
8
132.72 133.4 132.15 133.28 17470227
6 21-Oct-1
8
129.78 132.13 129.7 132.07 19088794
7 20-Oct-1
8
130.07 130.66 129.5 130 13167503
8 19-Oct-1
8
128.74 130.47 128.6 130.11 16752321
9 18-Oct-1
8
128.68 129.39 128.01 128.57 13503967
10 17-Oct-1
8
128.2 128.47 127.32 127.54 11351681
11 14-Oct-1
8
128.49 128.95 127.58 127.88 13345292
12 13-Oct-1
8
128.21 128.25 126.75 127.82 17139306
13 12-Oct-1
8
129.01 129.66 128.46 129.05 11072991
14 11-Oct-1
8
130.23 130.64 128.23 128.88 17537928
15 10-Oct-1
8
129.68 130.7 129.2 130.24 15138720
16 7-Oct-17 129.04 129.25 128.33 128.99 12804420
18 5-Oct-17 128.25 128.8 127.83 128.47 12386753
19 4-Oct-17 129.17 129.28 127.55 128.19 14307548
20 3-Oct-17 128.38 129.09 127.8 128.77 13156943
21 30-Sep-1
7
128.03 128.59 127.45 128.27 18402945
22 29-Sep-1
6
129.18 129.29 127.55 128.09 14532241
23 28-Sep-1
6
129.21 129.47 128.4 129.23 12047636
24 27-Sep-1
6
127.61 129.01 127.43 128.69 15637111
25 26-Sep-1
6
127.37 128.16 126.8 127.31 15064940
26 23-Sep-1
6
127.56 128.6 127.3 127.96 28326266
27 22-Sep-1
6
130.5 130.73 129.56 130.08 15538307
28 21-Sep-1
6
129.13 130 128.39 129.94 14068336
29 20-Sep-1
6
128.65 129.17 128.03 128.64 11083808
30 19-Sep-1
6
129.91 129.94 128.26 128.65 14958794
31 16-Sep-1
6
128.2 129.18 128.2 129.07 24119174
32 15-Sep-1
6
127.98 129.1 127.67 128.35 15111838
33 14-Sep-1
6
126.89 128.8 126.89 127.77 15720388
34 13-Sep-1
6
128.03 128.35 126.66 127.21 18016152
35 12-Sep-1
6
125.96 128.76 125.75 128.69 21252752
36 9-Sep-16 129.71 129.95 127.1 127.1 27100679
37 8-Sep-16 130.92 131.08 129.81 130.27 15676595
38 7-Sep-16 130.04 131.98 129.95 131.05 27990796
39 6-Sep-16 126.67 129.94 126.47 129.73 26278407
40 2-Sep-16 126.85 126.86 126 126.51 12118773
41 1-Sep-16 126.38 126.63 125.6 126.17 13536125
42
31-Aug-17
125.6 126.22 125.1 126.12 14200636
43
30-Aug-16
126.6 126.6 125.15 125.84 17804286
44
29-Aug-16
124.35 126.73 124.35 126.54 15925900
45
26-Aug-16
124.05 125.19 123.91 124.96 17504825
46
25-Aug-16
123.12 124.37 123.1 123.89 10730811
47
24-Aug-16
124.47 124.69 123.09 123.48 12243719
48
23-Aug-16
124.51 125.09 124.25 124.37 13309452
49
22-Aug-16
123.33 124.83 123.11 124.15 14386361
50
19-Aug-16
123.6 124.16 123.28 123.56 11688265
51
18-Aug-16
124.01 124.26 123.64 123.91 12400816
52
17-Aug-16
123.66 124.38 122.85 124.37 13794179
53
16-Aug-16
123.5 123.92 122.78 123.3 14222410
54
15-Aug-16
124.91 124.92 123.7 123.9 19295130
55
12-Aug-16
124.7 125 124.18 124.88 12158955
56
11-Aug-16
Multi Layer Feed Forward Neural Network Knowledge Base to Future Stock Market Prediction
57
10-Aug-16
125.07 125.48 124.54 124.88 10670148
58 9-Aug-1
6
125.34 126.09 124.53 125.06 19620967
59 8-Aug-1
6
125.25 125.45 124.55 125.26 15233929
60 5-Aug-1
6
124.98 125.84 124.62 125.15 20184035
61 4-Aug-1
6
122.94 124.79 122.51 124.36 21065974
62 3-Aug-1
6
123.09 123.92 122.31 122.51 18525332
63 2-Aug-1
6
124.06 124.8 122.07 123.09 23968414
64 1-Aug-1
6
123.85 124.58 122.86 124.31 25006850
65 29-Jul-1
7
124.65 125.84 123.71 123.94 35058803
66 28-Jul-1
6
127.52 128.33 123.63 125 78955758
67 27-Jul-1
6
122.42 125 121.51 123.34 52654239
68 26-Jul-1
6
122 122.07 120.75 121.22 17611964
69 25-Jul-1
6
121.39 121.85 117.78 121.63 18487449
70 22-Jul-1
6
119.9 121.01 119.31 121 18422410
71 21-Jul-1
6
121.92 122.1 120.25 120.61 17801663
72 20-Jul-1
6
121.25 122.2 120.56 121.92 20046452
73 19-Jul-1
6
118.99 120.85 118.66 120.61 21541292
74 18-Jul-1
6
117.32 119.61 116.89 119.37 20868367
75 15-Jul-1 117.74 118.28 116.58 116.86 16645964
6
76 14-Jul-1
6
117.5 117.64 116.7 117.29 14579736
77 13-Jul-1
6
118.39 118.4 116.68 116.78 16207662
78 12-Jul-1
6
118.63 118.72 117.57 117.93 15217700
79 11-Jul-1
6
117.71 118.7 117.5 117.87 17711570
80 8-Jul-16 116.43 117.5 115.85 117.24 18142597
81 7-Jul-16 116.63 116.97 115.36 115.85 16630201
82 6-Jul-16 113.36 116.79 112.97 116.7 24337586
83 5-Jul-16 113.94 114.11 112.97 114 14207037
84 1-Jul-16 114.2 115.13 113.81 114.19 14980023
85 30-Jun-1
7
114.67 115.18 113.67 114.28 23192716
86 29-Jun-1
6
113.37 114.25 113.04 114.16 20968273
87 28-Jun-1
6
110.63 112.75 110.55 112.7 26813842
88 27-Jun-1
6
111.57 111.57 108.23 108.97 36409606
89 24-Jun-1
6
111.01 113.68 111 112.08 40643130
90 23-Jun-1
6
114.37 115.09 113.54 115.08 16176895
91 22-Jun-1
6
114.65 114.74 113.61 113.91 14846329
92 21-Jun-1
6
114.12 115.21 113.97 114.38 19166269
93 20-Jun-1
6
94 17-Jun-1 6
114.42 114.43 112.56 113.02 24644308
95 16-Jun-1
6
113.87 114.5 112.94 114.39 19236255
97
98 13-Jun-1
6
115 115.48 113.31 113.95 31718239
99 10-Jun-1
6
117.54 118.11 116.26 116.62 18510826
100 9-Jun-16 118.13 118.68 117.71 118.56 13859240
101 8-Jun-16 117.76 118.6 117.27 118.39 14505596
102 7-Jun-16 119.24 119.3 117.67 117.76 17103023
103 6-Jun-16 118.62 119.43 118.36 118.79 12744676
104 3-Jun-16 118.98 118.98 117.86 118.47 14135114
105 2-Jun-16 118.69 119.44 118.22 118.93 13228310
106 1-Jun-16 118.5 119.08 117.82 118.78 15029494
107
31-May-17
119.46 120.1 118.12 118.81 23547597
108
27-May-16
119.56 119.85 119.01 119.38 13464434
109
26-May-16
118.24 119.76 117.92 119.47 18191472
110
25-May-16
118.13 118.66 117.38 117.89 20019778
111
24-May-16
116.24 117.73 116.12 117.7 20074093
112
23-May-16
117.42 117.6 115.94 115.97 20367390
113
20-May-16
116.96 117.99 116.95 117.35 18870608
114
19-May-16
117.05 117.49 115.88 116.81 20485379
115
18-May-16
116.8 118.27 116.73 117.65 21571824
116 17-May- 118.82 119.01 117.2 117.35 21269720
16
117
16-May-16
119.38 119.61 117.35 118.67 31178289
118
13-May-16
120.38 120.64 119.68 119.81 18047101
119
12-May-16
119.98 120.84 118.9 120.28 21636556
120
11-May-16
120.41 121.08 119.42 119.52 21927392
121
10-May-16
119.62 120.5 119 120.5 22803690
122 9-May-1
6
119.54 120.28 118.9 119.24 21077084
123 6-May-1
6
117.16 119.64 117.11 119.49 26216236
124 5-May-1
6
118.04 118.98 117.25 117.81 21999237
125 4-May-1
6
116.61 118.3 116.57 118.06 23380209
126 3-May-1
6
117.52 118.16 117.02 117.43 23746203
127 2-May-1
6
117.83 118.73 116.57 118.57 27769280
128 29-Apr-1 7
116.82 117.84 115.84 117.58 37031156
129 28-Apr-1 6
119.58 120.79 116.23 116.73 86746016
130 27-Apr-1 6
107.94 108.94 106.31 108.89 44036820
131 26-Apr-1 6
110.49 110.5 108.15 108.76 22189916
132 25-Apr-1 6
109.87 110.67 109.07 110.1 20979671
133 22-Apr-1 6
Multi Layer Feed Forward Neural Network Knowledge Base to Future Stock Market Prediction
134 21-Apr-1
6
112.55 114.04 112.31 113.44 20409388
135 20-Apr-1
6
112.43 113.27 111.56 112.42 20998319
[image:12.595.46.300.50.130.2]The following Table 3 shows the actual and predicted closing price of the stock with error values. All these values are calculated by using equations (2) to (6). The results are listed in the table 3. The performance chart plots of the actual and predicted values are shown in the following diagrams
Table 3 Performance report of actual and predicted closing price by multi-layer feed forward neural networkS.no
s .
on date three input layers output layer with error rate
open price high price low price actual closing price predicted closing price error rate error rate % 1 28-Oct-1 8
0.10916 0.1144171 0.1144171 112.29 114.4171 2.1271 0.021271
2 27-Oct-1 8
0.1092 0.1139759 0.1139759 110.45 113.9759 3.5259 0.035259
3 26-Oct-1 8
0.1092 0.1143268 0.1143268 109.64 114.3268 4.6868 0.046868
4 25-Oct-1 8
0.11026 0.1146218 0.1146218 110.84 114.6218 3.7818 0.037818
5 24-Oct-1 8
0.10652 0.1139179 0.1139179 110.51 113.9179 3.4079 0.034079
6 21-Oct-1 8
0.10899 0.1137725 0.1137725 110.61 113.7725 3.1625 0.031625
7 20-Oct-1 8
0.10877 0.114154 0.114154 108.99 114.154 5.164 0.05164
8 19-Oct-1 8
0.1099 0.1157142 0.1157142 110.63 115.7142 5.0842 0.050842
9 18-Oct-1 8
0.11307 0.1166116 0.1166116 113.64 116.6116 2.9716 0.029716
10 17-Oct-1 8
0.11242 0.1159558 0.1159558 113.71 115.9558 2.2458 0.022458
11 14-Oct-1 8
0.1119 0.1156632 0.1156632 112.22 115.6632 3.4432 0.034432
12 13-Oct-1 8
0.11161 0.1162211 0.1162211 112.55 116.2211 3.6711 0.036711
13 12-Oct-1 8
0.11335 0.116691 0.116691 116.06 116.691 0.631 0.00631
14 11-Oct-1 8
0.11377 0.1171469 0.1171469 114.1 117.1469 3.0469 0.030469
15 10-Oct-1 8
0.11436 0.1180187 0.1180187 114.7 118.0187 3.3187 0.033187
16 7-Oct-170.11364 0.1168137 0.1168137 116.14 116.8137 0.6737 0.006737
17 6-Oct-170.11295 0.116415 0.116415 113.69 116.415 2.725 0.02725
18 5-Oct-170.11168 0.115597 0.115597 113.05 115.597 2.547 0.02547
19 4-Oct-170.112 0.115663 0.115663 112.54 115.663 3.123 0.03123
20 3-Oct-170.11117 0.1151708 0.1151708 112.25 115.1708 2.9208 0.029208
21 30-Sep-1 7
0.11103 0.1152245 0.1152245 111.85 115.2245 3.3745 0.033745
22 29-Sep-1 6
0.11027 0.114939 0.114939 111.45 114.939 3.489 0.03489
23 28-Sep-1 6
0.11073 0.1152886 0.1152886 111.02 115.2886 4.2686 0.042686
24 27-Sep-1 6
0.1101 0.1145252 0.1145252 112.18 114.5252 2.3452 0.023452
25 26-Sep-1 6
0.10884 0.1136458 0.1136458 110.67 113.6458 2.9758 0.029758
26 23-Sep-1 6
0.10877 0.1136794 0.1136794 109.89 113.6794 3.7894 0.037894
27 22-Sep-1 6
0.10792 0.1131296 0.1131296 109.41 113.1296 3.7196 0.037196
28 21-Sep-1 6
0.10577 0.1122245 0.1122245 107.32 112.2245 4.9045 0.049045
29 20-Sep-1 6
0.10549 0.1117264 0.1117264 107.51 111.7264 4.2164 0.042164
30 19-Sep-1 6
0.1044 0.1107209 0.1107209 105.93 110.7209 4.7909 0.04790 .
31 16-Sep-1 6
0.10472 0.1119289 0.1119289 105.73 111.9289 6.1989 0.061989
32 15-Sep-1 6
0.10793 0.1136578 0.1136578 108.39 113.6578 5.2678 0.052678
33 14-Sep-1 6
0.10854 0.1139273 0.1139273 109.58 113.9273 4.3473 0.043473
34 13-Sep-1 6
0.10877 0.1138131 0.1138131 109.95 113.8131 3.8631 0.038631
35 12-Sep-1 6
0.1076 0.1128059 0.1128059 109.82 112.8059 2.9859 0.029859
36 9-Sep-160.10675 0.1124465 0.1124465 106.92 112.4465 5.5265 0.055265
37 8-Sep-160.10716 0.1129507 0.1129507 107.92 112.9507 5.0307 0.050307
38 7-Sep-160.10561 0.1119036 0.1119036 108.07 111.9036 3.8336 0.038336
39 6-Sep-160.10274 0.1099774 0.1099774 106.88 109.9774 3.0974 0.030974
40 2-Sep-160.10512 0.1116536 0.1116536 105.46 111.6536 6.1936 0.061936
41 1-Sep-160.10534 0.1112714 0.1112714 107.16 111.2714 4.1114 0.041114
42 31-Aug-17
0.10206 0.1091944 0.1091944 104.57 109.1944 4.6244 0.046244
43 30-Aug-16
44 29-Aug-16
0.1004 0.1084367 0.1084367 105.2 108.4367 3.2367 0.032367
45 26-Aug-16
0.10024 0.1090073 0.1090073 101.61 109.0073 7.3973 0.073973
46 25-Aug-16
0.10109 0.1092704 0.1092704 102.01 109.2704 7.2604 0.072604
47 24-Aug-16
0.09888 0.1071445 0.1071445 101.91 107.1445 5.2345 0.052345
48 23-Aug-16
0.10024 0.1082525 0.1082525 101 108.2525 7.2525 0.072525
49 22-Aug-16
0.09682 0.1056305 0.1056305 99.54 105.6305 6.0905 0.060905
50 19-Aug-16
0.09746 0.1069429 0.1069429 99.75 106.9429 7.1929 0.071929
51 18-Aug-16
0.10318 0.1118985 0.1118985 104.07 111.8985 7.8285 0.078285
52 17-Aug-16
0.10925 0.1146808 0.1146808 110.49 114.6808 4.1908 0.041908
53 16-Aug-16
0.10975 0.1160046 0.1160046 112.69 116.0046 3.3146 0.033146
54 15-Aug-16
0.1132 0.1169914 0.1169914 114.61 116.9914 2.3814 0.023814
55 12-Aug-16
0.11201 0.1157531 0.1157531 115.09 115.7531 0.6631 0.006631
56 11-Aug-16
0.10884 0.1136057 0.1136057 112.21 113.6057 1.3957 0.013957
57 10-Aug-16
0.10481 0.1116677 0.1116677 109.11 111.6677 2.5577 0.025577
58 9-Aug-1 6
0.09423 0.1049844 0.1049844 94.45 104.9844 10.534 4
0.105344
59 8-Aug-1 6
0.09566 0.1054518 0.1054518 97.34 105.4518 8.1118 0.081118
60 5-Aug-1 6
0.09693 0.1061983 0.1061983 97.01 106.1983 9.1883 0.091883
61 4-Aug-1 6
0.09549 0.1049411 0.1049411 97.94 104.9411 7.0011 0.070011
62 3-Aug-1 6
0.09262 0.1034776 0.1034776 94.16 103.4776 9.3176 0.093176
63 2-Aug-1 6
0.08937 0.1016904 0.1016904 94.35 101.6904 7.3404 0.073404
64 1-Aug-1 6
0.09392 0.1044571 0.1044571 95.26 104.4571 9.1971 0.091971
65 29-Jul-1 7
0.09354 0.103472 0.103472 94.97 103.472 8.502 0.08502
66 28-Jul-1 6
0.09245 0.1037371 0.1037371 98.37 103.7371 5.3671 0.053671
67 27-Jul-1 6
0.09521 0.1062492 0.1062492 95.44 106.2492 10.809 25
0.108092
68 26-Jul-1 6
0.09755 0.1064993 0.1064993 99.37 106.4993 7.1293 0.071293
69 25-Jul-1 0.09539 0.1054121 0.1054121 97.51 105.4121 7.9021 0.079021
6
70 22-Jul-1 6
0.09703 0.1066214 0.1066214 97.33 106.6214 9.2914 0.092914
71 21-Jul-1 6
0.0973 0.1069197 0.1069197 97.92 106.9197 8.9997 0.089997
72 20-Jul-1 6
0.1009 0.1083315 0.1083315 102.97 108.3315 5.3615 0.053615
73 19-Jul-1 6
0.10166 0.1091752 0.1091752 102.73 109.1752 6.4452 0.064452
74 18-Jul-1 6
0.09975 0.1082235 0.1082235 102.22 108.2235 6.0035 0.060035
75 15-Jul-1 6
0.10462 0.1112027 0.1112027 104.66 111.2027 6.5427 0.065427
76 14-Jul-1 6
0.10606 0.1120164 0.1120164 106.22 112.0164 5.7964 0.057964
77 13-Jul-1 6
0.10625 0.1118854 0.1118854 107.26 111.8854 4.6254 0.046254
78 12-Jul-1 6
0.10453 0.1108445 0.1108445 105.93 110.8445 4.9145 0.049145
79 11-Jul-1 6
0.1045 0.1107407 0.1107407 105.02 110.7407 5.7207 0.057207
80 8-Jul-16 0.10386 0.110913 0.110913 104.63 110.913 6.283 0.06283
81 7-Jul-16 0.10481 0.1110046 0.1110046 105.51 111.0046 5.4946 0.054946
82 6-Jul-16 0.1036 0.1104982 0.1104982 104.77 110.4982 5.7282 0.057282
83 5-Jul-16 0.10397 0.1110133 0.1110133 104.04 111.0133 6.9733 0.069733
84 1-Jul-16 0.10613 0.1122036 0.1122036 106.22 112.2036 5.9836 0.059836
85 30-Jun-1 7
0.10419 0.1108487 0.1108487 106.79 110.8487 4.0587 0.040587
86 29-Jun-1 6
0.10428 0.1108551 0.1108551 104.55 110.8551 6.3051 0.063051
87 28-Jun-1 6
0.10146 0.108904 0.108904 104.66 108.904 4.244 0.04244
88 27-Jun-1 6
0.10191 0.1096809 0.1096809 102.12 109.6809 7.5609 0.075609
89 24-Jun-1 6
0.10441 0.1108146 0.1108146 105.42 110.8146 5.3946 0.053946
90 23-Jun-1 6
0.10355 0.110907 0.110907 104.6 110.907 6.307 0.06307
91 22-Jun-1 6
0.10395 0.1103097 0.1103097 106.49 110.3097 3.8197 0.038197
92 21-Jun-1 6
0.10466 0.1113768 0.1113768 105.61 111.3768 5.7668 0.057668
93 20-Jun-1 6
0.10411 0.1106143 0.1106143 106.18 110.6143 4.4343 0.044343
94 17-Jun-1 6
Multi Layer Feed Forward Neural Network Knowledge Base to Future Stock Market Prediction
95 16-Jun-1 6
0.10579 0.1119266 0.1119266 106.07 111.9266 5.8566 0.058566
96 15-Jun-1 6
0.1045 0.1107709 0.1107709 107.12 110.7709 3.6509 0.036509
97 14-Jun-1 6
0.10375 0.1108597 0.1108597 104.24 110.8597 6.6197 0.066197
98 13-Jun-1 6
0.10486 0.1112089 0.1112089 105.45 111.2089 5.7589 0.057589
99 10-Jun-1 6
0.1051 0.1114729 0.1114729 105.41 111.4729 6.0629 0.060629
100 9-Jun-16 0.10439 0.1111262 0.1111262 105.74 111.1262 5.3862 0.053862
101 8-Jun-16 0.10608 0.1120866 0.1120866 106.95 112.0866 5.1366 0.051366
102 7-Jun-16 0.10662 0.1121489 0.1121489 107.32 112.1489 4.8289 0.048289
103 6-Jun-16 0.10595 0.1121003 0.1121003 106.26 112.1003 5.8403 0.058403
104 3-Jun-16 0.10539 0.1113918 0.1113918 107.77 111.3918 3.6218 0.036218
105 2-Jun-16 0.10414 0.1105807 0.1105807 105.13 110.5807 5.4507 0.054507
106 1-Jun-16 0.10047 0.108923 0.108923 104.04 108.923 4.883 0.04883
107 31-May-17
0.10383 0.1115124 0.1115124 103.95 111.5124 7.5624 0.075624
108 27-May-16
0.108 0.1131562 0.1131562 108.02 113.1562 5.1362 0.051362
109 26-May-16
0.10711 0.1127903 0.1127903 109.01 112.7903 3.7803 0.037803
110 25-May-16
0.10524 0.1114658 0.1114658 107.91 111.4658 3.5558 0.035558
111 24-May-16
0.10586 0.1119499 0.1119499 106.49 111.9499 5.4599 0.054599
112 23-May-16
0.10591 0.1123145 0.1123145 107.1 112.3145 5.2145 0.052145
113 20-May-16
0.10795 0.1132466 0.1132466 108.76 113.2466 4.4866 0.044866
114 19-May-16
0.10248 0.1095489 0.1095489 103.94 109.5489 5.6089 0.056089
115 18-May-16
0.1024 0.1095323 0.1095323 102.58 109.5323 6.9523 0.069523
116 17-May-16
0.10118 0.1086228 0.1086228 103.31 108.6228 5.3128 0.053128
The performance plot using the multi-layer feed forward neural network with linear actual and predicted results are plotted in the following diagram 13.
Diagram 13: A performance plot of actual and predicted closing stock market price
The performance analysis of the predicted and error rate is described in the diagram 14. The lerning method used here is the linear line classifier.
Diagram 14: A performance plot of predicted and error rate of closing price stock market
IV. RESULT AND CONCLUSION
Future stock prediction is necessary for the gaining profit using the stocks. In this paper the output layer closing price is calculated by using input layer like open price, high price and low price. The mean absolute error value is calculated as the performance measure. The prediction was based on by considering the BSE stock market exchange. The actual and predicted values for the closing price are listed in the table 4. This table describes the error rates which show only minimum change with the actual and predicted results. The performance measures are plotted in the graph by using tanH activation function and linear classifier. This paper results that multi-layer feed forward neural network method results significances change in future stock prediction.
REFERENCES
1. Sachin Kamley, Shailesh Jaloree and R. S. Thakur, “Multiple regression : a data mining approach for predicting the stock market trends based on open, close and high price of the month”, Vol. 3, Issue 4, Oct 2013. 2. S Abdulsalam Sulaiman Olaniyi, Adewole, Kayode S. and Jimoh, R. G
“ Stock Trend Prediction Using Regression Analysis – A Data Mining Approach” Volume 1 No. 4, JULY 2011
3. Mayankkumar B Patel and Sunil R Yalamalle. “Stock Price Prediction Using Artificial Neural Network “ June 2014
5. Clive W.J. G-anger S, “Forecasting stock market prices Lessons for forecasters”, 1992.
6. Paul D. Yoo , Maria H. Kim , and Tony Jan, “Machine learning techniques and use of event information for stock market prediction A survey and evaluation“ YEAR 2005
7. Abubakar S. Magaji, Victor Onomza Waziri, Audu Isah, Adeboye K.R “A Generic Prediction of Nigeria Stock Exchange Market, Implementation Using Naive Bayes Model”.
8. Rajesh V. Argiddi , Dr.Mrs.S.S.Apte , Bhagyashri and U. Kale “An Analysis on Stock Market Intelligence and Research Approaches” JAN 2014.
9. “Stock Market Index Prediction by Hybrid NeuroGenetic Data Mining Technique”
10. Ganesh V. Kumbhar, Rajesh and V. Argiddi “Stock Market Index Prediction by Hybrid NeuroGenetic Data Mining Technique”. 11. Rupinder kaur and Ms. Vidhu Kiran, “Efficient Artificial Neural
Network based Practical Approach of Stock Market Forecasting” , AUGUST 2015.
12. Dharamveer Sisodia, Beerendra Kumar and Jitendra Kumar Gupta “Efficient Prediction of Close Value using Genetic algorithm based horizontal partition decision tree in Stock Market” JANUARY 2014. 13. G.S.navale, nishant uddhwala, kunal jadhav, pawan gabda and brij
kishor vihangam , “Prediction of Stock Market using Data Mining and Artificial Intelligence”, JANUARY 2016
14. Binoy B. Nair, V.P Mohandas and N.R. Sakthivel “A Genetic Algorithm Optimized Decision TreeSVM based Stock Market Trend Prediction System”, 2010.
15. Sneha Soni “Applications of ANNs in Stock Market Prediction: A Survey”
16. Bhagwant Chauhan, Umesh Bidave, Ajit Gangathade and Sachin Ka, “Stock Market Prediction Using Artificial Neural Networks”2014. 17. S Abdulsalam Sulaiman Olaniyi, Adewole, Kayode S, and Jimoh, R. G
“Stock Trend Prediction Using Regression Analysis – A Data Mining Approach” JULY 2011.
18. Zahid Iqbal, R. Ilyas, W. Shahzad, Z. Mahmood and J. Anjum, “Efficient Machine Learning Techniques for Stock Market Prediction” NOV-DEC 2013.
19. Sayali Metkar, Akash Bhagyawant and Vrushali Bagul ““Stock Market Prediction and Automation of Sale Purchase Event using History Analysis.”SEPTEMBER 2013
20. Dr.P.Karthikeyan and G.Thamizhendhi, “Forecasting Stock Market predictions using Artificial Neural Network Models: A Survey” JULY 2016.
21. Prof.Sarita Sapka1,Tejashree Barate, Neelam Kadbne, Mayuri Pimple and Pallavi Kumbharka, Comparative Study and Analysis of Stock Market Prediction Algorithms “ MARCH 2016.
22. A. NagaBhushana Rao and K. Eswara Rao, “Estimize Bull speed using Back propagation”
23. Farhad Soleimanian Gharehchopogh, Tahmineh Haddadi Bonab and Seyyed Reza Khaze “ Linear regression approach to prediction of stock market trading volume: a case study “
24. Varunesh Nichante and Prof. Sulabha Patil, “A Review: Analysis of stock market by using big data analytic technology”