Abstract- As seen in the fabrication of circuits faults free circuits are difficult to obtain, as the manufacturing process is narrowing down, hence finding faults is very essential at the design level to obtain fault free circuits. As seen many of circuits have single and multiple faults, as known many research has been carried out to generate test pattern set that detect MSA faults, here the proposed ATPG method makes use of test patterns of single stuck at faults to identify MSA faults. This paper implements a method for multiple faults, generated test patterns for multiple faults has proved to be efficient by adapting a complex method of the order 3n-1 for ‘n’ lines reduced test pattern sets were obtained. This method overcomes the limitations of continuous searching algorithms, as the initial value of population size was randomly set to produce test vectors for MSA faults. The CPU processing time is very less compared to other ATPG techniques. To understand the working of the proposed methodology, we have performed an analysis by considering the ISCAS Benchmark circuits, to which the proposed ATPG method is applied, which gives the complete test vector (pattern) generation for MSA faults in the limited interval of runtime which also covers the test pattern sets for single faults.
Keywords- Test pattern generation, Single faults, Multiple faults, Crossover probability, CPU time.
I. INTRODUCTION
In the manufacture of chips the number of transistors is increasing enormously day by day, also faults in the circuits are most likely increases especially for larger circuits. Therefore, its mandatory to check the working and functionality of the larger circuits by applying the Automatic Test Pattern Generation method. For generating test patterns many fault models exist, but the most frequently used fault model is stuck at fault model at design level. To identify all the faults in the circuit an Automatic Test Pattern Generation (ATPG) method is applied by generating the compact test pattern sets. For any given circuit size there exist numerous ATPG algorithms which will detect all the faults i.e. single stuck at faults, also in recent times SAT-Based ATPG methods are used. The ATPG (Automatic Test Pattern Generation) is a digital automation technique to generate an test pattern or sequence of patterns, when applied to a digital electronic circuits, it measures the behavior of circuit is correct or faulty and finds the defects. After the manufacture of semiconductor devices these generated test patterns are applied for determining the faulted chips.
Revised Manuscript Received on September 03, 2019
Mrs. Abhinaya A, Department of Electronics and Communication
Engineering, BMS College of Engineering, Autonomous University, Bangalore, India.
B., Department of Electronics and Communication Engineering, BMS College of Engineering, Autonomous University, Bangalore, India.
The efficiency of ATPG tool is to measure the number of faulted model to the total number of generated test patterns, types of circuit considered for the DUT are full scan, asynchronous sequential, synchronous sequential and full scan. The level of abstraction used for Device Under Test (DUT) are register transfer, switch and gate level and the required test quality.
The basic ATPG algorithms are D-algorithm [1], FAN [3] [4] and Path Oriented Decision Making (PODEM) [2] has been developed to detect single stuck at faults. Along with existing methodologies Satisfiability (SAT) based ATPG method is developed in recent time. To generate complete test patterns for SSA faults such as [5] - [8] industry level ATPG technologies are available, but SAT based ATPG is most efficient and faster since it adapts implication and powerful learning techniques.
As the VLSI technologies scales down, the number of transistors on chip increases, also faults in the circuits increases i.e. multiple stuck at faults. If the given circuit is large finding the faults becomes tedious process by applying more number of combinations. If there is n possible, fault location in a given circuit. Then total 3n-1 combinations for multiple faults are obtained which is practically impossible to detect one by one.
A. Single Stuck at Faults
In SSA at faults model, the primary input or output net will be fixed at 0 or 1 in any logic circuits or flip-flops of any circuits. If the signal net is stuck at 0, it is known as stuck-at-0 (s-a-0) fault and if the signal net is stuck at 1, it is known as stuck-at-1 (s-a-1) fault.
If circuit can have faults at a time on any of single net in the circuit, then that fault is called Single Stuck at (SSA) faults. If more faults are found in the circuit, then it is called Multiple Stuck at (MSA) fault model. It is being observed that if a chip is verified for faults after fabrication, found to be fault free, then the chip can be 99.9% accurate that there are no faults in the chip or silicon. i.e. chip logically functioning correctly. For Design for Testability (DFT) single stuck at faults are easier to handle, like test patterns, scan chain and test time. Hence SSA fault model is extensive adapted in many applications and widely used in physical design. In any circuit, the netlist is defined as the interconnection of Boolean gate in a circuit. Faults are detected only on the interconnecting nets either at primary inputs or outputs of any logic gates. For single faults each net can be in any of these three states: normal, stuck-at-1 or stuck-at-0. When a net is at SSA faults, it can be in any two stages: stuck-at-1 and stuck-at-0 fault,
Generation of Reduced Test Vectors for Multiple
Stuck at Faults using Genetic Algorithm
it has a logic of 1 and 0 respectively. whatever, the logic the circuit carries for any gate driving it. For a given circuit with ‘n’ nets, the possible faults obtained are 2n
[image:2.595.378.483.131.283.2]. The fault can be detected one at a time in the circuit either stuck at 1 or stuck at 0. From Fig. 1 we can see stuck at faults for AND gate. It is 5 input AND gate having 5 input nets and a single output net. So 12 stuck at faults are possible for the given AND gate.
Fig. 1.Stuck at faults for AND Gate
B. Scan Chain Testing
[image:2.595.115.223.145.194.2]Scan chain testing is a technique to detect many manufacturing faults in the chip or silicon, there are variety of manufacturing faults which may exists in the chip or silicon, which has to be detected. In this project scan chain based Genetic algorithm has been proposed. Let’s us consider an example as shown in the Fig. 2 represents a simple scan flip-flop. It consists of 2 input multiplexer which is connected to input of flop, one input of mux is functional input denoted by D and other scan- in (SI). The Scan Enable (SE) signal selects the D and SI input signals
Fig. 2. Scan Flip Flop
In order to advance the testability of an Integrated Circuit (IC) techniques like Design for Test (DFT) are developed. In field of digital circuits, scan based testing is a systematic method. Both hardware and software based method is used in scan chain diagnosis, but the output of logic circuit of the scan chain may affect the test pattern [9]. For hardware double-tree scan chain architecture is adapted, this method reduces the application time of the test vectors for stuck at faults and delay faults. In the software component multiple faults are enabled that consists of fault simulation and the test vectors generated by the ATPG tool.
II. METHODOLOGY
The proposed methodology will generate a test vector set for multiple faults, these test sets will sufficiently cover test patterns for single faults. This method is implemented by Genetic Algorithm (GA), in which initially a set of test patterns (chromosomes) must be set or fixed. This initial test set can be specified by user or it can be randomly generated. The good the value of fitness function, better solution is obtained. Hence the proposed method performs number of iterations to give the best test patterns. Each iteration has three major steps: selection, crossover and mutation.
In this method, first population set is randomly selected. Then for each test pattern the fitness function is calculated
[image:2.595.126.211.372.462.2]for complete set. The top two highest fitness function corresponding test pattern are selected as parent and Genetic algorithm operations is implemented on these test patterns. Once the stop criterion is reached, the test patterns are displayed, else the iterations will continue till the stopping condition is reached
Fig. 3. Flow chart representing methodology
A. Test Vector Set Generation
The methodology proposed implements a coding technique called binary encoding method, where individual chromosome (test patterns) is denoted by a string of bits, also non binary coding method can be used. Each chromosome in the algorithm represent the test pattern and every gene denotes a single bit in the test vector. Also the length of the test patterns is the number of inputs in the circuit.
B. Initialization
The maximum size of the population is denoted by Pmax, for each circuits the Pmax value varies as shown in Table 1. The sequential circuits are composed of combinational logic along with flip-flops for the feedback logic. So flip flop’s inputs and outputs are converted into pseudo primary inputs and primary outputs respectively, also the sequential circuit is unrolled into a combination circuits. Table 1 shows the list maximum population size for all sequential circuits. For s27 circuit the total number of inputs and outputs are 4 and 3. For this population size to be maximum, one-third of Pmax is taken as initial population size. Now for each test pattern, fitness function is evaluated.
Table 1: Maximum Population Size (Pmax) For Different Circuits
[image:2.595.304.551.591.828.2]For the selected test patterns fitness value and fault coverage is calculated. The output of fitness function is fitness value, based on these fitness value the test pattern is dependent. In this proposed method, the fitness function is defined as number of faults that a particular test vector can detect from the list of faults as shown in equation 1. For a given test vector the fitness function is denoted by formula.
Where, Nf represents the number of faults in the faults list and Dn gives the detection number, if the value of Dn is ‘0’ then test pattern cannot detect any faults from the combination of faults, if the value is ‘1’ then the test vector can detect number of faults.
III. IMPLEMENTATION
This project requires simulation of Genetic Algorithm for the detection of SSA faults and MSA faults. HOPE simulator is used as simulation software. At the first, the proposed algorithm is applied for the benchmark circuits. The algorithm is implemented in Ubuntu 16.04 platform. When this method is applied to benchmark circuits, many iterations are carried out which undergoes a set of GA parameters like selection, crossover, mutation to obtain a test pattern sets which detect all the SSA faults. Different crossover points are calculated to cover most of the faults. It also detects multiple stuck at faults for larger crossover points. Once the method is executed by using a fault simulator, it gives us the complete details of the circuits like number of detected and undetected faults and the runtime of the circuits. It deeply calculates and gives the processing time to detect the faults.
A. Crossover
The mechanism used in crossover is roulette wheel mechanism, which selects a pair of candidate vectors, different crossover points can be used. In this project we choose one-point crossover, uniform crossover, two-point crossover and 1000-point crossover. One-point crossover is explained below, in same way two-point crossover, 1000-point crossover and uniform crossover are performed.
1. Let ‘m’ be a position in the test pattern which is selected randomly from the list of 1 to L. L is the length of test pattern.
2. From first candidate vector first ‘m’ bits are copied to another new vector.
3. Similarly, from the second candidate vector first ‘m’ bits are copied into second new vector.
4. The first candidate vector Bits m + 1 … L are copied to second new vector (into bit’s m + 1…L)
5.
The second candidate vector bits’ m + 1 … L are [image:3.595.328.526.377.489.2]copied to first new vector (into bit’s m + 1…L).
Fig. 4. One-point crossover
On similar basis, the two-point crossover, 1000-point crossover and uniform crossover is performed. This increases the probability of finding more number of SSA faults. The combinations of test pattern are also unique.
B. Calculation of crossover probability
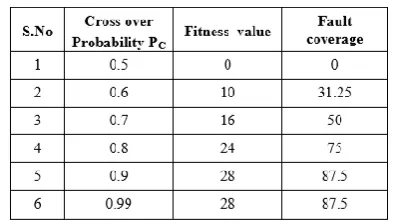
The crossover probability for any particular test pattern influences the fault coverage and fitness value, generally if crossover probability is a high value it gives a better fault coverage and fitness value. The fault coverage and fitness value for the circuit c1908 is as shown in the Table 2., four faults have been injected to c1908 circuit. As this circuit consists of 33 inputs, 25 outputs and logic gates are 880 in number, since c1908 is of medium complexity circuit, this circuit is chosen from all other for same reason. From the Table 2. the fault coverage and fitness value are taken first with the crossover probability value from 0.5 to 0.9 and the mutation probability value is taken as zero. It can be clearly noticed that as the increase in crossover probability, there is increases in the fault coverage and fitness value. Even if we set the value of crossover probability to 0.09, 32 is the maximum fitness value we get with the four faults injected and also 100% fault coverage is not obtained. Hence to make it better mutation has to be considered.
Table 2: Fault Coverage and Fitness Value with Value Pc and Pm = zero
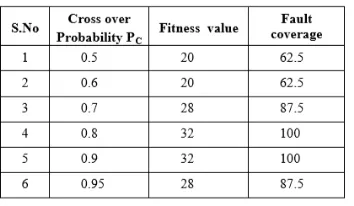
C. Increased Mutation probability
[image:3.595.72.272.697.760.2]Table 3: Fault Coverage and Fitness Value with Varying Pc and Pm = 0.1
The maximum fitness value is 32 when four faults are injected to circuits. As seen single faults count is four (4), double faults count is six (6), triple faults count is four (4) and 1 quadruple fault. In circuits s1238, s1196, s820 and c1908 these scenario is observed. Because of smaller value of Nf, the maximum fitness value obtained will be small with Pmax even if the fault count number is small. It can be clearly noted, for c17 circuit the maximum faults that can be injected is two (2) faults fault masking concept is not included. Hence the fitness value obtained is four (4). All the faults can be detected if the population size is small, as considering the maximum fitness value of s298 circuit. With one-third of Pmax the maximum fitness value can be achieved, since the circuit is small.
Table 4: Fault Coverage and Fitness Value for Different Population Sizes
However, for larger circuits this is not possible. In the case of s1423 circuit the highest fitness value is 32. As the population size reaches to its maximum 32, fitness value gradually increases.
D. Elitism Based Selection
The operational characteristics of GA, elitism provides a best chromosome (test patterns) by reducing the genetic drift between them, these chromosomes are allowed to pass their characteristics to the next generation. Genetic drift is the computation of stochastic changes in the frequency of the gene through the random sampling process for the finite population. Some gene of few chromosomes turn out to be critical ones when considered for final solution than any other. If a chromosome is a decision variable, which does not influence to the final solution, will not be in pressure for selection. Hence it is necessary to have a minimum selection pressure, as required for application. We can say that, required selection pressure must be used, if the genetic drift fails, it can be done by changing the elitism to higher value or the tournament size. Selection pressure can be increased by elitism at halting the minus of ‘salience’ genes of
chromosome due to unsatisfactory pressure in selection, it will enhance convergence and the optimality of Genetic algorithms in many cases. However, the degree of elitism value should be chosen properly and dealt with care because of high pressure in selection may lead to premature convergence.
E. Roulette Wheel Selection
Fitness Proportionate selection is another popular name of Roulette Wheel Selection, this selection procedure is used in Genetic Algorithm for obtaining an optimal solution from the all possible recombination solutions. As seen in all the methods, even in Roulette Wheel selection procedure, the fitness function is used to assign fitness value to all the chromosomes and all the combination solutions obtained. From these value, the probability of getting selected is decided for individual chromosomes. Based on the fitness value, a chance to the chromosome is given to the selection process. Then this calculated by ratio of fitness of a single selection to the fitness of all the selections, and then normalizing this function to 1. Then a normal selection is made which is same as of the roulette wheel is rotated.
IV. RESULTSANDDISCUSSION
[image:4.595.61.278.406.507.2]Table 5: CPU Execution Time in Seconds
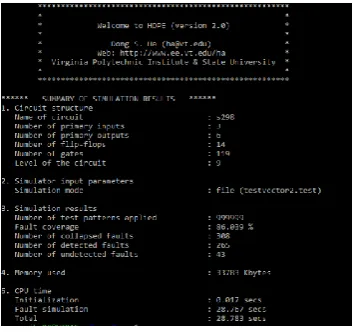
[image:5.595.75.265.73.163.2]Crossover: In this paper, four different crossover points are considered for each of the circuits, all combination crossover is applied the following results in seen in Table 6. As seen in Fig 5. s298 circuit is applied with one-point crossover. The fault coverage obtained is 86.039, the fault count value is 265 (number of faults detected). The number of undetected faults are 43. Also the CPU execution time is 28.783s.
Fig. 5. S298 One-point crossover
For the two-point crossover, the fault coverage is 85.714, the count of detected faults is 264. The count of undetected faults is 44. The total CPU time is 3.8s. The proposed algorithm applied for the benchmark circuits for different crossover points, from the performed experiment it is observed that increase in crossover probability the CPU execution time decreases and memory usage is lesser.
Table 6, Table 7, Table 8 and Table 9 shows the CPU execution time, memory usage, number of detected fault, number of undetected faults and fault coverage for the ISCAS benchmark circuits for different crossover point.
[image:5.595.80.257.259.425.2]For the uniform crossover point, it is observed that fault coverage is better to other and the count of test pattern generated are more. Memory used is also high due to the more number of test vectors.
Table 6: Uniform Crossover Point
Table 7: One-Point Crossover
In all crossover points the count of collapsed faults, detected faults and undetected faults is nearly same. Whereas the test pattern used to detect the faults varies, as the points increases the test vectors decreases and the CPU processing time also decrease as seen in the Table 8. For all the benchmark sequential circuits the applied test pattern set are 1000, with very less processing time of 0.117s for s298 circuit.
Table 8: 1000 Crossover Point
[image:5.595.304.548.277.394.2]For S298 and s820 circuits the memory used is very low, in fact when compared to other crossover point all circuits have less usage of memory. So the number of logic used is less and also area and power consumption is less comparative.
Table 9: Two-Point Crossover Point
[image:5.595.304.547.460.576.2]In the Genetic Algorithm, the applied test pattern has detected Multiple stuck at faults. As seen in Fig. 6 the s298 circuit number of stuck at faults are 4.
[image:5.595.353.503.630.703.2] [image:5.595.46.297.656.779.2]the test pattern set generated to detect these faults decreases in number. The main reason for such a behaviour is if fault count increase then the overall circuit fault for MSA fault will increases which will affect the output.
V. CONCLUSION
This paper represents an implementation of proposed method for multiple faults, generated test patterns for multiple faults has proved to be efficient by adapting a complex method of the order 3n-1 for ‘n’ lines reduced test pattern sets were obtained. This method overcomes the limitations of continuous searching algorithms, as the initial value of population size was randomly set to produce test pattern set for MSA faults. The CPU processing time is very faster compared to other existing algorithm. The experiment is performed on the ISCAS Benchmark sequential circuits. This methodology identifies all the MSA faults injected into the circuit, the least processing time of a sequential circuit is 0.117s. The fault coverage on an average for all the sequential circuits is approximately 85%. The test pattern applied to detect multiple faults covers SSA faults. The future scope is to identify triple and quadruple faults with same number of test vectors and cover maximum number of faults.
REFERENCES
1. J. P. Roth et al., “Diagnosis of automata failures,” IBM J. Res. Develop., Jul. 1968, pp. 278–291.
2. P. Goel, “An implicit enumeration algorithm to generate tests for combinational logic circuits,” IEEE Trans. Comput., vol. C-30, no. 3, pp. 215–222, Mar. 1981.
3. H. Fujiwara and T. Shimono, “On the acceleration of test generation algorithms,” IEEE Trans. Comput., vol. C-32, no. 12, pp. 1137–1144, Dec. 1983
4. H. Fujiwara, “Fan: A fanout-oriented test pattern generation algorithm,” in Proc. IEEE Int. Symp. Circuits Syst., Jun. 1985, pp. 671–674. 5. J. Shi, G. Fey, R. Drechsler, A. Glowatz, F. Hapke, and J. Schloffel,
“PASSAT: Efficient SAT-based test pattern generation for industrial circuits,” in Proc. IEEE Comput. Soc. Annu. Symp. VLSI, May 2005, pp. 212–217.
6. P. Stephan, R. K. Brayton, and A. L. Sangiovanni-Vincentelli, “Combinational test generation using satisfiability,” IEEE Trans. Comput.-Aided Des. Integr., vol. 15, no. 9, pp. 1167–1176, Sep. 1996. 7. A. Czutro, S. M. Reddy, I. Polian, and B. Becker, “Sat-based test pattern
generation with improved dynamic compaction,” in Proc. 13th Int. Conf. Embedded Syst. 27th Int. Conf. VLSI Design, Jan. 2014, pp. 56–61. 8. S. Eggersglüß, R. Wille, and R. Drechsler, “Improved SAT-based ATPG:
More constraints, better compaction,” in Proc. Int. Conf. Comput.-Aided Design, Nov. 2013, pp. 85–90..
9. Zhen chen, Sharad seth, Dong Xiang and Bhargab B. Bhattacharya, “Diagnosis Of Multiple Scan-Chain Faults in the Presence of System Logic Defects “ in Proc. Asian Test Symposium, Nov. 2011
10. M. J. Conrad, P. Wang, G. M. Amir, and M. Fujita, “Test pattern generation for multiple stuck-at faults not covered by test patterns for single faults,” in Proc. IEEE ISCAS, Baltimore, MD, USA, May 2017, pp. 2465–2472
11. S. Eggersglub, K. Schmitz, R. Krenz-Baath, and R. Drechsler, “Optimization-based multiple target test generation for highly compacted test sets,” in Proc. IEEE ETS, Paderborn, Germany, May 2014, pp. 1–6. 12. S. Kajihara, A. Murakami, and T. Kaneko, “On compact test sets for
multiple stuck-at faults for large circuits,” in Proc. IEEE ATS, Shanghai, China, Nov. 1999, pp. 20–24.
13. M. Fujita and A. Mishchenko, “Efficient SAT-based ATPG techniques for all multiple stuck-at faults,” in Proc. IEEE ITC, Seattle, WA, USA, Oct. 2014, pp. 1–10.
14. R. Ubar, S. A. Oyeniran, M. Scholzel, and H. T. Vierhaus, “Multiple fault testing in systems-on-chip with high-level decision diagrams,” in Proc. 10th Int. Design Test Symp. (IDT), Dec. 2015, pp. 66.
AUTHORSPROFILE
Mrs. Abhinaya A, pursing M Tech in Electronics from BMS College of Engineering, Bangalore, India. She has completed B.E. in Electronics and Communication Engineering from Vemana Institute of Technology, Bangalore. She has 6 years of industry and teaching experience. She has worked in Networking and VLSI domain.
.
Dr. Veena M B. She has completed B.E.(ECE), M.E (ECE) and Ph. D from VTU, Karnataka, serving as Associate Professor in the Department of Electronics and Communication Engineering from BMS College of Engineering, Bangalore, India. She has field and academic experience of more than 20 years, and taught at both undergraduate and postgraduate levels. She has guided many PG and Ph.D. students in the research work. Published many National and International Journal and Conference papers.