International Journal of Innovative Technology and Exploring Engineering (IJITEE) ISSN: 2278-3075, Volume-8 Issue-11, September 2019
Determining Customer Perceptions using Text
Mining for an FMCG Product “Maggi” In India
Semila Fernandes, Aarti Mehta Sharma, Vidyasagar A
Abstract: Purpose: With the popularity of social media, blogging, documents in the web, multiple text information is being generated every moment. Companies can gauge consumers’ sentiments by conducting analysis of tweets or Facebook posts and can take timely action to tweak promotional campaigns. In the beginning of 2015, Maggi noodles was banned by the then government. To track the sentiments of the people on the coming back of Maggi, the widely accepted micro blogging site, Twitter, is used. Twitter continuously generates different points of view on any given subject, relating to social issues, marketing issues etc. The challenge lies in understanding and analyzing these unstructured texts, figuring out the relevant information and transforming it into actionable cognizance.
Methods: The paper extracts set of 500 Twitter posts containing “Maggi”. 500 tweets were extracted to avoid heavy computation. The data was extracted by creating an interface between a twitter account and the statistical software R where we used the graphical user interface RStudio. This paper analyses tweets on this popular packed food item “MAGGI” by using statistical software like R and Excel. The methodology performed sentiment analysis using text mining approach following steps of Data Extraction, Text Transformation, Analyze the data, Data representation and validation.
Results: The paper conducts sentiment analysis on social media and examines consumer perception of “Maggi”. There are few negative tweets like “Tired of #Maggi”, “Hesitant to take the first bite of #Maggi #marketingmoves” but most of the tweets were in the favor of Maggi. Tweets like, “This new #Maggi ad will surely make you go nostalgic!!”, “3am with beloved curry maggi + boiled chicken”, “When you wanna eat healthy but you low on cash. #Yasssss #Maggi #Broccoli #Sausages #Protein” show strong positive sentiment.
From the sentiment analysis conducted on Maggi noodles, there were more positive rather than negative responses towards Maggi’s reentry into the Indian market. Thus, the concept of sentiment analysis can give marketers quick, preliminary insights into the consumers psyche which can later be followed up by traditional market research techniques.
Keywords: Customer Perception; Maggi; Social Media; Sentiment analysis; Text mining; Twitter.
Manuscript Details
Revised Manuscript Received on September 03, 2019
Semila Fernandes *, Management Department, Symbiosis Institute of Business Management, Bengaluru, Symbiosis International (Deemed University), Bengaluru, India. Email: [email protected]
Aarti Mehta Sharma, Management Department, Symbiosis Institute of Business Management, Bengaluru, Symbiosis International (Deemed University), Bengaluru, India. Email:[email protected]
Vidyasagar A, Management Department, Symbiosis Institute of Business Management, Bengaluru, Symbiosis International (Deemed University), Bengaluru, India. Email: [email protected]
I. INTRODUCTION
Maggi is owned by Nestle which is in existence since 1947 and is a brand of instant soups, noodles and seasonings. It is available in a huge range of products which includes frozen meals, packages soups, flavorings and prepared sauces. Nestle’s brand of Maggi noodles have been in India since the early 1980’s (Kaur & Rita,2016). Maggi noodles are a favorite instant snack which can be prepared in two minutes. They are available as nine variants including Atta and oats and in different flavors like Masala, chicken etc (The Tribune, 2015). Maggi controlled nearly 70% of the instant noodles market in India, according to a report by Times of India. Despite the success of Maggi, on June 5, 2015, Maggi was caught in a controversy. Maggi noodles was and is a popular packed food product manufactured and sold by Nestle India Ltd. as it was found that the monosodium glutamate (msg) used in the processing of the food, was beyond the permissible level. Due to the controversies, there was a decline of 17 percent in the company’s net sales. Subsequently in November 2015 Maggi was back on the shelves. FSSAI, the food safety and standards authority of India which is India’s food regulatory body identified nine varieties of Maggi noodles as being unsafe for human consumption. The apex body declared Maggi noodles and its variants as having excess lead content. The nine variants that were banned were Maggi Xtra Delicious Chicken Noodles, Maggi Cuppa Mania Chilly Chow Masala Yo Noodles, Maggi Cuppa Mania Masala Yo Noodles, Maggi Thrillin Curry Noodles, Maggi Vegetable Atta Noodles, Maggi 2-minute Masala/Maggi Hungroo Noodles, Maggi Extra Delicious Magical Masala Noodles, Maggi Vegetable Multigrainz Noodles, Maggi 2-minutes Masala Dumdaar Noodles.
The apex body FSSAI identified three major violations w.r.t Maggi noodles variants which are listed below:
1. There was excess of lead content for Maggi’s nine variants in India (Delhi laboratory) which was over the acceptable levels of 2.5 ppm. The court gave orders to test Maggi noodles at three laboratories viz. Punjab, Hyderabad and Jaipur where in the product was checked and declared safe for consumption.
2. The variant Maggi which was made of oats was released without being assessed.
3.The label on the packaging was misleading w*hich indicated that the product had no added MSG (monosodium glutamate) while the testing showed signs of MSG’s presence. However, later the company said that it would remove “No added MSG” from its labelling /packaging. Due to the controversies, it’s net sales declined 17 percent and its profit declined by a whopping 52.45%. when it was relaunched its share increased to 51 % (Business Standard, 2016) as recorded by
This shows that despite the controversy Maggi remains very dear to consumers.
Table- I: Market share and Number of outlets figures Oct
2015 Nov 2015
Dec 2015
Jan 2016
Feb 2016
Mar 2016 Market
share (by volume in %)
Nil 10 33.3 42 48 51
No of outlets reached (in mn)
Nil 0.5 1 1.4 1.8 >2
As society gets more active on social media, we believe it is a viable medium for research on consumer sentiments regarding products and services. Hence, sentiments that are aired on various forums like Facebook, twitter, Instagram etc. provide us with rich data which is ripe for mining and hence drawing insights. Mining of social media data gives quick and actionable insights to marketers. The authors feel that the data gathered through these forums are richer as consumers express themselves freely and thus the sentiments expressed are more authentic than a structured or unstructured questionnaire. Over a period, this method can be used along with traditional forms of market research or even as a standalone tool. This will also lead to saving of time and effort, which could be crucial for companies. In the era of “Big Data”, a major concern is towards huge heterogeneous unstructured text. With the popularity of social media, blogging, documents in the web, multiple text information is being generated every moment. At an average around 6000 tweets are being generated every second world-wide (internetlivestats.com, 2016). The amount of text information available to us is continuously increasing whereas the ability to process this data remains constant. Text mining is the new area of research in analytics that deals with the problem of overloaded information by the combination of various techniques (Feldman & Sanger, 2007). It is said to define a system which analyzes large quantity of natural textual information and detects usage patterns (Sebastiani, 2002). The challenge lies in understanding and analyzing these unstructured texts, figuring out the relevant information and transforming it into actionable cognizance. This process demands several algorithms to break down the text into lucid form, understanding and predicting customer behavior and social sentiment. Text clustering, categorization, summarization, sentiment analysis etc. are a few of the frequently used techniques to tackle amorphous texts (Aggarwal & Zhai, 2012).
One of the standard techniques of text analytics is called as sentiment analysis and is also known as opinion mining which figures out the emotion attached to the text. Previous research have proved that opinions expressed on social media have led to increased purchases (Isah, Trundle, & Neagu, 2014). In simple words, sentiment analysis confirms whether the textual dataset is neutral, negative or positive and understands the attitude of the speaker for a given situation. For example, the machine should clearly read “I love my car” as positive and “I do not like the color of that car” as negative. Thus, research pertaining to sentiment analysis involves the development of algorithms to automatically detect the sentiment expressed in a phrase or sentence (Pang & Lee, 2008). Sentiment analysis has many potential applications, including review mining, product
reputation analysis, multiple document summarizations, multiple perspective question- answering (Riloff, Patwardhan & Wiebe, 2006). Several studies have taken place over the years to determine how this method can possibly draw insights on consumers behaviour. In connection to this idea, 30,00,000 tweets were analyzed to gauge if popular social media users influenced the rest of the audience (Bae & Lee, 2012). Similarly, to check the polarity strength on the popular events, an analysis was performed on tweets for 30 important events over a period of one month (Thelwall, Buckley, & Paltoglou, 2011). Another major study was analyzing the emotion behind the status of 1 million Facebook status and calculating the Gross Domestic Happiness of the nation (Kramer, 2010). The causes and motives for consumer boycott behavior were analyzed through Twitter text mining (Makarem & Jae, 2015). Movie reviews are also frequently studied though sentiment analysis (Gamon, Aue, Corston-Oliver, & Ringer, 2005).
Our paper would extract tweets from twitter using the R statistical software, which is open source and used for graphics and for computing statistical data. It was developed at Bell Laboratories by John Chambers and colleagues. R is an integrated software which provides facilities for data calculation, manipulation and used for graphical displays (R Project, 2017). In the year 2016, most contributions 75% of articles in the Journal of Statistical Software discuss R, or have special volumes describing statistical software written in R (file:///C:/Users/aarti/Downloads/v73i02.pdf). Gulo & Rubio, 2015 describe a study to develop a solution for text mining scientific documents with the support of the R language and commented that it is a very promising technique for providing insights to summarize textual information.
A. Research Gap
Although there are a few researches that trap the sentiment of the social media, there is no study that defines the extraction of text and uses it as barometer of consumer sentiments through the use of simple statistical software. To bridge this gap, this paper focuses on the extraction of Twitter posts on a popular packed food item “MAGGI” by using the statistical software R and measuring the opinion of the consumer in the Indian market.
II. LITERATURE REVIEW
Twitter is a popular social networking site with over 320
million active monthly users
(https://about.twitter.com/company, accessed March 11, 2016). It is a forum that invites the opinion of different people all across the globe. The age group is not restricted to teens as it is seen that there is a rising usage among adults (Lenhart, Purcell, Smith, & Zickuhr, 2010). It is a micro blogging network that helps in easy dissemination of information. It is used to share the news of minor daily activities or a greater concern about a certain democratic issue (Java, Song, Finin, & Tseng, 2007). Twitter shows a low reciprocity in messages among users, unlike other social networks, indicating that its primary function is not a social networking site alone (Kwak, Lee, Park, & Moon, 2010), but rather to spread
International Journal of Innovative Technology and Exploring Engineering (IJITEE) ISSN: 2278-3075, Volume-8 Issue-11, September 2019
dependable forum to analyze the opinion of people.
The features like re-tweeting, which is forwarding an already existing tweet makes it easier to spread the knowledge. Similarly, the use of hashtags emphasizes the importance of extensively communicating data in Twitter. Similarly, the @ symbol is normally used to address the tweet/post to a different registered Twitter user. This allows Twitter to be used effectively for discussions and collaboration (Herring & Honeycutt, 2009). In such a platform it is convenient to carry out sentiment analysis. The broad areas of sentiment research are subjectivity and polarity. Subjectivity detects whether the text or a part of the text is subjective or objective to carry out further classification. Additionally, Polarity confirms whether the overall subjective text is positive or negative (Thelwall, Buckley, & Paltoglou, 2011). Various algorithms have been created over time to automatically detect the polarity of the text.
The common sentiment analysis approaches are the full-text machine learning and lexicon- based methods involving linguistics analysis (Witten & Frank, 2005). Preprocessing and pre-filtering is an integral part of any sentiment analysis. It makes the text much simpler for further analysis (Riloff, Patwardhan, & Wiebe, 2006). In the machine learning process, a set of dummy texts are fed in by human coders to train the algorithm to detect the features that associate with positive, negative and neutral. This trained set can further be used to check for similar texts in the larger data set and predict the polarity (Pak & Paroubek, 2010). On the other hand, the lexicon based method creates a bag of words which is pre- coded with polarity and matches the occurrence of the words within the texts to predict the overall polarity (Taboada, Brooke, Tofiloski, Voll, & Stede, 2011). The linguistic analysis is completely different from the other two approaches. It exploits the grammar to predict the polarity of the text. This procedure looks out for conjugation, superlative and idioms for prediction. For example, “The gown looks nice and classy”, the word “and” conjugates two positive words, whereas the presence of “but” in “The man is helpful but corrupt” conjugates a positive with a negative word (Thelwall, Buckley, & Paltoglou, 2011). Though these are three distinguished methods, often they are used together as per the requirement of the data set. Along with the other process there are also some algorithms that are successful in scoring the strength of the sentiment (Strapparava & Mihalcea, 2008). There is a scale for rating the human emotions and the texts can be differentiated accordingly as per strong and mild emotions. For example, “love” can be regarded as a stronger positive than “like”. Once this detection is made, a numerical value is attached to the text.
Sentiment analysis has its utility in a wide spectrum. In addition to academic research it holds a significant position in business intelligence (Chen, Chiang & Storey, 2012). To get the review of a product, that a company is selling, conducting a sentiment analysis is best to understand the consumer feedback (Jansen, Zhang, Sobel, & Chowdury, 2009). For instance, questions like “Why isn’t the laptop selling?” can be answered using sentiment analysis. The problems related to the product like design, price, etc. can be directly touched upon through this method. Similarly, to understand the opinion of the nation over a sensitive topic, sentiment analysis acts as a tool for psychological experiments. With the growing need of text mining, there
are various websites that help in the extraction of twitter data for faster analysis (Thelwall, Buckley, & Paltoglou, 2011).
III. OBJECTIVE
1. To study consumer’s perception of “Maggi” by studying Twitter sentiments.
2. To show that sentiment analysis can be used as a descriptive tool for analyzing consumer perception
IV. RESEARCH METHODOLOGY
The data used is a set of 500 Twitter posts containing “Maggi”. We took 500 tweets in order to avoid heavy computation. Maggi noodles is a popular packed food product manufactured and sold by Nestle India Ltd. Its “two minute” cooking formula, gained the confidence of a significant part of the population. But, in the beginning of 2015, it was reported that the monosodium glutamate (MSG) used in the processing of the food, was beyond the permissible level. Several court hearings had taken place and eventually Maggi production was banned. After a series of laboratory testing and speculations Maggi was back in the market by the end of 2015 (Nestle, 2016). Under this scenario, 500 tweets were collected from 1st April 2015 to 30th December 2015. The data was extracted by creating an interface between a twitter account and the statistical software R where we used the graphical user interface RStudio. R being an open source software, has a huge community of contributors that upgrade the existing packages and make the extraction process easier. On the other hand, R Studio is more user friendly as all the pertinent sections are available at a single glance. To remove the complexity of multiple screens, RStudio is preferred over R in the analysis. The methodology followed to perform sentiment analysis is as follows:
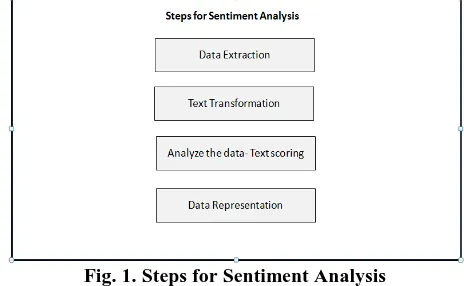
1. Data Extraction 2. Text Transformation 3. Analyze the data
4. Data representation and validation
Fig. 1 below shows the methodology steps used to perform the sentiment Analysis in the paper.
A. Data Extraction
The foremost step is data extraction which is from the vast user generated content over Twitter. The data record is large, disintegrated and disorganized where-in sentiments and opinions are articulated in various forms viz. the way the vocabulary is used, the amount of details that are provided, the slangs that are used etc. This takes huge amount of time and effort and makes the process almost impossible. However, with the support of text analytics, sentiment analysis and natural language processing, data analysis, extraction and classification has become far easier.
B. Text Transformation
Data Extraction is followed by the transformation of the text which take in cleaning of the data that has been extracted which is done much before the data analysis gets performed. This process involves recognizing and rejecting non-textual data from the textual dataset.
reviewers, or the information which is not important to the field of study. Stop words which includes but, a, how, what etc. are also removed. All uppercase and lowercase alphabets are brought to a common case, non-English words and un-necessary spaces and tabs are also cleaned. The language was restricted to English to avoid the complication of multiple languages.
C. Analyze the data
This involves Sentiment Detection & Classification. This step involves identification and extraction of opinions and reviews from the textual data by adopting computational tasks. Every sentence is inspected for bias and subjectivity. Sentiment detection is administered at various levels involving a single term, complete sentences or phrases, or a complete document. This technique adopted is categorized as a bag of words approach or unigrams where-in every element is represented as a feature vector which is based on the number of times the single word is repeated. This paper involves the unigram approach. Lexicon based text analysis was performed to carry out the sentiment analysis (Taboada, Brooke, Tofiloski, Voll, & Stede, 2011). A lexicon approach behaves as a bridge between the knowledge of the language and the language involved which involves a list of all words and meanings of a particular language. The data that has been extracted is later classified into two extreme points viz good/bad, positive/negative, like/dislike. Artificial intelligence and machine learning Machine learning are linked to each other and aims at developing computational models based on observations and past experiences. The overall objective is to develop a predictive function which can predict a target outcome which is y (dependent variable) by using a predefined input variable x (Gama and Carvalho, 2009). When the target outcome is known, this type of learning approach is termed as “supervised learning”. Using this approach of sentiment analysis every tweet is classified and the total number of positive and negative tweets are counted which are then added to get a total for the whole.
D. Data representation and validation
[image:4.595.51.283.548.691.2]Finally, to make the data visually appealing, a suitable data representation is performed. The data is checked for validity by applying a suitable test.
Fig. 1. Steps for Sentiment Analysis
The following packages were used to reach the final conclusion.
twitteR provides an interface to Twitter web API RCurl is essential to compose HTTP requests and convenience functions to fetch URLs and process the results returned by Web server.
RJSONIO allows R objects to be inserted to the Javascript.
stringr helps in performing various string operations
tm package is important to carry out the text transformations
SnowballC is required to perform stemming wordcloud helps in creating the wordcloud
V. ANALYSIS
Step 1: Data Extraction
In reference to Fig. 1, the first step is data collection. An intense twitter search was performed with Application Program Interfaces (APIs) for Twitter using R program, with keywords involving Maggi like magi, maggi, ‘maggi_curry’, #MAGGI, #Maggi, etc. to dig out maximum number of tweets. The extracted data contained 16 headings including tweets, the repost and the longitude and latitude. Tweets was the most relevant column among all of these.
Step 2: Text Transformation
A corpus was created with the collection of 500 tweets. The extracted words were a combination of upper and lower case, special characters, emoticons, spaces, URL, @people. Hence it was necessary to clean the data and make it simpler for usage by converting the tweets into lowercase, removing special characters, punctuations, emoticons, etc. Fig. 2 shows the word cloud after the extraction and transformation procedure. A word cloud is the collection of the words in the corpus, arranged as per their frequency of occurrence. To create the word cloud, two additional transformations were performed. The first one being removal of certain stop words. Stop words are few of the words that are filtered out before the processing of natural language data. Under the tm package, R contains 196 stop words. There is addition and alteration of these words as per convenience. Secondly, stemming was conducted to reduce the size of the data set by boiling the derived words to the root word. For instance, “eating”, “eatable”, “eaten”, etc. boil down to the root word “eat”. Finally, 1314 words were extracted after filtering. The word cloud in Fig. 2 represents all words whose frequency is more than 3. The word “maggi” is the largest in size as it has occurred maximum times in our analysis. The other words like lab, banned, msg, etc are also prominent, identifying the Maggi controversy.
Fig. 2. Word Cloud on Maggi
Source: Author’s creation from extracted Twitter data
Step 3: Analyze the data- Text Scoring
A dictionary was inserted which contained 2006 positive
[image:4.595.354.494.571.675.2]International Journal of Innovative Technology and Exploring Engineering (IJITEE) ISSN: 2278-3075, Volume-8 Issue-11, September 2019
(http://www.cs.uic.edu/~liub/FBS/opinion-lexicon-English.rar accessed March 12, 2016). In this dictionary, words were added and removed as per requirement. The algorithm was created to match the words in the dictionary and each tweet. If there is a positive match, the algorithm returned 1 and for each negative match the algorithm returned -1. For example, if there is a tweet that says, “I like Maggi”, the algorithm will check for “I”, “like” and “maggi” separately. As “like” is a word that matches with the positive dictionary, it will score it as 1. Finally, positive minus the negative score was calculated for each tweet and the numerical score was assigned to each tweet. If there was a word that did not match with the positive and negative words of the dictionary, there was a separate storage to add the new words. These new words could be further added to the original dictionary for better efficiency. However, there were 17 words that appeared to be nonsensical like
“ASDFGGG”, “WWWTTTGGGG”,
“RRTTGGHHYYMM”, etc. which could not be added to dictionary. Finally, the overall difference between the positive and the negative revealed the total strength of the sentiment analysis.
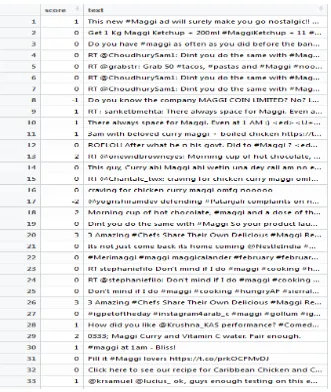
Fig. 3, shows the scores attached to every tweet. Larger negative scores keep up a correspondence to more negative expressions of sentiment, neutral tweets balances to zero, and highly positive tweets score higher, positive numbers. For example, the first tweet “This new #Maggi ad will surely make you go nostalgic!!” has been scored as 1 as there is one positive adjective which is “nostalgic”. Similarly, the second tweet “Get 1 Kg Maggi Ketchup + 200ml #MaggiKetchup + 11 #Maggi Packs in Just Rs. 257” has been scored as zero as it is a neutral statement. The tweet “@yogrishiramdev defending #Patanjali complaints on news channels, claims it’s a conspiracy, finally getting taste of his own medicine #Maggi” has scored two negatives as it includes two negative words complaints and conspiracy. Thus, every tweet is been given a score.
Fig. 3. Scoring the Maggi Tweets Source: Author’s creation from extracted Twitter data
Step 4: Data Representation
Finally, Fig. 4 represents the histogram with the frequency of the scores. It is clearly seen that the positive scores are higher than the negative scores. Hence the consumer opinion is in the favor of the food product, Maggi.
Fig. 4. Histogram on overall sentiment Score Source: Author’s creation from extracted Twitter data The total number of positive tweets were (1*57 + 2*20 + 2*3) 103, neutral tweets were 109 and negative tweets were
(1* 20 + 2*8 + 4*1) = 40. Hence, the overall sentiment was (= 103 – 40) was a positive 63.
VI. DISCUSSION
[image:6.595.57.278.543.722.2] [image:6.595.337.509.576.680.2]In order to check if the analysis was correct and appropriate, a manual scoring of all the existing tweets was performed. Fig. 5, is the graphical representation of the manually scored tweets.
Fig. 5. Histogram for manual sentiment Score Source: Author’s creation from extracted Twitter data For the manual scoring, the total number of positive tweets were (1*64 + 2*12 + 2*3) 94, neutral tweets were 100 and negative tweets were (1*
35 + 2*4) = 43. Hence, the overall sentiment was (= 94 - 43) was a positive 51.
1 0 8
20 109
57
20
2 0 0
0 20 40 60 80 100 120
-4 -3 -2 -1 0 1 2 3 4
Mo
re
Fr
e
q
u
e
n
cy
bin
Histogram
4 35
100 64
12 2 0
0 50 100 150
-2 -1 0 1 2 3 4
International Journal of Innovative Technology and Exploring Engineering (IJITEE) ISSN: 2278-3075, Volume-8 Issue-11, September 2019
To verify the authentication between manual and machine scoring (through R statistical software using sentiment analysis), a chi- square test is conducted (Table- II). It is a useful statistical method to understand the goodness of fit between two categorical variables, which is the observed and expected values (Gujarati & Porter, 1999). Hence the Hypothesis (H0) and the Alternate Hypothesis (HA) are as follows:
H0: There is no difference between the manual and the machine scoring.
Ha: There is a difference between the manual and the machine scoring.
As per the chi- square test, if the P- value is greater than 0.05 (at 5 percent significance level), we do not reject the null (Gujarati & Porter, 1999).
Table- II: Chi- Square Test of Manual and Machine Score
Score Manual Machine Total
-2 6.013857 5.986143 12
-1 27.56351 27.43649 55
0 104.7413 104.2587 209
1 60.63972 60.36028 121
2 16.03695 15.96305 32
3 2.004619 1.995381 4
Total 217 216 433
Source: Author’s creation from extracted Twitter data. The P value obtained in the Chi square test is 0.144804, which is higher than 0.05. Therefore, we do not reject the null hypothesis, i.e. There is no difference between the manual and machine scoring. According to Nestle’s Annual report for 2015 “Net Sales” for the year decreased by 17.2% largely due to the impact of the MAGGI Noodles issue. “Net Domestic Sales” decreased by 18.3%. Net Sales worth 3,034.0 million have been reversed during the year in relation to MAGGI Noodles stock withdrawn from trade partners and market (Nestle, 2016). For the first quarter of 2016, Net Sales” for the year decreased by 8.4 % largely due to the impact of MAGGI Noodles issue and “Net Domestic Sales” decreased by 8.7% (Nestle, 2016). For the second quarter of 2016, Net Sales” for the year increased by 16.7 % largely due to the impact of MAGGI Noodles issue and “Net Domestic Sales” increased by 17.5 % (Nestle, 2016). Comparisons are with corresponding quarters of the previous year.
The Economic Times on 19th August 2016 reported Nestle’s CEO Paul Bulcke as saying that Maggi has retained its leadership position in the market while announcing the firms half yearly results (Economic Times, 2016). In another news item in the Economic Times dated 7th September,2016 it was quoted that Maggi was a frontrunner in the instant noodles category with a 57% share in the market (Economic Times, 2016).
VII. CONCLUSION
Though there are few negative tweets like “Tired of #Maggi”, “Hesitant to take the first bite of #Maggi #marketingmoves” but most of the tweets are in the favor of Maggi. Tweets like, “This new #Maggi ad will surely make you go nostalgic!!”, “3am with beloved curry maggi + boiled chicken”, “When you wanna eat healthy but you low on cash. #Yasssss #Maggi #Broccoli #Sausages #Protein” show strong positive sentiment. This clearly implies that the
business strategies taken by Nestle go in favor of them, even after such a troubled period and people were willing to give Maggi a second chance. Thus, we propose that such a methodology can be used to mine customer perceptions. Sentiment analysis, which is faster than traditional marketing research, is an effective way for marketers to get immediate feedback on their goods or services and thus assist them in assessing how their product will do in the market or in making mid-course correction, if necessary. From the sentiment analysis conducted on Maggi noodles, it is clear that there were more positive rather than negative responses towards Maggi’s reentry into the Indian market. Thus, this tool can give marketers quick, preliminary insights into the consumers psyche which can later be followed up by traditional market research techniques.
VIII. LIMITATIONS
Firstly, the sample size is too small to get a significant result. The data is restricted to 500 tweets only. An extended data set might give a different sentiment pattern.
Secondly, the algorithm fails to detect sarcasm. For instance, “My flight is late. Brilliant!” is a negative statement. But the algorithm clearly misses out the negative sense of it and returns neutral.
Thirdly, the algorithm also fails to detect double negatives. For example, “This food in not unhealthy” should ideally return positive as “not unhealthy” clearly means “healthy”. But the code reads “not” as negative and “unhealthy” as another negative, increasing the strength of the negative.
REFERENCES
1. Aggarwal, C. C., & Zhai, C. (2012). An Introduction to Text Mining. Mining Text Data, 1-10. doi:10.1007/978-1-4614-3223-4_1 2. Bae, Y., & Lee, H. (2012). Sentiment analysis of twitter audiences:
Measuring the positive or negative influence of popular twitterers. Journal of the American Society for Information Science and Technology, 63(12), 2521-2535. doi:10.1002/asi.22768
3. Business Standard, (2016), Maggi back with a vengeance, Retrieved by http://www.business-standard.com/article/companies/maggi-back-with-a-vengeance-116042000031_1.html, Accessed on 20, Dec, 2017. 4. Chen, H., Chiang, R. H., and Storey, V. C., (2012), Business Intelligence and Analytics: From Big Data to Big Impact, MIS quarterly, 36(4), 1165-1188.
5. Economic Times, (2016), Nestle says back in market leading slot after
maggi relaunch. Retrieved from
http://economictimes.indiatimes.com/industry/cons- products/food/nestle-says-back-in-market-leading-slot-after-maggi-relaunch/articleshow/53755399.cms
6. Economic Times, (2016), How nissin seized the maggi crisis climbed up the instant noodle ladder. Retrieved from
http://economictimes.indiatimes.com/industry/cons- products/food/how-nissin-seized-the-maggi-crisis-climbed-up-the-instant-noodle-ladder/articleshow/54039683.cms
7. Feldman, R., and Sanger, J., (2007), The text mining handbook: advanced approaches in analyzing unstructured data, Cambridge University Press.
8. Gamon, M., Aue, A., Corston-Oliver, S., and Ringger, E., (2005), Pulse: Mining customer opinions from free text, In Advances in Intelligent Data Analysis VI (pp. 121-132), Springer Berlin Heidelberg.
9. Gujarati, D. N., and Porter, D. C., (1999), Essentials of econometrics. 10. Gulo, C., and Rubio, T., (2015). Text Mining scientific articles using
the R Language. Proceedings of the 10th doctoral symposium in
11. Herring, S. C., and Honeycutt, C., (2009), Beyond microblogging: Conversation and collaboration via Twitter, Extraído el, 10.
12. Internetlivestats, (2016), Internet Live Stats, Tata Communictaions. 13. Isah, H., Trundle, P., and Neagu, D., (2014), Social media analysis for
product safety using text mining and sentiment analysis, In Computational Intelligence (UKCI), 2014 14th UK Workshop on (pp. 1-7). IEEE.
14. Jansen, B. J., Zhang, M., Sobel, K., and Chowdury, A., (2009), Twitter power: Tweets as electronic word of mouth. Journal of the American society for information science and technology, 60(11), 2169-2188.
15. Java, A., Song, X., Finin, T., and Tseng, B., (2007), Why we twitter: understanding microblogging usage and communities, In Proceedings of the 9th WebKDD and 1st SNA-KDD 2007 workshop on Web mining and social network analysis (pp. 56-65), ACM.
16. Kramer, A. D., (2010), An unobtrusive behavioral model of gross national happiness, In Proceedings of the SIGCHI conference on human factors in computing systems (pp. 287-290), ACM.
17. Kwak, H., Lee, C., Park, H., and Moon, S., (2010), What is Twitter, a social network or a news media? In Proceedings of the 19th international conference on World wide web (pp. 591-600), ACM. 18. Lenhart, A., Purcell, K., Smith, A., and Zickuhr, K., (2010), Social
Media & Mobile Internet Use among Teens and Young Adults. Millennials, Pew Internet & American Life Project.
19. Makarem, S. C., and Jae, H., (2015), Consumer Boycott Behavior: An Exploratory Analysis of Twitter Feeds, Journal of Consumer Affairs. 20. Nestle, (2016), Nestle India Annual Report. Retrieved from
https://www.nestle.in/investors/stockandfinancials/documents/annual _report/01_nestle-india-annual-report-15.pdf
21. Nestle, (2016), Annual Report. Retrieved from
https://www.nestle.in/investors/documents/financial-results/financialresults-q1-2016.pdf
22. Nestle, (2016), Annual Report. Retrieved from https://www.nestle.in/investors/stockandfinancials/documents/financi alresults/financialresults_q2_2016.pdf
23. Pak, A., and Paroubek, P., (2010), Twitter as a Corpus for Sentiment Analysis and Opinion Mining, In LREc (Vol. 10, pp. 1320-1326). 24. Pang, B., and Lee, L., (2008), Opinion mining and sentiment analysis.
Foundations and trends in information retrieval, 2(1-2), 1-135. 25. Riloff, E., Patwardhan, S., and Wiebe, J., (2006), Feature
subsumption for opinion analysis, In Proceedings of the 2006 Conference on Empirical Methods in Natural Language Processing (pp. 440-448), Association for Computational Linguistics.
26. R Project, (2017), What is R? Introduction to R. Retrieved by https://www.r-project.org/about.html, accessed on 24, Dec, 2017. 27. Sebastiani, F., (2002), Machine learning in automated text
categorization, ACM computing surveys (CSUR), 34(1), 1-47. 28. Strapparava, C., and Mihalcea, R., (2008), Learning to identify
emotions in text, In Proceedings of the 2008 ACM symposium on Applied computing, pp. 1556-1560), ACM.
29. Taboada, M., Brooke, J., Tofiloski, M., Voll, K., and Stede, M., (2011), Lexicon-based methods for sentiment analysis, Computational linguistics, 37(2), 267-307.
30. Thelwall, M., Buckley, K., and Paltoglou, G., (2011), Sentiment in Twitter events. Journal of the American Society for Information Science and Technology, 62(2), 406-418.
31. The Tribune, (2015), Centre declares 9 Maggi variants unsafe, Retrieved by http://www.tribuneindia.com/news/nation/centre-declares-9-maggi-variants-unsafe/90190.html, Accessed on 21st, Dec, 2017.
32. Witten, I. H., and Frank, E., (2005), Data Mining: Practical machine learning tools and techniques, Morgan Kaufmann.
AUTHORS PROFILE
Semila Fernandes
,
Dr. Semila Fernandes holds Ph.D. in Marketing from Symbiosis International (Deemed University) and an MBA in from Pune University, an M. Phil in Management from Periyar University and a B.Sc. from Goa University. She has also completed a Postgraduate Diploma in Intellectual Property Rights from NLSIU, Bangalore. She has 14 years of teaching experience in the area of Marketing. Ms. Semila has corporate exposure from her stint at Bajaj Allianz General Insurance Company as an Executive – Direct Marketing and at ICFAI as a Regional Summer Internship Co-ordinator. Her research expertise has been in the area of consumer behaviour. A case study co-authored by Prof. Semila Fernandes has been selected as the best case in the Marketing category at ISB-Ivey Global Case Competition 2017.Another case study co-authored by Dr.Semila has been selected as thebest case in the Family Business category at EFMD Case Competition 2018 and won an Award.
Recent Publications:
Dr. Semila Fernandes, Dr. Rajesh Panda (2019), Product Conspicuousness & Reference group Influence among women: An Empirical Analysis, International Journal of Public Sector Performance Management (IJPSPM),( ABDC, Scopus)
Fernandes, S., & Panda, R. (April, 2019). Influence of Social Reference Groups on Consumer Buying Behavior: A Review. Journal of Management Research, 19(2), 131-142 (ABDC, C).
Fernandes Semila, Gupta Pooja, Jain Manish (10/2018) Automation in recruitment: a new frontier, Journal of Information Technology Teaching Cases,8(2),118-125 (listed in ABS – C category, Scopus)
Aarti Mehta Sharma
,
Dr. Aarti has completed her Ph.D, MSc (Hons) and M. Phil in Statistics. She has 6 years of experience in the Market Research industry in reputed organizations like MODE and FORE along with 13 years of teaching experience. Prof. Aarti also has corporate training experience with Wipro. Her areas of interest are the applications of decision sciences using SPSS, R and Tableau. She has publications in various journals and has presented research papers at several national and international conferences. Her current research interest is in the area of corporate governance and eco-friendly business practices. Dr.Aarti also has corporate training experience with Wipro and Infosys.Recent Publication:
Dr. Aarti Sharma, Prof. Saina Baby, (2019), Determinants of Foreign Direct Investment in Indias Service Sector, International Journal of Public Sector Performance Management (IJPSPM), (ABDC, Scopus)
Vidyasagar A
,
Prof. A. Vidyasagar has done his B. Tech (E & C) from NITK, Surathkal and PGDM from IIM, Calcutta. He is NET (UGC) qualified. He has over 30 years of experience in Sales, Marketing, Business Strategy, Corporate Planning, and Brand Consulting. He was part of the top management team in several companies across Telecom, IT and Durable sectors. He was associated with various companies like T.I. Cycles, Usha Martin Telekom, JT Mobiles, Logix Microsystems, Vertebrand and others. His teaching and research interests are in the fields of Digital Marketing, Sales and Distribution Management, Branding and Marketing strategies. A case study co-authored by Prof.Vidyasagar has won the Marketing category of ISB-Ivey Global Case Competition 2017.Recent Publications
A.Vidyasagar, Semila Fernandes & Dr. Mallika Srivastava(01/2018) Brandwidth: An Influence of Brand Associations in Gift Giving Behavior.International Journal of Research in Computer Application & Management (IJRCM), Vol no.8, Issue no.01 pg no. 5-10(ISSN:2231-1009) Semila Fernandes, Srijani Chaudhuri and A. Vidyasagar (03/2017) Success Crowns Cadbury Dairy Milk: Brand and Culture Analysis. International Journal of Business and Economic Research, 15(2): 177-189 (Scopus ISSN: 0972-7302).