White Rose Research Online URL for this paper:
http://eprints.whiterose.ac.uk/149176/
Version: Accepted Version
Proceedings Paper:
Alharbi, H, Elgorashi, T and Elmirghani, J (2019) Energy Efficient Virtual Machine Services
Placement in Cloud-Fog Architecture. In: 2019 21st International Conference on
Transparent Optical Networks (ICTON). International Conference on Transparent Optical
Networks 2019, 09-13 Jul 2019, Angers, France. IEEE . ISBN 9781728127798
https://doi.org/10.1109/ICTON.2019.8840258
©2019 IEEE. Personal use of this material is permitted. Permission from IEEE must be
obtained for all other uses, in any current or future media, including reprinting/republishing
this material for advertising or promotional purposes, creating new collective works, for
resale or redistribution to servers or lists, or reuse of any copyrighted component of this
work in other works.
[email protected] https://eprints.whiterose.ac.uk/ Reuse
Items deposited in White Rose Research Online are protected by copyright, with all rights reserved unless indicated otherwise. They may be downloaded and/or printed for private study, or other acts as permitted by national copyright laws. The publisher or other rights holders may allow further reproduction and re-use of the full text version. This is indicated by the licence information on the White Rose Research Online record for the item.
Takedown
If you consider content in White Rose Research Online to be in breach of UK law, please notify us by
VMs can be migrated or replicated over geo-distributed physical machines for load balancing and energy efficiency. In this work, we investigate the offloading of VM services from the cloud to the fog considering the British Telecom (BT) network topology. The analysis addresses the impact of different factors including the VM workload and the proximity of fog nodes to users considering the data rate of state-of-the-art applications. The results show that the optimum placement of VMs significantly decreases the total power consumption by up to 75% compared to a single cloud placement.
Index Terms— Fog computing, IP over WDM network, energy efficiency, virtual machine, VM workload
I. INTRODUCTION
Cloud computing is an immensely successful on-demand computing paradigm that provides ubiquitous access to a shared pool of compute, storage, and communication resources to a large set of geographically distributed users. According to Cisco [1], in 2017, the total clouds traffic was 75% of all United Kingdom (UK) Internet traffic. A further growth is projected within the approaching years as the total cloud computing traffic is expected to be 91% of the total traffic by 2022. This proliferation in data volume and processing requests raise the needs for a new breed of on-demand computing. Fog computing [2] is proposed by academia and industry in order to complement the cloud by extending processing, networking and storage resources of clouds to the edge of the network bringing them closer to the users.
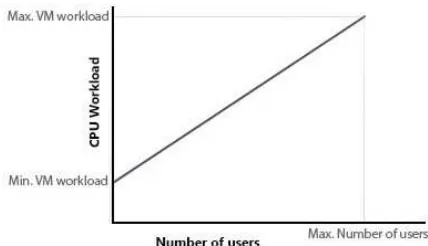
Clouds and fog employ virtual machines (VMs) for efficient resource utilization [3], [4]. In order to achieve the most of the efficient environment, VMs can be migrated or replicated over geo-distributed physical machines in order to achieve different features such as load balancing and energy efficiency [6] or due to machines maintenance. The workload of VMs has been intensively investigated in the in the literature. They found that the relationship between the VM workload and the number of user typically follows a linear profile as shown in Fig. 1. The minimum VM workload required to serve users varies from as low as 1% in data-intensive applications to 40% in CPU-intensive applications [7] - [9].
Research efforts have focused on using fog computing to address the challenges facing cloud computing. In terms of QoS, a mathematical model of fog computing was developed in [10] to investigate the possibility of reducing the latency of IoT applications. In [11], the authors considered improving websites performance by connecting users to the Internet via fog servers. A number of papers in the literature investigated the energy efficiency of fog architecture. The authors in [12] built a theoretical model of the fog computing architecture and compared it with conventional cloud computing. The authors in [13] compared the energy consumption of applications run on a centralized cloud with their energy consumption when hosted in the fog. Their results showed that the energy efficiency of fog computing is determined by a number of factors including; the energy efficiency of the access network, the power profile of fog servers and the application type in terms of the number of downloads, the number of updates and the amount of data pre-loading.
Figure 1: Linear relationship between VM workload and number of users.
Figure 2: Cloud-Fog architecture.
II.
C
LOUD-F
OGA
RCHITECTUREIn order to determine the optimal placement of different VMs types, we built a MILP model considering different tiers of cloud and fog resources. As shown in Fig. 2, a typical telecom network consists of three layers; core, metro and access network. The core network represents the backbone infrastructure of any telecom network as it interconnects major cities. IP over WDM [35] technology is widely deployed in core network due to its ability to provide high capacity and scalability. Each core node is connected to a metro network. The metro network provides direct connectivity between residential users and the core network node. The access network represents the last mile of the telecom network and connects the telecom office to end-users. Passive optical networks (PON) are the main technology deployed recently in access networks. It has two active components; Optical Line Terminal (OLT), located at the telecom office, and Optical Network Unit (ONU), located close to end-users.
In cloud-fog architecture, clouds provide a centralized computing solution to end users. Cloud data centers are connected to IP routers in a core node. Fog computing extends clouds into the network edge. In our work, we consider fog nodes deployed in both the metro and access networks. Metro fog nodes are connected to metro edge routers and can serve users of different access networks. The access fog nodes which are connected to the OLTs, provide a smaller scale coverage by serving only users in their access network.
III.
VM
SP
LACEMENTM
ODELR
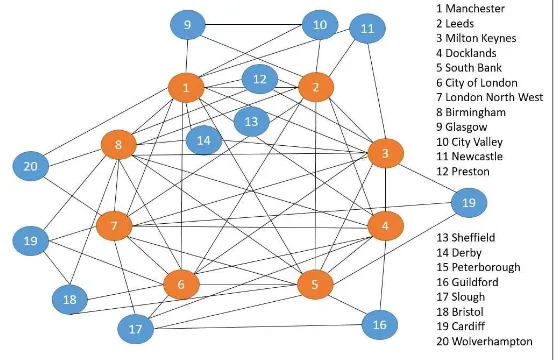
ESULTSWe investigated the optimal VMs placement over the BT network topology [36] as a core network example (illustrated in Fig. 3). The BT core network topology consists of 20 nodes and 68 bidirectional links. In the considered architecture each core node is connected to two XGPON access networks through a metro network consisting of a single Ethernet switch and two edge routers.
quality [44]. Tables I and II show the input parameters of the cloud-fog architecture model. Note that, we considered on-off power consumption profile for the different components in the architecture.
The optimized VMs placement over the cloud-fog architecture, referred to as Optimized clouds and fogs placements (OC&F)
[image:4.612.168.447.266.446.2]approach. It is compared to the Optimized clouds (OC) approach where VMs are optimally placed in clouds distributed over the core network. It is also compared to the single clouds (SC) where the VMs are placed in node 6 (City of London). Node 6 is selected to host the cloud in SC approach as major cloud operators base their central cloud in the UK in London (e.g. Microsoft Azure [45], Amazon AWS [46] and Google Cloud [47]).
Figure 3: BT core network topology.
TABLE I
NETWORK INPUT PARAMETERS OF THE MODEL 40 Gbps router port power consumption 638 Watt [48] 40 Gbps transponder power consumption 129 W [49]
40 Gbps regenerator power consumption 114 Watt, reach 2000 km [50] EDFA power consumption 11 Watt [51]
Optical switch power consumption 85 W [52] Number of wavelengths in a fiber 32 [53] Bit rate of each wavelength 40 Gbps [53] Span distance between two EDFAs 80 km [51] Network power usage effectiveness 1.5 [6] Aggregation router redundancy 2
40 Gbps aggregation router port power consumption 30 Watt [54] 600 Gbps metro ethernet switch power consumption 470 W [55] Number of PON network in a node 2
Number of network users 800 concurrent users per VM. Number of ONU devices in a PON network 512
CLOUDS AND FOG INPUT PARAMETERS OF THE MODEL User download rate {1, 10 and 25 Mbps} 600 Gbps cloud and metro fog switch power
consumption
470 W [55]
240 Gbps access fog switch power consumption
210 W [55]
Cloud and fog switch redundancy 2 40 Gbps cloud router port power consumption
30 Watt [54]
40 Gbps metro and access fog router port power consumption
13 Watt [54]
Best practice cloud power usage effectiveness
1.3 [57]
Best practice metro fog power usage effectiveness
1.4 [57]
Best practice access fog power usage effectiveness
1.5 [57]
Number of VMs services 300
VMs popularity Group 16%, 5%, 2%, 1%, 0.5% and 0.05%
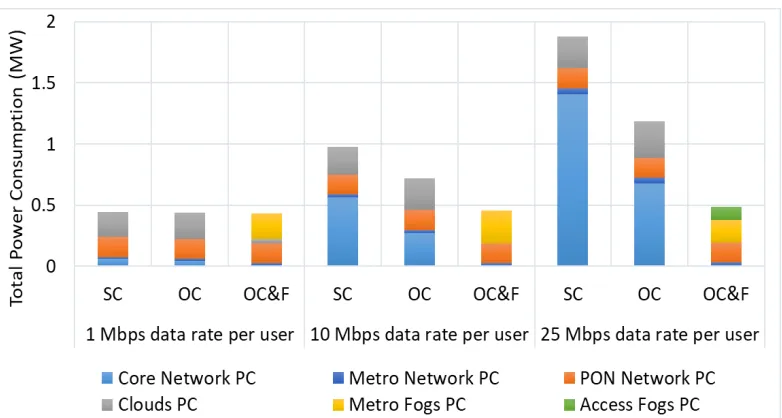
Figure 4 shows the power consumption resulting from placing the VMs described above considering the different placement approaches under different users’ data rates as explained above. The total power savings achieved under the OC&F approach compared to the single cloud scenario are 5%, 48% and 75%, under 1 Mbps, 10 Mbps and 25 Mbps user data rates, respectively. Figure 5 shows the optimal VMs placement under OC&F approach. Note that the different colors show if a VM of certain popularity is placed in this location or not. Figure 5(a) shows that the cloud in node 2 is selected to serve distributed users of VMs of 1 Mbps users data rate and 0.05% popularity. VMs of a popularity of and higher are replicated in every metro fog location except in node 2. Users in node 2 access VMs of 0.5%-16% popularity in the cloud located in node 2 to avoid setting another computing locations in node 2 as we consider on-off power profile. Under the 10 Mbps user data rate, VMs of every popularity group are fully offloaded to metro fog nodes as shown in Fig. 6(b). Under the 25 Mbps user data rate, VMs of popularity have justified creating a replica copy in each access fog node. Other VMs of popularity and less are offloaded to metro fog nodes. All of the decisions / outcomes described are a function of the relationship between the network and processing parameters considered.
Figure 4: The power consumption of different VMs placement approaches considering VMs of 1% minimum CPU workload.
[image:5.612.112.503.411.620.2]
(a) (b)
[image:6.612.124.494.63.335.2](c)
Figure 5: The optimal placement of different VMs popularity groups with 1% minimum CPU workload under the OC&F approach with (a) 1 Mbps data rate per user, (b) 10 Mbps data rate per user and (c) 25 Mbps data rate per user.
IV. CONCLUSION
Cloud and Fog computing rely on virtual machines (VMs) in order to efficiently use their physical resources. In this paper, we presented a framework for energy efficient VMs placement over a Cloud-Fog architecture. The results show that the decision of offloading VMs to fog nodes is a function of different factors including the workload of the VM, the proximity of fog nodes to users, the VM popularity and the users data rates. Our results showed that optimal VMs placement over a cloud-Fog architecture can save up to 75% of the total power consumption compared to a single cloud scenario.
Acknowledgments
The authors would like to acknowledge funding from the Engineering and Physical Sciences Research Council (EPSRC), INTERNET (EP/H040536/1) and STAR (EP/K016873/1) projects. The first author would like to acknowledge the Government of Saudi Arabia and Taibah University for funding his PhD scholarship. All data are provided in full in the results section of this paper.
REFERENCES 1. Cisco, “VNI Complete Forecast Highlights United Kingdom,” 2018.
2. S. Antonio, “Cisco Delivers Vision of Fog Computing to Accelerate Value from Billions of Connected Devices,” Cisco, 2014. [Online]. Available: https://newsroom.cisco.com/press-release-content?articleId=1334100. [Accessed: 27-Sep-2017].
3. R. Wasim et al., “A surveyon virtual machine migration and server consolidation frameworks for cloud data centers,” J. Netw. Comput. Appl., vol. 52, pp. 11–25, 2015.
4. A. Manzalini, R. Minerva, and T. Italia, “Clouds of Virtual Machines in Edge Networks,” IEEE Commun. Mag., no. July, pp. 63–70, 2013.
5. J. M. H. Elmirghani et al., “GreenTouch GreenMeter Core Network Energy-Efficiency Improvement Measures and Optimization,” J. Opt. Commun. Netw., vol. 10, no. 2, p. A250, 2018.
6. A. Q. Lawey, T. E. H. El-Gorashi, and J. M. H. Elmirghani, “Distributed energy efficient clouds over core networks,” J. Light. Technol., vol. 32, no. 7, pp. 1261–1281, 2014.
7. P. Padala, X. Zhu, Z. Wang, S. Singhal, and K. G. Shin, “Performance Evaluation of Virtualization Technologies for Server Consolidation,” 2007. 8. A. Bharambe, J. Pang, and S. Seshan, “Colyseus : A Distributed Architecture for Online Multiplayer Games,” in USENIX Association - NSDI ’06: 3rd
Symposium on Networked Systems Design & Implementation 155, 2006, pp. 155–168.
9. P. R. M. Vasconcelos, G. A. D. A. Freitas, G. A. De Araujo, and T. G. Marques, “Virtualization technologies in web conferencing systems: A performance overview,” 2016 11th Int. Conf. Internet Technol. Secur. Trans. ICITST 2016, pp. 376–383, 2017.
10. S. Sarkar, S. Chatterjee, and S. Misra, “Assessment of the Suitability of Fog Computing in the Context of Internet of Things,” IEEE Trans. Cloud Comput., vol. 6, no. 1, pp. 46–59, 2018.
11. J. Zhu, D. S. Chan, M. S. Prabhu, P. Natarajan, H. Hu, and F. Bonomi, “Improving Web Sites Performance Using Edge Servers in Fog Computing Architecture,” in IEEE Seventh International Symposium on Service-Oriented System Engineering Improving, 2013.
vol. 34, no. 5, pp. 1728–1739, 2016.
14. H. A. Alharbi, M. Musa, T. E. H. El-Gorashi, and J. M. H. Elmirghani, “Real-Time Emissions of Telecom Core Networks,” in International Conference on Transparent Optical Networks, 2018, vol. 2018–July, pp. 1–5.
15. L. Nonde, T. E. H. El-Gorashi, and J. M. H. Elmirghani, “Energy Efficient Virtual Network Embedding for Cloud Networks,” J. Light. Technol., vol. 33, no. 9, pp. 1828–1849, 2015.
16. N. I. Osman, T. El-gorashi, L. Krug, and J. M. H. Elmirghani, “Energy-Efficient Future High-Definition TV,” vol. 32, no. 13, pp. 2364–2381, 2014. 17. X. Dong, T. El-Gorashi, and J. M. H. Elmirghani, “Green IP over WDM networks with data centers,” J. Light. Tech., vol. 29, no. 12, pp. 1861–1880,
2011.
18. B. Bathula, M. Alresheedi, and J.M.H. Elmirghani, “Energy efficient architectures for optical networks,” Proc IEEE London Communications Symposium, London, Sept. 2009.
19. J. M. H. Elmirghani, L. Nonde, A. Q. Lawey, T. E. H. El-Gorashi, M. O. I. Musa, X. Dong, K. Hinton, and T. Klein, "Energy efficiency measures for future core networks," in 2017 Optical Fiber Communications Conference and Exhibition (OFC), March 2017, pp. 1-3.
20. B. Bathula, and J.M.H. Elmirghani, “Energy Efficient Optical Burst Switched (OBS) Networks,” IEEE GLOBECOM’09, Honolulu, Hawaii, USA, November 30-December 04, 2009.
21. X. Dong, T.E.H. El-Gorashi and J.M.H. Elmirghani, “Green Optical OFDM Networks,” IET Optoelectronics, vol. 8, No. 3, pp. 137 – 148, 2014. 22. A. Lawey, T.E.H. El-Gorashi, and J.M.H. Elmirghani, “BitTorrent Content Distribution in Optical Networks,” IEEE/OSA Journal of Lightwave
Technology, vol. 32, No. 21, pp. 3607 – 3623, 2014.
23. A.N. Al-Quzweeni, A. Lawey, T.E.H. El-Gorashi, and J.M.H. Elmirghani, “Optimized Energy Aware 5G Network Function Virtualization,” IEEE Access, vol. 7, 2019.
24. M.S. Hadi, A. Lawey, T.E.H. El-Gorashi, and J.M.H. Elmirghani, “Patient-Centric Cellular Networks Optimization using Big Data Analytics,” IEEE Access, vol. 7, 2019.
25. H. A. Alharbi, T. E. H. El-gorashi, A. Q. Lawey, and J. M. H. Elmirghani, “Energy Efficient Virtual Machines Placement in IP over WDM Networks,” in 19th International Conference on Transparent Optical Networks, 2017, pp. 1–4.M.
26. Musa, T. Elgorashi, and J. Elmirghani, “Energy Efficient Survivable IP over WDM Networks with Network Coding,” J. Opt. Commun. Netw., vol. 10, no. 5, pp. 1–12, 2018.
27. X. Dong, T. E. H. El-Gorashi, and J. M. H. Elmirghani, “On the energy efficiency of physical topology design for IP over WDM networks,” J. Light. Technol., vol. 30, no. 12, pp. 1931–1942, 2012.
28. X. Dong, T. El-Gorashi, and J. M. H. Elmirghani, “IP over WDM networks employing renewable energy sources,” J. Light. Technol., vol. 29, no. 1, pp. 3–14, 2011.
29. M. Musa, T. Elgorashi, and J. Elmirghani, “Energy efficient survivable IP-Over-WDM networks with network coding,” J. Opt. Commun. Netw., vol. 9, no. 3, pp. 207–217, 2017.
30. M. O. I. Musa, T. E. H. El-Gorashi, and J. M. H. Elmirghani, “Bounds on GreenTouch GreenMeter Network Energy Efficiency,” J. Light. Technol., vol. 36, no. 23, pp. 5395–5405, 2018.
31. H. M. M. Ali, T. E. H. El-Gorashi, A. Q. Lawey, and J. M. H. Elmirghani, “Future Energy Efficient Data Centers with Disaggregated Servers,” J. Light. Technol., vol. 35, no. 24, pp. 5361–5380, 2017.
32. M. Musa, T. Elgorashi, and J. Elmirghani, “Energy Efficient Survivable IP-Over-WDM Networks With Network Coding,” J. Opt. Commun. Netw., vol. 9, no. 3, p. 207, 2017.
33. M. Musa, T. Elgorashi, and J. Elmirghani, “Bounds for Energy-Efficient Survivable IP Over WDM Networks With Network Coding,” J. Opt. Commun. Netw., vol. 10, no. 5, p. 471, 2018.
34. A. M. Al-Salim, A. Q. Lawey, T. E. H. El-Gorashi, and J. M. H. Elmirghani, “Energy Efficient Big Data Networks: Impact of Volume and Variety,”
IEEE Trans. Netw. Serv. Manag., vol. 15, no. 1, pp. 458–474, 2018.
35. G. S. G. Shen and R. S. Tucker, “Energy-Minimized Design for IP Over WDM Networks,” IEEE J. Opt. Com. Netw., vol. 1, no. 1, pp. 176–186, 2009. 36. AT&T, “AT&T’s 38 Global Internet Data Centers.” [Online]. Available: https://www.business.att.com/content/productbrochures/eb_idcmap.pdf.
[Accessed: 15-Aug-2018].
37. ZTE CORPORATION, “ZXA10 C300 Hardware Description,” 2013. [Online]. Available: http://enterprise.zte.com.cn/en/products/network_ lnfrastructure/broadband_access/xpon_onu/201312/t20131209_414454.html. [Accessed: 15-Mar-2017].
38. Cisco, “United States - 2021 Forecast Highlights,” 2018. 39. “Similar Web,” 2018.
40. L. A. Adamic and B. A. Huberman, “Zipf’s law and the Internet,” Glottometrics, vol. 3, no. 1, pp. 143–150, 2002.
41. E. S. Mi, Ningfang, N Giuliano Casale, Ludmila Cherkasova, “Injecting Realistic Burstiness to a Traditional Client-Server Benchmark,” in ICAC’09, 2009, pp. 15–19.
42. Cisco, “Cisco Global Cloud Index : Forecast and Methodology , 2016–2021,” 2018.
43. YouTube, “Live encoder settings, bitrates, and resolutions,” YouTube Help, 2017. [Online]. Available: https://support.google.com/youtube/answer/2853702.
44. Netflix, “Internet Connection Speed Recommendations,” Netflix Help Center, 2014. [Online]. Available: https://help.netflix.com/en/node/306. [Accessed: 27-Jan-2018].
45. Microsoft, “Azure locations.” [Online]. Available: https://azure.microsoft.com/en-us/global-infrastructure/locations/. [Accessed: 23-Jan-2019]. 46. Amazon, “London in the Cloud.” [Online]. Available: https://aws.amazon.com/london/. [Accessed: 23-Jan-2019].
47. Google Cloud, “Cloud locations.” [Online]. Available: https://cloud.google.com/about/locations/. [Accessed: 23-Jan-2019]. 48. Cisco System, “Cisco CRS-1 4-Slot Single-Shelf System,” 2014.
49. Cisco System, “Cisco ONS 15454 40 Gbps CP-DQPSK Full C-Band Tuneable Transponder Card.” 50. Oclaro, “OTS-4400 Regenerator,” 2014.
51. MRV, “EDFA Optical Amplifiers,” 2012.
52. “Intelligent Optical System 600,” Glimmerglass, 2013. [Online]. Available: http://www.glimmerglass.com/ products/intelligent-optical-systems/. [Accessed: 16-Mar-2017].
53. “GreenTouch Green Meter Research Study : Reducing the Net Energy Consumption in Communications Networks by up to 90 % by 2020,” White Pap., pp. 1–25, 2015.
54. Cisco, “Cisco Network Convergence System 5500 Series Data Sheet,” pp. 1–11, 2018. 55. Cisco Systems, “Cisco Nexus 9300-EX and 9300-FX Platform Switches,” 2018.
56. C. Gray, R. Ayre, K. Hinton, and R. S. Tucker, “Power consumption of IoT access network technologies,” in 2015 IEEE International Conference on
Communication Workshop (ICCW), 2015, pp. 2818–2823.