Int. J. Electrochem. Sci., 14 (2019) 2126 – 2135, doi: 10.20964/2019.03.22
International Journal of
ELECTROCHEMICAL
SCIENCE
www.electrochemsci.org
Effect of Quenching and Tempering Temperature on Corrosion
Behavior of Boron Steels in 3.5 wt.% NaCl Solution
Gürkan Aydın1, Aysel Yazıcı2, *
1 Department of Mechanical Engineering, Manisa Celal Bayar University, Graduate School of Natural
and Applied Sciences, 45140, Yunusemre-Manisa, Turkey.
2 Correspond author, Department of Machine and Metal Technologies, Manisa Celal Bayar University, 45400, Turgutlu-Manisa, Turkey.
*E-mail: [email protected]
Received: 1December 2018/ Accepted: 7 January 2019 / Published: 7February 2019
This study was carried out to examine the impact of austenitization and tempering temperatures on the corrosion characteristics of boron steels. Boron steel samples were austenitized at 850 °C, 900 °C, and 950 °C, and then quenched in environmental water. After quenching, the samples were tempered at 150 °C, 300 °C, and 450 °C for 30 minutes to prepare specimens. The corrosion characteristics of quenched and tempered boron steels in a 3.5 wt.% NaCl solution were examined using Tafel extrapolation method. Significant statistical differences have been observed between the tested boron steels in terms of corrosion rate. Changing C concentration affected the corrosion rates of boron steels after their immersion into a 3.5 wt% NaCl solution and increasing C content generally accelerated the corrosion rate. A poor correlation has been found between average ferrite grain size and corrosion rate under the examined heat treatment conditions for tested boron steels.
Keywords: Boron steel corrosion rate, heat treatment, Tafel extrapolation, electrochemical parameters, ferrite grain size.
1. INTRODUCTION
Boron steels are extensively used in different industrial applications such as automotive, mining, agricultural machinery sectors, and many others. Boron steels provide important advantages of better extrudability and machinability in comparison with boron-free steels of equivalent hardness [1,2]. Steels with boron content are also less susceptible to quench cracking and distortion during heat treatment [3].
alloying elements such as C, Si, and Mn affect the corrosion kinetics of steel by changing the corrosion potential of Fe [4,5]. Austenitizing temperature determines the amount and distribution of retained austenite (γ-ferrite) and undissolved carbides [6] as well as grain coarsening.In the matrix composition of carbon steel, lower corrosion rates characterize the matrices consisting of metastable single phases (including bainite and martensite ones) rather than the equilibrium multiphase (including ferrite pearlite) [7,8]. Dissimilar phase morphologies in the steel matrix are able to generate a galvanic couple, and an electropotential difference between dissimilar phases ensures an extra driving force for the accelerated assault of the steel surface by dissolved ions/atoms, and this also negatively affects the corrosion resistance of steel [9-11]. On the other hand, results contrary to the proposed explanation have also been reported. The corrosion potential for a coupled ferrite-bainite microstructure was found to be lower than ferrite microstructure for low-alloy carbon steels in a 3.5 wt% NaCl solution [12]. In terms of grain size on corrosion rate, it was reported that structures with finer grains are more susceptible to corrosion compared to structures with more coarse grains since they have more grain boundaries with higher energy levels. The grain boundaries are more active than the surrounding bulk of the grains, and a reduction in the grain boundary density decreases the total activity of the metal [13]. As it is understood from the literature results, the corrosion mechanism is quite complicated, and the corrosion behavior of materials should be clarified both experimentally and theoretically.
The present study aims to investigate the relationship between microstructure, phase fraction, and corrosion behavior of boron steels in a 3.5 wt.% NaCl solution for different quenching and tempering temperatures.
2. MATERIAL AND METHODS
The nominal chemical composition of steel samples was determined by a BRUKER Q4 TASMAN metal spectrometer and is summarized in Table 1.
Table 1. The chemical composition (wt.%) of experimental steels (Fe balanced)
Material C Si Mn P S Cr Mo Ni Cu Al Ti B
no.1 0.343 0.222 1.279 0.017 <0.0005 0.211 0.013 0.043 0.019 0.041 0.040 0.0012 no.2 0.290 0.258 1.277 0.015 <0.0005 0.218 0.011 0.046 0.017 0.039 0.042 0.0011 no.3 0.241 0.214 0.954 0.010 <0.0005 0.347 0.161 0.213 0.725 0.142 0.102 0.0015
Boron alloyed steel samples were austenitized in a furnace at 850 °C, 900 °C, and 950 °C for 24 or 25 minutes depending on their thickness (soak time = 20 + thickness/2), and then they were quenched in environmental water. After quenching, these samples were tempered at 150 °C, 300 °C, and 450 °C for 30 minutes to prepare specimens.
were investigated by a NIKON EPIPHOT 200 image analyzer optical microscope using the NIS- ELEMENTS software. The average grain size of the investigated samples was determined by the linear intercept procedure according to the ASTM E112-12 standard [14].
The samples exposed to the metal spectrometer, electrochemical tests, and X-ray diffraction measurement were also prepared in the same way as the samples prepared for microstructure examination but differently they were not etched. X-ray diffraction measurements were performed with Cr-Kα radiation, and the volume percent of retained austenite was determined at a voltage of 40 kV and a current of 40 mA in accordance with ASTM E975-13 [15]. The scanning angle was (2θ, °), the range 75–170°, the step width 0.025°, and the scanning rate 0.5° min-1. The volume fraction of retained austenite was calculated from the obtained X-ray diffraction profile using Rietveld analysis [16,17].
Electrochemical tests were conducted using an Autolab PGSTAT128N Potansiyostat-Galvanostat and NOVA 1.10 software. For the electrochemical measurements, a three-electrode cell was used. In the test setup, the tested samples with a 6 cm diameter and an exposed area of 7.065 cm2 were used as the working electrode. A platinum wire was used as the counter electrode while an Ag/AgCl electrode was used as the reference electrode. Current–potential curves were recorded at a potential scan rate of 1 mV s-1 in 3.5 wt.% NaCl solution and in a potential range between -800 to -300 mV relative to the Ag/AgCl electrode. The Tafel extrapolation method was used to acquire the corrosion current density and other electrochemical parameters [18-20].
The reproducibility of data was verified by repeating the test three times. The analysis of variance (ANOVA) in accordance with the randomized block design was applied on the corrosion rate and average grain size data recorded in this experiment. Tukey-Q range test was used for the purpose of comparing the mean results with a threshold of 99% (P<0.01). Linear regression analysis was carried out between average ferrite grain size and corrosion rate of heat-treated samples.
3. RESULTS
Since the carbon content rate in the structure of the tested low-alloy steels was below than 0.4%, the possibility of residual austenite presence in the structure after heat treatment was very low. As a result of X-ray diffraction measurements, the volume fraction of retained austenite was found to be very low (below 3 vol.%) for the tested specimens. Under the heat treatment condition of 850 °C Q + 150 °C T, the volume fraction of the retained austenite for the material 1, 2 and 3 was found to be 1.0 ± 0.8%, 0.9 ± 0.8%, and 0.8 ± 0.6% respectively.
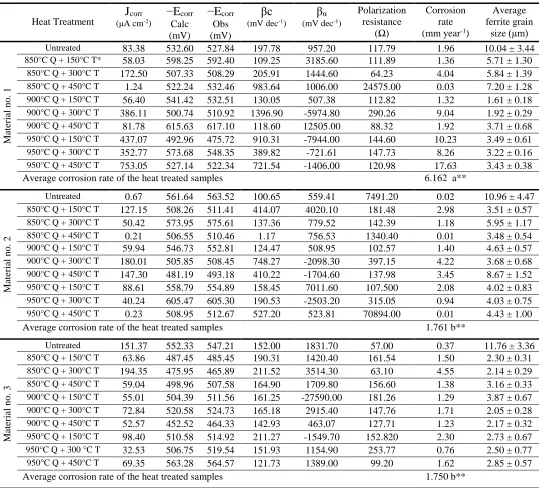
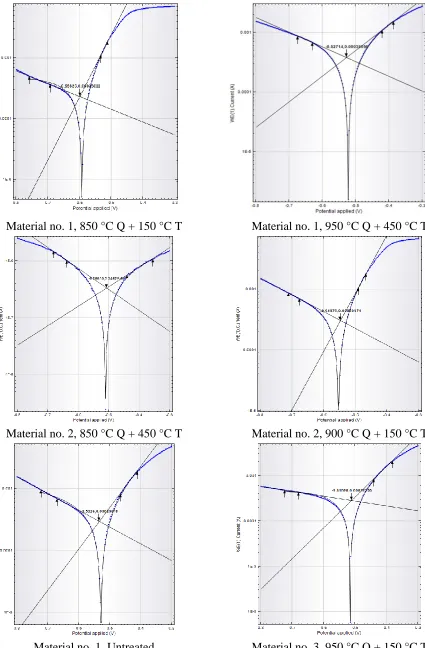
The corrosion test results including corrosion current density Jcor (μA cm-2), corrosion potential Ecorr (mV), cathodic Tafel slope (βc, mV dec-1), anodic Tafel slopes (βα, mV dec-1), polarization
resistance (Ω), corrosion rate (mm year-1), average ferrite grain size (μm) and average corrosion rate of
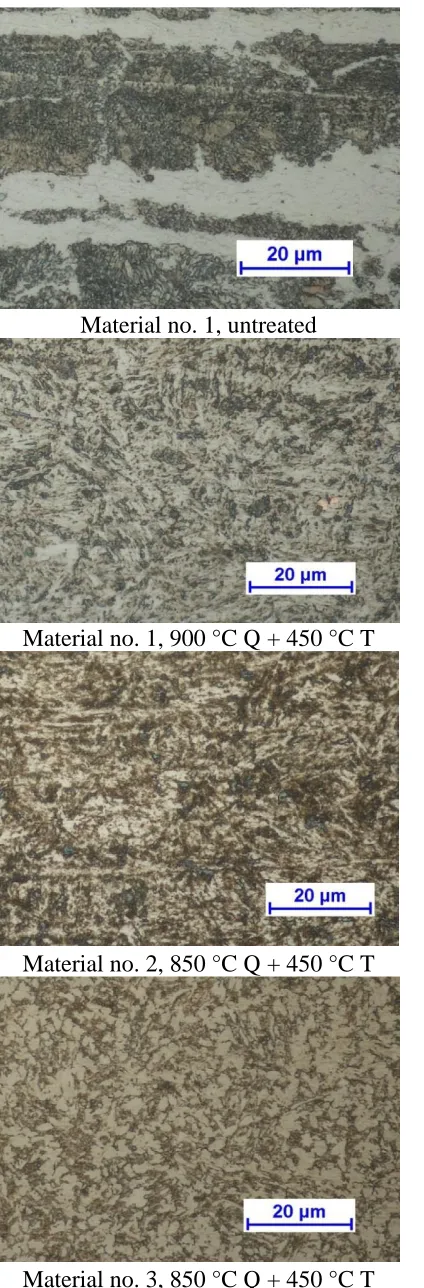
The polarization curves of some tested samples are given in Figure 1 while Figure 2 shows the microstructure of some tested samples by optical microscopy, etched with Nital 2.
4. DISCUSSION
As can be seen in Table 2, the higher polarization resistance and lower corrosion current showed a better corrosion resistance for samples. The corrosion potential (Ecorr) shows the corrosion tendency rather than corrosion rate. The corrosion rate is proportional to corrosion current density. Change in one or both of the anodic and cathodic reactions determines the change in corrosion potential. For instance, it is possible to attribute the increasing corrosion potential to a decrease in the anodic reaction along with the growth of a passive film or the increase in the cathodic reaction with an increase in dissolved oxygen. It is possible to attribute the decreasing corrosion potential to an increase in the anodic reaction or a decrease in the cathodic reaction. Thus, the corrosion potential is frequently monitored during the experiments [21].
Table 2. Electrochemical kinetic parameters of Tafel polarization curves of the samples immersed in the 3.5 wt.% NaCl solution, and also average ferrite grain size and average corrosion rate of the heat treated samples
Heat Treatment
Jcorr
(μA cm-2)
−Ecorr Calc (mV) −Ecorr Obs (mV) βc (mV dec-1)
βα
(mV dec-1)
Polarization resistance
(Ω)
Corrosion rate (mm year-1)
Average ferrite grain size (μm) Ma ter ial n o . 1
Untreated 83.38 532.60 527.84 197.78 957.20 117.79 1.96 10.04 ± 3.44
850°C Q + 150°C T* 58.03 598.25 592.40 109.25 3185.60 111.89 1.36 5.71 ± 1.30
850°C Q + 300°C T 172.50 507.33 508.29 205.91 1444.60 64.23 4.04 5.84 ± 1.39
850°C Q + 450°C T 1.24 522.24 532.46 983.64 1006.00 24575.00 0.03 7.20 ± 1.28
900°C Q + 150°C T 56.40 541.42 532.51 130.05 507.38 112.82 1.32 1.61 ± 0.18
900°C Q + 300°C T 386.11 500.74 510.92 1396.90 -5974.80 290.26 9.04 1.92 ± 0.29
900°C Q + 450°C T 81.78 615.63 617.10 118.60 12505.00 88.32 1.92 3.71 ± 0.68
950°C Q + 150°C T 437.07 492.96 475.72 910.31 -7944.00 144.60 10.23 3.49 ± 0.61
950°C Q + 300°C T 352.77 573.68 548.35 389.82 -721.61 147.73 8.26 3.22 ± 0.16
950°C Q + 450°C T 753.05 527.14 522.34 721.54 -1406.00 120.98 17.63 3.43 ± 0.38
Average corrosion rate of the heat treated samples 6.162 a**
Ma ter ial n o . 2
Untreated 0.67 561.64 563.52 100.65 559.41 7491.20 0.02 10.96 ± 4.47
850°C Q + 150°C T 127.15 508.26 511.41 414.07 4020.10 181.48 2.98 3.51 ± 0.57
850°C Q + 300°C T 50.42 573.95 575.61 137.36 779.52 142.39 1.18 5.95 ± 1.17
850°C Q + 450°C T 0.21 506.55 510.46 1.17 756.53 1340.40 0.01 3.48 ± 0.54
900°C Q + 150°C T 59.94 546.73 552.81 124.47 508.95 102.57 1.40 4.63 ± 0.57
900°C Q + 300°C T 180.01 505.85 508.45 748.27 -2098.30 397.15 4.22 3.68 ± 0.68
900°C Q + 450°C T 147.30 481.19 493.18 410.22 -1704.60 137.98 3.45 8.67 ± 1.52
950°C Q + 150°C T 88.61 558.79 554.89 158.45 7011.60 107.500 2.08 4.02 ± 0.83
950°C Q + 300°C T 40.24 605.47 605.30 190.53 -2503.20 315.05 0.94 4.03 ± 0.75
950°C Q + 450°C T 0.23 508.95 512.67 527.20 523.81 70894.00 0.01 4.43 ± 1.00
Average corrosion rate of the heat treated samples 1.761 b**
Ma ter ial n o . 3
Untreated 151.37 552.33 547.21 152.00 1831.70 57.00 0.37 11.76 ± 3.36
850°C Q + 150°C T 63.86 487.45 485.45 190.31 1420.40 161.54 1.50 2.30 ± 0.31
850°C Q + 300°C T 194.35 475.95 465.89 211.52 3514.30 63.10 4.55 2.14 ± 0.29
850°C Q + 450°C T 59.04 498.96 507.58 164.90 1709.80 156.60 1.38 3.16 ± 0.33
900°C Q + 150°C T 55.01 504.39 511.56 161.25 -27590.00 181.26 1.29 3.87 ± 0.67
900°C Q + 300°C T 72.84 520.58 524.73 165.18 2915.40 147.76 1.71 2.05 ± 0.28
900°C Q + 450°C T 52.57 452.52 464.33 142.93 463.07 127.71 1.23 2.17 ± 0.32
950°C Q + 150°C T 98.40 510.58 514.92 211.27 -1549.70 152.820 2.30 2.73 ± 0.67
950°C Q + 300 °C T 32.53 506.75 519.54 151.93 1154.90 253.77 0.76 2.50 ± 0.77
950°C Q + 450°C T 69.35 563.28 564.57 121.73 1389.00 99.20 1.62 2.85 ± 0.57
Average corrosion rate of the heat treated samples 1.750 b**
*: Q: Quenching, T: Tempering
Material no. 1, 850 °C Q + 150 °C T Material no. 1, 950 °C Q + 450 °C T
Material no. 2, 850 °C Q + 450 °C T Material no. 2, 900 °C Q + 150 °C T
[image:6.596.83.508.71.719.2]Material no. 1, Untreated Material no. 3, 950 °C Q + 150 °C T
Material no. 1, untreated Material no. 1, 900 °C Q + 150 °C T
Material no. 1, 900 °C Q + 450 °C T Material no. 1, 950 °C Q + 450 °C T
Material no. 2, 850 °C Q + 450 °C T Material no. 2, 950 °C Q + 450 °C T
[image:7.596.64.276.67.711.2]Material no. 3, 850 °C Q + 450 °C T Material no. 3, 900 °C Q + 150 °C T
As can be seen from Figure 2, the microstructure of the quenched and tempered samples is tempered martensite and consists of dark iron carbides particles distributed randomly within the light α-ferrite matrix main phase. The microstructure of untreated samples consisted of α-ferrite (white) and pearlite (dark). In the evaluation of corrosion rate, due to the fact that the retained austenite phase was very low (below 3 vol.%) for the quenched and tempered samples tested by XRD, the volume fraction of retained austenite (γ Fe phase) was not taken into consideration [17]. It is well known that the microstructure occurring after heat treatments affects the electrochemical characteristics of the material. Between the ferrite and cementite phases, the formation of microgalvanic cells occurs (ferrite behaves as an anodic site while cementite behaves as a cathode) which influences the kinetics of the corrosion process [7,25]. As can be seen from the literature, size and distribution of cementite can affect the adherence of passive film [7], cementite may play a negative role by accelerating corrosion by the galvanic action [25], and the adherence of the corrosion film and hence its protectiveness are often related to the presence of cementite and its morphology such as lamellar, globular [23]. Although it is known that the alloying elements in the materials may affect the carbide formation, total Fe3C quantity
can be approximately estimated from the Fe-Fe3C equilibrium phase diagram using the lever rule. Fe3C
quantities of material no. 1, 2 and 3 (investigated low-alloy steel materials) are found to be 5.03%, 4.23%, and 3.50% respectively. The amount and distribution of cementite acting as a cathode in the microstructure affected the corrosion resistance and in general the highest corrosion rate occurred in material no. 1.
After heat treatment, the average ferrite grain size values were between 1.61-7.20 µm for material no.1, 3.48-8.67 µm for material no.2, and 2.05-3.87 µm for material no.3 (see Table 2). For the corrosion rate and average ferrite grain size values after heat treatment, as a result of statistical and linear regression analysis, it is realized that;
- For material no. 1, while the largest grains occurred under 850 ℃ austenitizing temperature, no statistical difference occurred between the grain sizes resulting from other heat treatments. In contrast to the expected situation, there was a poor correlation between average ferrite grain size and corrosion rate (coefficient of correlation R2 was 0.166). It should be noted that the average grain size values vary within a narrow range under examined heat treatment conditions. The corrosion rate may also have been affected by compressive residual stresses and hardness distribution profile as well as the grain size.
- In material no. 2, the highest corrosion rate occurred under 900 °C Q + 300 °C T and 900 °C Q + 450 °C T heat treatment conditions. The correlation coefficient between average ferrite grain size and corrosion rate was also very low (R2 = 0.063) for this material.
- In material no. 3, the highest corrosion rate occurred under 850 °C Q + 300 °C T heat treatment conditions and no statistical differences were found between other heat treatment conditions. For material no. 3, the average sizes of ferrite grains do not reveal any statistically significant differences for the range of austenitization temperatures between 850-950 ℃ and tempering temperatures between 150- 450 ℃. The correlation coefficient R2 was 0.099 for this material.
from the results, the austenitizing temperatures between 850-950 °C gained more importancein material no. 1 compared to material no. 2 and 3.
5. CONCLUSIONS
The corrosion characteristics of quenched and tempered boron steels in a 3.5 wt.% NaCl solution were examined using Tafel extrapolation method. From the study, the following conclusions can be drawn:
Changing C concentration affects the corrosion rates of boron steels as increasing C content generally accelerates the corrosion rate. The amount and distribution of cementite acting as a cathode in the microstructure affect the corrosion resistance.
Because the carbon content in the structure of tested steels was below 0.4%, no significant amount of residual austenite that could have been measured in XRD was formed.
The austenitizing temperatures at 850-950 °C gained more importance in material no. 1. For this steel, heat treatment temperatures were found to be statistically significant in terms of corrosion rate and grain size. For material no. 2, while the largest average ferrite grain size in heat treated samples occurred under 900 °C Q + 450 °C T heat treatment conditions, no statistical difference occurred in terms of grain sizes resulting from other heat treatments. For material no. 3, the highest corrosion rate occurred under 850 °C Q + 300 °C T heat treatment conditions and other heat treatment conditions did not make a statistical difference in terms of corrosion rate. The average sizes of ferrite grain do not reveal any significant differences for the range of austenitization temperatures between 850-950 ℃ and tempering temperatures between 150-450 ℃ for material no. 3. There was a poor correlation between average ferrite grain size and corrosion rate under examined heat treatment conditions for tested boron steels.
DISCLOSURE STATEMENT
No potential conflict of interest was reported by the authors.
ACKNOWLEDGMENTS
A part of the study was supported by the Scientific Research Project Office of Manisa Celal Bayar University. The authors would like to thank the Scientific Research Project Office of Manisa Celal Bayar University for providing financial support.
References
1. American Society for Metals, Boron Steel, Materials Park, (1953), Ohio, US.
4. Y. Y. Chen, H. J. Tzeng, L. I. Wei, L. H. Wang, J. C. Oung and H. C. Shih, Corros. Sci., 47 (2005) 1001.
5. M. Opiela, A. Grajcar and W. Krukiewicz, J. Achiev. Mater. Manuf. Eng., 33 (2009) 159. 6. S. Y. Lu, K. F. Yao, Y. B Chen, M. H. Wang, Y. Shao and X. Y. Ge, J. Appl. Electrochem., 45
(2015) 375.
7. D. A. López, W. H. Schreiner, S. R. Sánchez and S. N. Simison, Appl. Surf. Sci., 207 (2003) 69. 8. D. Clover, B. Kinsella, B. Pejcic and R. D. Marco, J. Appl. Electrochem., 35 (2005) 139. 9. L. R. Bhagavathi, G. P. Chaudhari, S. K. Nath, Mater. Design., 32 (2011) 433.
10.P. P. Sarkar, P. Kumar, M. K. Manna and P. C. Chakraborti, Mater Lett., 59 (2005) 2488. 11.W. T. Tsai and J. R Chen, Corros. Sci., 49 (2007) 3659.
12.S. Qu, X. Pang, Y. Wang and K. Gao, Corros. Sci., 75 (2013) 67.
13.K. D. Ralston, N. Birbilis and C. H. J. Davies, Scripta. Mater., 63 (2010) 1201. 14.Standard methods for estimating the average grain size of metals, ASTM E112-12. 15. Standard practice for X-ray determination of retained austenite in steel with near random crystallographic orientation, ASTM E 975-13.
16. H.M. Rietveld, J.Appl. Crystallogr., 2 (1969) 65.
17. J. Yang, F. Huang, Z. Guo, Y. Rong and N. Chen, Mater. Sci. Eng. A, 665 (2016) 76. 18. E. McCafferty, Corros. Sci., 47 (2005) 3202.
19. X.L. Zhang, Z.H. Jiang, Z.P. Yao, Y. Song and Z.D. Wu, Corros. Sci., 51 (2009) 581. 20. J. Yanga, Y. Lua, Z. Guoa, J. Gub and C. Guc, Corros. Sci., 130 (2018) 64.
21. S. Hiromoto, Corrosion of metallic biomaterials: metals for biomedical devices, Woodhead Publishing, (2010), Cambridge, UK.
22. J. Guo, S. Yang, C. Shang, Y. Wang and X. He, Corros. Sci., 51 (2009) 242.
23. M. Ferhat, A. Benchettara, S. E. Amara and D. Najjar, J. Mater. Environ. Sci., 5 (2014) 1059. 24. R. E. Melchers, Corros. Sci., 45 (2003) 2609.
25. S. Nešić and L.Lunde, Corros., 50 (1994) 717.
26. M. Umemoto, Z. H. Guo, I. Tamura, Mater. Sci. Technol., 3 (1987) 249.