This is a repository copy of The restructuring and privatisation of British Rail: Was it really that bad?.
White Rose Research Online URL for this paper: http://eprints.whiterose.ac.uk/2468/
Article:
Pollitt, M.G. and Smith, A.S.J. (2002) The restructuring and privatisation of British Rail: Was it really that bad? Fiscal Studies, 23 (4). pp. 463-502. ISSN 0143-5671
https://doi.org/10.1111/j.1475-5890.2002.tb00069.x
[email protected] https://eprints.whiterose.ac.uk/
Reuse
See Attached
Takedown
If you consider content in White Rose Research Online to be in breach of UK law, please notify us by
White Rose Research Online
http://eprints.whiterose.ac.uk/
Institute of Transport Studies
University of Leeds
This is an author produced version of a paper published in Fiscal Studies. This paper has been peer-reviewed but does not include final publisher pagination and formatting.
White Rose Repository URL for this paper: http://eprints.whiterose.ac.uk/2468/
Published paper
Pollitt M.G.; Smith, A.S.J. - 2002- The Restructuring and Privatisation of British Rail: Was it Really that Bad? - Fiscal Studies 23(4), pp.463-502
The Restructuring and Privatisation
of British Rail: Was it really that bad?
MICHAEL G. POLLITT and ANDREW S. J. SMITH*
Abstract
This paper uses a social cost-benefit analysis (SCBA) framework to assess whether rail privatisation in Britain has produced savings in operating costs. The paper shows that major efficiencies have been achieved, consumers have benefited through lower prices, whilst the increased government subsidy has been largely recouped through privatisation proceeds. We also find that output quality is no lower (and is probably better) than under the counterfactual scenario of public ownership (pre-Hatfield). The achievement of further savings is key to delivering improved rail services in the future. This paper finds that a privatised structure, where shareholders demand a return on their investment, has led to significant improvements in operating efficiency - it remains to be seen whether the new regime, with a not-for-profit infrastructure owner, will deliver the same efficiency improvements.
JEL classification: H43, L92.
*
I: Introduction
Over the period 1994-1997 the British railway industry was fundamentally transformed.
In 1994 the industry was in the hands of a single, vertically-integrated operator - British
Rail - owned by the government. By 1997, BR’s activities had been transferred to the
private sector. In the process, the industry was restructured into more than one hundred
companies, thereby removing much of the vertical and horizontal integration of the
pre-privatisation structure.
Since its reorganisation, and subsequent transfer to the private sector, the rail
industry's outputs have grown sharply. Between 1992/93 (the last year before
restructuring began1) and 1999/00, passenger miles and freight tonne-miles grew by 21%
and 19% respectively, whilst train miles were also up significantly (passenger train miles
grew by 13% over the period). During this same period, total industry operating costs2
fell by nearly 6%, suggesting that significant efficiency improvements have been made.
However, the privatisation of British Rail has been the subject of much criticism in
recent years, particularly in the aftermath of the Hatfield accident3. In October 2001 the
Government announced that it had decided to put Railtrack into administration – with the
company to be replaced by a not-for-profit company, limited by guarantee. Railtrack’s
finances had been crippled by the cost of Hatfield, and cost over-runs on the West Coast
Main Line project4.
1
See Section III.2 (a). 2
Operating costs (excluding depreciation). 3
A train derailment resulting from defective track, which resulted in four people being killed. 4
In the aftermath of the government’s announcement, attention has focused on what
went wrong with privatisation, and how crucial investment for maintenance and
development of the network will be financed in future. This paper looks at whether the
restructuring and privatisation of British Rail has produced savings in operating costs,
relative to the counterfactual scenario of continued public ownership. Operating costs
include train operator costs (train crews; traction costs; maintenance and cleaning of
rolling stock), the cost of operating the rail network (including signal operators), and
day-to-day track maintenance and inspections. The analysis excludes capital and depreciation
costs, and therefore excludes the cost of track (and other infrastructure) repairs and
renewals, and the capital cost of rolling stock (see below). For the rest of the paper,
unless otherwise stated, cost is taken to mean operating costs (excluding depreciation).
The paper uses the technique of social cost-benefit analysis (SCBA) – as developed
by Jones, Tandon and Vogelsang (1990) – to evaluate the operating efficiency gains (or
losses) resulting from privatisation, and also considers the allocation of these gains (or
losses) between consumers, producers and government. The analysis assumes the growth
in outputs achieved in recent years to be exogenous, and therefore focuses on the cost of
delivering these outputs under the alternative scenarios of private and public ownership.
The paper also looks at the changes in output quality (performance; overcrowding; asset
condition; safety) since privatisation. Whilst capital is excluded from the social cost
benefit analysis (due to the problem of establishing a counterfactual scenario), we
provide separate evidence on railway capital investment before and after privatisation.
The analysis uses data for the period to 1999/00 (financial year) only, and therefore
includes the Hatfield accident, is not representative of the period since privatisation as a
whole (and not all of the financial data are available in any case). Indeed, the effects of
Hatfield continued into the financial year 2001/02. The analysis should be updated once
data become fully available for three further years (2000/01, 2001/02 and 2002/03).
It should be noted that the change in industry structure means that it is not
straightforward to compare railway costs before and after privatisation. Our analysis
makes a number of adjustments to the data to ensure comparability. Inevitably a number
of assumptions have also been made. These adjustments and assumptions are explained
in the relevant section of the paper (and also in the appendices).
The SCBA methodology has previously been applied to a number of privatised
industries in the UK, for example, electricity (Domah and Pollitt, 2001), and some of the
earlier sell-offs (Galal et al, 1994; Martin and Parker, 1997). The paper is arranged into
five sections. Section II briefly outlines the historical background. Section III summarises
the theoretical arguments for liberalisation (restructuring and privatisation), and sets out
the SCBA methodology and data used. Section IV shows the results of the analysis, and
Section V offers some conclusions.
II. Historical background
The railway network in Britain was planned, financed and built by the private sector in
the 19th Century. The industry was nationalised in 1948, and then returned to private
ownership during the period 1995-1997, as part of the wider programme of sell-offs
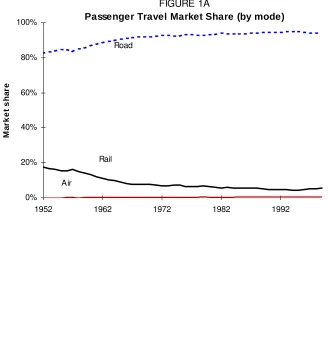
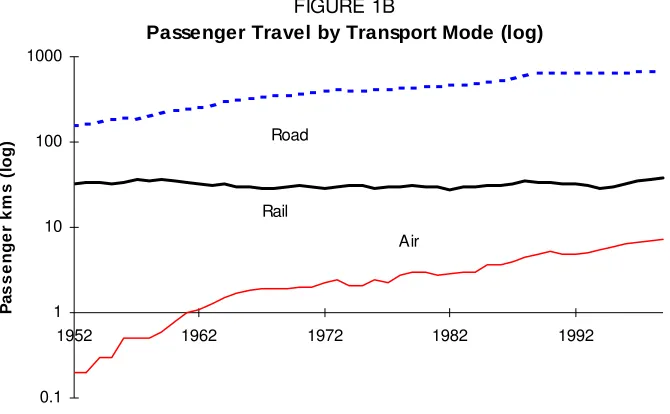
Since nationalisation, rail traffic has been in almost continual decline in the face of
increased competition from road transport (see Figures 1A and 1B). In the early 1950s,
passenger rail travel accounted for roughly 17% of total passenger traffic - by the
mid-1990s this share had fallen to around 5%. Rail freight business saw an even sharper loss
of market share, from over 40% to just 7% over the same period, driven by the loss of
traffic to roads, and the decline of Britain’s heavy manufacturing and primary industries
(which rail freight was particularly well placed to serve). Rail volumes also fell in
absolute terms up until the mid 1990s. As noted in the introduction, these trends have
[image:7.612.85.413.335.678.2]been reversed since privatisation5.
FIGURE 1A
Passenger Travel Market Share (by mode)
0% 20% 40% 60% 80% 100%
1952 1962 1972 1982 1992
Ma
rk
et
s
h
a
re
Road
Rail
Air
5
FIGURE 1B
Passenger Travel by Transport Mode (log)
0.1 1 10 100 1000
1952 1962 1972 1982 1992
P
a
s
sen
g
er
km
s (
lo
g
) Road
Rail
Air
Sources: Transport Trends, 2001 Edition (DTLR).
The railways moved into a loss-making position in the mid-1950s and, in spite of the
line and station closures implemented following the Beeching reports (1963; 1965) -
which saw the total route mileage reduced by a third - the industry’s financial position
continued to deteriorate during the 1970s and early 1980s (as productivity growth slowed
whilst wages were on the increase; and as government controls prevented the
development of commercial pricing). The 1968 Transport Act explicitly recognised the
need for government subsidy to support loss-making (but socially-beneficial) services.
However, in line with worsening performance, the level of subsidy also increased over
time, reaching £1.6bn by 1985/86, compared to £600m in 1968 (1999/00 prices).
During the 1980s it was recognised that the financial position of the industry, and the
requirement for government support, would complicate any attempt at privatising the
subsidy after sale. As a result, proposals for rail privatisation developed slowly during the
1980s, finally culminating in the sale of the industry during the period 1995-1997.
However, the government (and BR), were not idle in the meantime, and began selling off
many of BR’s non-core operations (see Table 1). Some of these sales raised substantial
sums (for example, BR Hotels raised £150m in 1999/00 prices)6.
TABLE 1
BR Non-core Businesses Sold to the Private Sector (1981-1993)
BR Hovercraft (1981) Doncaster Wagon Works (1987) BR Hotels (1982-1984) Horwich Foundry (1988)
Superbreak Mini Holidays (1983) British Rail Engineering Ltd (1988) Slateford Laundry (1983) Travellers Fare [station catering]
(1988)
Sealink UK (1984) Transmark [consultancy] (1993) British Transport Advertising (1987) Meldon Quarry (1993)
Sources: Bradshaw and Lawton-Smith (p 104) and Freeman & Shaw (page 9).
The debate on privatising the core railway operations continued throughout the 1980s
and early 1990s. In 1992, immediately following the surprise Conservative election
victory, a White Paper, ‘New Opportunities for the Railways’ (Department of Transport),
was quickly put together under the direction of the John MacGregor (then Secretary of
State for Transport). The strong likelihood that the Conservatives would lose the
subsequent election (1997) injected an urgency into the process, as the government
sought to complete the sale of the industry in one Parliament – and thus make
privatisation effectively irreversible.
6
The 1992 White Paper outlined the government’s privatisation objectives, which were
similar to those for previous sell-offs: to harness the skills of private sector management,
in order to achieve greater responsiveness to customer needs, higher service quality,
improved efficiency and better value for money. The introduction of competition was
thought to be the best way of achieving these objectives (following the example of the
electricity restructuring in 1990), although it was recognised that regulation would be
required to protect consumers (especially with regard to safety).
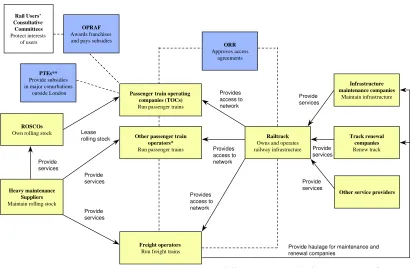
As a result, the industry was separated (vertically and horizontally) into more than
one hundred companies (see Figure 2 below), to allow competition to develop in the
contestable elements of the business. The restructuring was carried out initially within the
public sector, creating shadow companies, which were later sold.
The most significant change was the separation of control of the track infrastructure
(natural monopoly) from train operation (contestable). In 1994, most of the fixed railway
infrastructure assets were transferred to a new company, Railtrack, separate from BR, but
still wholly-owned by Government. The company was sold by public offer in 19967.
At the same time, BR’s infrastructure services were reorganised into seven
infrastructure maintenance and six track renewal companies (sold between February and
July 1996). BR’s rolling stock was divided into three leasing companies (ROSCOs). The
ROSCOs (sold in January/February 1996) lease locomotives and carriages to the
passenger train operating companies8. Six heavy maintenance depots (provide services to
ROSCOs) were also sold in April and June 19959.
7
See Kain (1998) page 248; NAO Report (HC 25 Session 1998-99) page 20. 8
See NAO (HC 576 Session 1997-98) p 1. 9
The right to run passenger train services was franchised to 25 private sector train
operating companies (TOCs) - with open-access competition to be introduced gradually
under the “moderation of competition” rules laid down by the Regulator (from 1995
onwards). TOCs lease almost all of their rolling stock from the ROSCOs, and pay
Railtrack for access to track and stations. Red Star Parcels was sold to a management
[image:11.612.99.510.345.613.2]buy-out in September 199510.
FIGURE 2
The New Rail Industry in 1996/97
OPRAF Awards franchises and pays subsidies
ORR Approves access
agreements
Passenger train operating companies (TOCs) Run passenger trains
Other passenger train operators* Run passenger trains
* Initial structure made some provision for open-access to develop in future. Heathrow Express and Eurostar currently operate on an open-access basis. ** PTE = Passenger Transport Executive
Freight operators Run freight trains
Railtrack Owns and operates railway infrastructure Infrastructure maintenance companies Maintain infrastructure Track renewal companies Renew track
Other service providers Provide
services
Provide haulage for maintenance and renewal companies Provide services Provides access to network Provides access to network Provides access to network ROSCOs
Own rolling stock
Heavy maintenance Suppliers Maintain rolling stock
Provide services Lease rolling stock Provide services Provide services Rail Users’ Consultative Committees Protect interests of users
Source: Railtrack Pathfinder Prospectus, page 21. PTEs**
Provide subsidies in major conurbations
outside London
Provide services
10
Freight operations were separated into six companies (later consolidated into two)
and sold between December 1995 and November 1997 (with open-access competition
allowed from the outset). In addition, many other BR central services operations were
sold to private sector companies or management teams11.
As part of the reorganisation, two regulatory bodies were also created: (1) The Office
of Rail Regulator (ORR), principally to regulate the monopoly element of the business -
Railtrack; and (2) The Office of Passenger Rail Franchising (OPRAF), mainly
responsible for awarding franchises, paying subsidies, and regulating the TOCs12. Rail
Users’ Consultative Committees (RUCCs) were established to work with OPRAF in
protecting the interests of rail users13. Safety regulation was placed with the Health &
Safety Executive.
Having described the background to rail privatisation, the remainder of the paper
concentrates on whether the new structure has met one of the government’s main
objectives – namely, improving operating efficiency - and how any efficiency gains (or
losses) have been allocated between consumers, producers and government.
Since privatisation industry outputs have increased substantially (reversing a
long-term trend of decline), whilst costs have fallen in real long-terms. The new structure gave the
TOCs strong incentives to increase outputs and reduce costs (because of declining
subsidies; fixed access charges). Whilst part of the output growth since the mid 1990s can
be attributed to privatisation itself - through, for example, fare regulation and better
marketing) - in the subsequent analysis (Section IV) we make the conservative
11
See Kain (1998), page 250; Bradshaw and Lawton-Smith (2000), pages 108; 118; NAO Report ‘The Sale of Railfreight Distribution’.
12
assumption that output growth has been driven entirely by exogenous factors (eg. GDP
growth; road congestion). This assumption reduces the benefits attributed to privatisation
in our analysis.
Our analysis therefore focuses on whether the industry’s outputs – driven by
exogenous factors - would have been delivered more cheaply under the new structure
than under continued public ownership. Data on output quality (performance;
overcrowding; asset condition; safety) and capital costs are also evaluated. The new
structure contained a number of features to ensure that efficiency gains would be shared
with consumers (fare regulation; competition) and government (declining subsidy
profile). The analysis in Section IV quantifies the allocation of efficiency gains (or
losses) between the different groups.
III. Methodology
1. Theoretical issues and empirical work
The ideological belief underlying the privatisation of British Rail was that the injection of
private sector expertise and flair would result in improved services, more efficient
operations, and better value for money for the travelling public. It was also hoped that the
private sector would be able to lure passengers and freight customers back to the railways
(greater responsiveness to customer needs), and arrest the long-term decline of the
industry.
13
However, following earlier privatisations (eg. BT and British Gas), it was recognised
that change in ownership alone would be insufficient to deliver the required
improvements in services and cost. Whilst private ownership and the profit motive
provide better incentives than public ownership, the government saw competition, and
the ending of BR’s monopoly, as key to delivering improvements on the railways.
The liberalisation of public enterprises in general often involves three separate, and
not necessarily connected elements: changes in ownership; the creation of new, or
radically restructured companies; and the introduction of some degree of competition.
Depending on the combination of these factors, liberalisation will tend to cause
significant changes in the way businesses are conducted. Pollitt (1997) identifies five
theoretical arguments relating to the likely efficiency effects of liberalisation:
1. liberalisation can improve incentives by reallocating property rights from the public
to the private sector;
2. liberalisation may change the objective functions of managers being faced with
private sector incentives for the first time;
3. there may be incentives for distortionary resource allocation, caused by some types of
regulation (eg. rate of return regulation) leading to inefficiency;
4. liberalisation may cause “influence activities” within the industry (eg. empire
building), which may result in a divergence from efficiency; and
5. policy commitment theories suggest that liberalisation will result in lower
intervention costs.
Pollitt (1997) notes that, in a developed, market economy such as the UK, the
the case of property rights, bureaucracy and commitment theories; but that poorly
constructed incentive regulation could negate all the other positive benefits from
liberalisation. As a result, the impact of any particular restructuring and privatisation
process (in a given industry or country) has the potential to be highly variable.
A number of methodologies have been used to assess the impact of liberalisation, for
example based on price or cost comparisons, as used by Yarrow (1992) and Bishop and
Thompson (1992), or using simulation or frontier approaches, such as Burns and
Weyman-Jones (1994). These methodologies have been criticised as they do not directly
address the issue of whether it is likely to be socially beneficial (in particular they do not
address the distributional effects of liberalisation).
A more comprehensive approach would be the computational general equilibrium
(CGE) method (for example, Chisari, Estache and Romero,1999), which assess the
macroeconomic and distributional effects of privatisation and regulation. However, none
of these approaches possess the power of an overall social cost-benefit analysis (outlined
below), and are themselves based on numerous assumptions regarding specification of
objectives and constraints.
SCBA studies, for example Galal et al (1994) and others (Newbery and Pollitt, 1997)
have addressed the failures of the other methodologies. In this paper we use a SCBA
2. The Social Cost-Benefit Methodology
The methodology developed by Jones, Tandon and Vogelsang is concerned first with
assessing the total change in welfare resulting from privatisation and restructuring, and
second with the allocation of this change, principally between three groups, consumers,
producers (ie shareholders of the new, privatised companies), and government14. The first
question relates to the productive efficiency impact (net of restructuring costs) of
liberalisation, whilst the latter is concerned with equity. For simplicity our analysis
ignores changes in allocative efficiency.
Jones et al define the privatisation decision according to the following formula:
ΔW = Vsp - Vsg + (λg-λp)*Z
where: W = Social Welfare; Vsp = Social value of firm under private operation;
Vsg = Social value of firm under continued government operation; Z = Price paid to buy
the firm (or government sales proceeds) and λg and λp are the shadow multipliers on
government revenue and private funds respectively.
Privatisation will be socially worthwhile if ΔW>0. In a developed, market economy,
we would expect no significant difference in the value of shadow multipliers, so for the
purpose of our analysis we set λg=λp=1. The sales proceeds variable, Z, which is a
14
transfer payment between government and producers, therefore drops out of the equation
(though remains important for its distributional effects).
The calculation of ΔW involves computing the difference between the costs under
public and private ownership (both over the period since privatisation, and into the
future). Costs under private ownership (to date) are based on actual data; and these also
need to be projected into the future. However, the main difficulty lies in estimating what
would have happened to costs under continued public ownership. In order to address this
issue we need to build a counterfactual scenario based on historic and other economic
data.
The efficiency savings due to liberalisation are calculated as the difference between
the present value of actual (private) and counterfactual (continued public ownership)
costs. Restructuring costs are then deducted, to arrive at the value of ΔW. The final step
is to allocate ΔW between the three groups (consumers, producers, and government), and
therefore to determine the winners and losers (see below).
(a) Comparing Costs with and without Privatisation
The first task is to decide on the cut-off point between public and private ownership. In
this paper we take 1996/97 as the first full year of privatisation15. However, the last year
of public ownership is taken to be 1992/93, since this is the last year unaffected by the
15
By 1996/97 the following parts of the industry had been sold: Railtrack (sold in May 1996); the three ROSCOs (sold in January/February 1996); thirteen infrastructure companies (sold between February and July 1996); six heavy maintenance depots (sold in April and June 1995); Red Star Parcels (sold in
restructuring and privatisation programme16 (see below). The transition period (1993/94
to 1995/96) saw the restructuring of the industry and its transfer to private ownership.
The sale of British Rail was accompanied by a radical restructuring of the industry, to
create more than one hundred new companies. As a result, computing the total (actual)
rail industry cost since privatisation is not straightforward, given the number of
companies involved, and the complex set of financial payments flowing between the
companies. In addition, care is required in comparing cost data before and after
privatisation.
It was not possible to calculate the post-privatisation cost base by adding up the costs
of the constituent parts (and eliminating inter-company flows), as the data did not permit
such an analysis. We get around this problem by deriving industry costs as the difference
between total industry revenue received from final users (train operator revenue), less
total industry operating profits (non-operating revenues, costs and profits are excluded
from the analysis). The data are shown in Table 2, for the post-privatisation period
(1996/97 to 1999/00). The data for earlier years are taken directly from BR Annual
Reports.
The costs in Table 2 are operating costs (excluding depreciation). Whilst a full SCBA
analysis would also include a consideration of capital costs, this paper focuses only on
the operating side of the business. As stated in the introduction, capital is excluded from
our analysis due to the difficulty of establishing a counterfactual. We note that it is
common in railway efficiency studies to focus on operating costs, due to problems of
capital measurement and comparability. However, this comes at a price, since operating
efficiency improvements may be mistaken for capital substitution effects; and capital
expenditure also impacts on output quality. We present evidence to address both of these
issues in Section IV.4.
A number of points are worth noting with regard to the data in Table 2. First, it
excludes the costs of minor (open-access) freight operators (though these are small), thus
underestimating post-privatisation costs slightly. On the other hand, the profit data in
Table 2 do not reflect the returns made by the many supplier companies sold as part of
the restructuring, who now provide services to the industry (therefore overstating the
post-privatisation costs). ORR costs are charged out to the industry, so do not need to be
added separately.
The costs of the Strategic Rail Authority are included in Table 2 (netted off against
TOC profits) – though to the extent that the SRA, and its predecessor, OPRAF, were
staffed through transfers from other parts of government, the inclusion of these costs may
overstate costs under the privatisation scenario, relative to the counterfactual. Indeed,
Department of Transport costs, which would have been considerably higher under the
counterfactual, are not included in our analysis.
Residual BR costs have been excluded (these include policing costs, which are
charged out to the industry)17. On balance, given the scale of some of the supplier
contracts - for example, Railtrack spends roughly £1.3bn per year on contracts with
infrastructure maintenance and renewal companies alone - we expect that the approach
used overstates the post-privatisation costs overall, and therefore underestimates the
16
efficiency gains from privatisation. In their report for the ORR, Europe Economics
(2000) note that anecdotal evidence points to substantial margins achieved by rail
contractors. For further explanation of the costs in Table 2 see Appendix A.
For the counterfactual cost scenario, we have relied on historical data from BR’s
accounts. We started by reviewing the cost data for ten years prior to privatisation
(1984/85 to 1993/94) – note that privatisation began in 1994/95 (eg. heavy maintenance
depots were sold, and Railtrack was created as a separate company, within government).
However, the final period chosen to inform the counterfactual was shortened to the five
years (1988/89 to 1992/93) for the reasons outlined below. The use of five years
pre-privatisation data is common in divestiture studies (see Galal et al, 1994).
The financial year 1993/94 was excluded from the pre-privatisation period – this year
was significantly affected by the privatisation and restructuring programme, and saw a
voluntary severance programme, in preparation for privatisation, which led to a 7%
reduction in headcount in that year18. We note that it is common in privatisation studies
to exclude the years immediately prior to privatisation (either to capture the effects of
privatisation announcements on productivity growth; or because data for those years may
be distorted by privatisation provisions)19.
17
BR residual costs also include some property costs (non-operational) and costs relating to liabilities relating to the pre-privatisation period. Further analysis may look at whether any of these costs should be added to the post-privatisation cost base.
18
In the Annual Report for 1993/94, this programme was specifically linked with privatisation. 1993/94 also saw a number of minor sell-offs (Transmark and Meldon Quarry).
19
TABLE 2
Rail Industry Costs (Computed as Revenue less Profit)
Rail Industry Costs Pre-privatisation Transitiong Post-privatisation
£m, 99/00 pricesa 88/89 89/90 90/91 91/92 92/93 93/94 94/95 95/96 96/97 97/98 98/99 99/00
Passenger revenueb Freight revenuec
Railtrack prop. incomed
Total industry revenue (A)
TOC profits Freight profits ROSCO profits Railtrack profits
Total profits (B)e
Industry costs (A-B) 4,287 4,195 4,176 4,394 4,406 4,023 NA NA
5,220 607 133 5,960 24 52 1,035 533 1,644 4,316 5,223 573 134 5,930 181 87 1,064 528 1,860 4,070 5,180 555 139 5,874 162 82 1,054 483 1,781 4,093 5,150 601 137 5,888 164 68 1,028 473 1,733 4,155
Passenger train miles (m) Freight-tonne miles (bn)
Composite indexf
222 11.2 100 225 10.4 99 232 9.9 100 231 9.5 99 228 9.6 98 228 8.6 96 222 8.1 92 231 8.3 96 229 9.4 98 237 10.5 103 249 10.8 108 257 11.4 112
(a) Conversion uses RPI data. (b) Includes subsidies. TOCs only (excludes Heathrow Express and Eurostar). Financial data for 5 TOCs were not available for 1999/00 – data were extrapolated for these TOCs. (c) Includes EWS and Freightliner20. (d) That part of Railtrack’s income which does not come from TOCs or freight operators (needs to be included for comparability with BR data). (e) Operating profits before depreciation, net of SRA/OPRAF costs; excludes non-operating profits, such as profits on asset sales. (f) Weighted index used to calculate unit costs (88/90 =100). Weighted based on freight/passenger revenue. (g) It was not possible to construct comparable data for 94/95 and 95/96 due to restructuring.
Sources: BR Annual Reports; Annual Reports for individual companies (post privatisation). Transport Trends, 2001 Edition (DTLR).
20
The data from 1984/85 to 1987/88 have also been excluded from the analysis.
1984/85 and 1985/86 was affected by the coal strike (see BR Annual Report, 1985/86).
The data between 1986/87 and 1988/89 were impacted by the sale of a number of
businesses, continuing a trend which started in the early 1980s (see Table 1). In
particular, BR sold British Rail Engineering Ltd (BREL) and Travellers Fare (station
catering). Whilst it is not possible to calculate the exact impact of these sales on BR’s
cost base, the sales of the two businesses led to a reduction in headcount by around
13,000 (or 8%) between 1987/88 and 1988/89.
Having established the appropriate time period for historical analysis, the
counterfactual cost profile is then constructed based on the 1992/93 cost level, projected
forward using an assumption about counterfactual efficiency gains (based on historical
performance). The construction of the counterfactual cost scenario is described in detail
in Section IV.1.
The calculation of a counterfactual cost profile, based on historic data, raises the
question of whether the pre and post-privatisation cost data are comparable. The
formation of Railtrack in 1994/95 saw a change in accounting policy through the
introduction of the Asset Maintenance Plan Charge (AMP). This approach forecasts the
required repairs and renewal activity for track, route structures, stations and depots over a
ten year period, and charges one tenth of this estimate to the P&L in each year (as
depreciation21).
However, we are satisfied that the data (pre and post privatisation) remain
significantly increase depreciation costs (to address under-investment before
privatisation, and to bring accounting policies into line with other regulated industries –
see Appendix B). As noted already, depreciation costs are excluded from operating costs
in our analysis. Furthermore, there is no evidence to suggest that the change resulted in
any transfer of cost between operating costs and capex: the level of day-to-day
infrastructure maintenance (the operating element of maintenance costs) increased in
1994/95, compared with the previous year22.
To complete the analysis, the SCBA approach requires projections of both the actual
(privatised) and counterfactual (public ownership) costs into the future. For simplicity,
we have assumed that no further savings are made after 1999/00, and that the efficiency
gap opened up by the private sector is closed over the following fifteen years (that is, the
public sector is assumed to catch up over time).
(b) The Efficiency Gains from Restructuring and Privatisation
The value of efficiency gains from privatisation and restructuring are simply calculated as
the difference between the present value of the two cost profiles Cg-Cp less the present
value of restructuring and privatisation costs (R&P).
ΔW= Cg-Cp – R&P
21
From 1998/99 onwards the AMP charge formally became part of depreciation under FRS 15. 22
The consumer surplus impact of higher traffic volumes is excluded from our calculation
of ΔW, since volume growth is assumed to be exogenous. This is a simplifying
assumption, made necessary by the difficulty of establishing how much of the traffic
growth is due to privatisation versus other factors (such as the economic upturn). This
assumption also reduces the benefits attributed to privatisation in our analysis.
Restructuring and privatisation costs are assumed to be zero under the counterfactual
scenario. Under the privatisation scenario they include all R&P costs incurred within
government (in 1993/94, 1994/95 and 1995/96), and all restructuring costs incurred since
privatisation (1996/97 onwards, by the newly-privatised companies).
(c) Distribution of the Net Efficiency Gains
Once the present value of the net efficiency gains from privatisation has been calculated,
the next step is to analyse its distribution between consumers, producers and government,
as summarised in the following identity:
ΔW= ΔCust + ΔProd + ΔGov
ΔCust is calculated as the difference between actual and counterfactual average
revenue (price), multiplied by the actual volume. The price was computed using a
composite volume index based on passenger miles and freight tonne-miles (weighted
according to passenger and freight revenue). The counterfactual average revenue (price)
prior to privatisation (for simplicity we are ignoring the allocative efficiency aspect of
any price changes).
The change in the government’s position (ΔGov) is relatively complex, and includes a
number of factors. First of all, by selling the industry the government foregoes any
potential profit/(deficit) streams from the business in future, and in return receives the
sales proceeds for the industry and a share of future profitability through corporation tax.
In contrast to earlier privatisations, the government has also continued to provide ongoing
revenue subsidies23 to the sector since privatisation. The counterfactual scenario assumes
that the government would continue to pay revenue subsidies to cover operating losses.
However, there is a further complication here. On privatisation, the government was
relieved (to some extent24) of its responsibility to provide funding for capital investment
(which averaged £1.1bn per annum in 1999/00 prices during the five years prior to
privatisation). Whilst the social cost benefit analysis in this paper focuses on operating
costs (and ignores capital costs), it is necessary to reflect the saved capital costs in the
calculation of the government’s welfare position. The average of £1.1bn per annum is
used in the counterfactual to reflect this, and the same figure is used (with a negative
sign) to reflect the capital costs which the private sector would need to cover out of
operating profits25.
23
In the analysis in Section IV, subsidies are taken to include both Central Government subsidies (paid through OPRAF), and PTE grants.
24
Note that the Periodic Review (2000) allowed for significant grant payments direct to Railtrack (from 2001/02), to cover the exceptional level of renewal expenditure required over the next control period. However, grants to Railtrack in the years since privatisation (1996/97 to 1999/00) have been relatively small, and are not reflected in the allocation of efficiency gains between government and producers (however, grant income is taken account of in arriving at operating costs – see Appendix A). 25
ΔGov is therefore calculated as follows:
ΔGov = Privatisation Scenario (Taxes – Subsidy + Sales Proceeds)
– Counterfactual Scenario (Operating profits/losses + Capital Subsidies)
For producers, there is no counterfactual (since the counterfactual assumes public
ownership). ΔProd is simply calculated as the post-tax profits under the privatisation
scenario, less the amount paid to purchase the business (the corollary of government sales
proceeds), less an amount to reflect capital expenditure (the corollary of the £1.1bn saved
capital cost used to calculate ΔGov).
With regard to future projections – that is, beyond 1999/00 - it is assumed that the
privatisation scenario variables remain at their 1999/00 levels26, whilst the counterfactual
cost and fares gradually fall until they are in line with the privatisation scenario. To
complete the above calculations, restructuring costs are subtracted from ΔGov and ΔProd,
depending on when the costs were incurred (ie before or after privatisation).
26
IV. Results
1. Cost changes
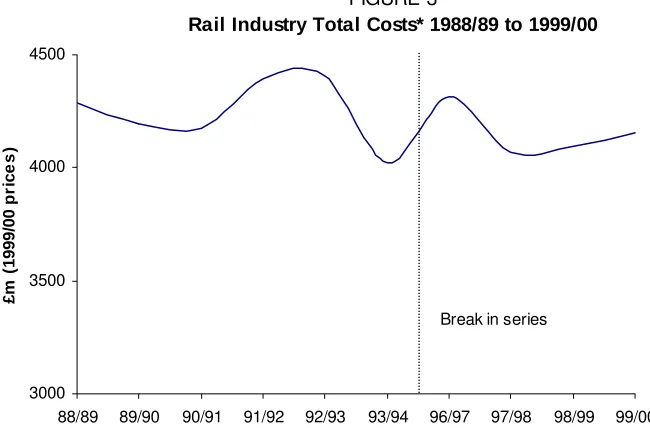
Figure 3 shows the profile of total rail industry costs (actual) over the period 1988/89 to
1999/00. The data show that total costs were rising in the period up until 1992/93, fell
sharply in 1993/94, as the restructuring of the industry began, and then remained broadly
static in real terms between 1993/94 and 1999/00, whilst industry outputs grew strongly.
* After privatisation, costs are calculated as total revenue less profits, as shown in Table 2.
In order to understand what has been happening to unit costs over the period, we first
need to decide on an appropriate measure of output. The next step is to separate out the
[image:28.612.106.431.312.526.2]impact of scale/density effects from underlying efficiency improvements. This second
FIGURE 3
Rail Industry Total Costs* 1988/89 to 1999/00
3000 3500 4000 4500
88/89 89/90 90/91 91/92 92/93 93/94 96/97 97/98 98/99 99/00
£m
(
1999/00 p
rice
s
)
step requires an assumption about the proportions of fixed and variable costs in the rail
industry.
Our measure of output (see Table 2 above), is a composite index based on passenger
train miles and freight tonne-miles, weighted according to the split between passenger
and freight revenues. With respect to fixed and variable costs we make the following
assumptions:
1. based on work carried out during the 2000 Periodic Review of Railtrack’s access
charges, we assume that 17%27 of infrastructure costs are variable with respect to
volume (or 83% of costs are fixed). In our analysis, infrastructure costs make up 36%
of the total cost base;
2. for the remainder of the cost base we assume that costs exhibit broadly constant
returns to scale (we assume that 10% of these remaining costs are fixed).
Overall, our assumptions on scale mean that around 37% of the cost base is fixed with
respect to volume28. Of course there will be other fixed costs, including infrastructure
renewal and rolling stock depreciation costs, but these are excluded, as our analysis
focuses on operating expenditure, and excludes capital (or depreciation) costs. The
variable cost element is assumed to vary in line with our volume index, which is based on
passenger train miles and freight tonne-miles.
It is important to note that passenger miles are not included in our measure of volume.
This is a conservative assumption which reduces the level of efficiency gains attributed to
27
The Periodic Review analysis found that 17% of maintenance and renewal cost was usage-driven. Since our analysis includes only maintenance costs, we have assumed that 17% of maintenance costs are variable. In addition, traction costs are also assumed to be variable, which (coincidentally) produces a figure of 17% variable costs overall.
28
privatisation in our calculations. Passenger miles have grown much faster than passenger
train miles in recent years (21%, compared to only 13% since 1992/93). We note,
however, that whilst train miles are likely to be the main driver of costs, some costs will
increase in line with passenger miles (for example, an increased number of coaches have
been employed since privatisation to accommodate higher passenger numbers; station
and revenue-protection costs are also likely to vary with passenger miles).
Now that we have made our choice of volume measure and assumption about returns
to scale, we are in a position to analyse the trends in unit costs (before and after
privatisation), and to separate out the scale effects from underlying efficiency gains.
Table 3 presents total and unit costs for the pre and post privatisation periods, splitting
out the impact of scale effects from efficiency improvements.
The first section of Table 3 shows that scale effects would have caused unit costs to
rise by 0.2% per annum over the five years 1988/89 to 1992/93 (falling volumes, with
37% of cost base fixed). Actual unit costs rose by 1.2% per annum, implying negative
efficiencies, or an efficiency loss of 1% per annum over the period29. However, we are
reluctant to assume a 1% efficiency deterioration as our counterfactual. In our
central counterfactual scenario we therefore assume that BR would have delivered
efficiency gains of 1% per annum over the period 1992/93 to 1999/00. This assumption
weighs heavily in favour of public ownership. However, it gains some empirical support
29
We note that BR made a significant change to its accounting policy in 1991/92, which meant that infrastructure costs were capitalised for the first time. Since BR produced data for 1991/92 on both
from a study by Bishop and Thompson (1992), which found that British Rail delivered
labour productivity growth of 0.6% per annum over the period 1970-199030.
TABLE 3
Unit Cost Analysis
Pre-privatisation period 88/89 89/90 90/91 91/92 92/93 Annual Change
Scale effects – no efficiencies
Unit costsa – after scale effects
Unit costs
Actual
Underlying efficiency gain/(loss)
Actual 42.9 42.9 43.0 42.4 42.9 41.8 43.0 44.4 43.2 44.9 0.2% 1.2% (1.0%)
Post-privatisation period 92/93 96/97 97/98 98/99 99/00 Annual Change
Scale effects – no efficiencies
Unit costsa – after scale effects
Unit costs
Actual
Counterfactual
Underlying efficiency gain
Actual Counterfactual 44.9 44.9 44.9 44.9 44.1 43.2 44.1 39.4 41.9 43.4 37.9 40.9 42.9 37.1 39.9 (0.7%) (2.7%) (1.7%) 2.0% 1.0%
(a) Unit costs calculated by dividing total costs by our volume index.
30
The second section of Table 3 shows actual and counterfactual unit costs (central
scenario) for the post-privatisation period. This shows that actual unit costs fell by 2.7%
per annum over the period, of which 0.7% is due to scale effects, and 2.0% to underlying
efficiency improvements. Under the counterfactual scenario, unit costs fall by 1.7% per
annum, of which 1% per annum results from the assumed underlying efficiency savings,
and the balance from scale effects (0.7%).
Figure 4 below shows actual costs, and the profile of counterfactual costs under three
scenarios: pro-privatisation scenario (underlying efficiency gain of 0% per annum);
central scenario (underlying efficiency gain of 1% p.a., described above); and pro-public
scenario (underlying efficiency gain of 2% p.a.). As noted in Section III.2, it is assumed
that the efficiency gap opened up by the private sector is gradually closed over the next
15 years (post 1999/00) – that is, the public sector is assumed to catch up. This
assumption therefore weighs in support of continued public ownership, and against
privatisation.
[image:32.612.105.418.477.690.2]* After privatisation, actual costs are calculated as total revenue less profits, as shown in Table 2.
FIGURE 4
Actual and Counterfactual Total* Costs
3000 3500 4000 4500 5000
88/89 89/90 90/91 91/92 92/93 93/94 96/97 97/98 98/99 99/00
£m
(
1999/00 p
rice
s
)
Pro-public (2% gain) Pro-privatisation (0% gain)
Central (1% gain) Actual costs
2. Calculation of efficiency gains
Table 4 provides estimates of the discounted efficiency gains (pre-restructuring) resulting
from rail privatisation in the UK. Estimates are shown for the three alternative
assumptions about underlying efficiency improvements under the counterfactual scenario
(0%, 1% and 2%). In addition, the results are also shown for two different discount rates,
6% (used by government) and 10% (private sector discount rate).
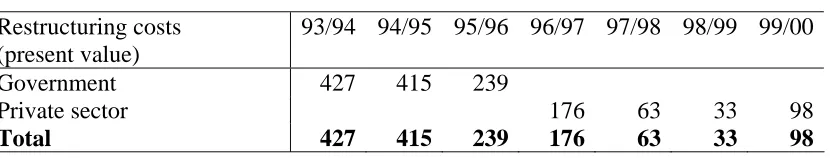
With a 6% discount rate, the central scenario shows the total discounted efficiency
gains to be £2.5bn. This efficiency gain is partly offset by restructuring costs of £1.4bn
(see Table 5), yielding efficiency gains net of restructuring costs of £1.1bn.
TABLE 4
Gross Efficiency Savings (Pre-Restructuring)
Counterfactual unit cost reduction
Discount rate
6% 10%
0% £5,200m £4,800m
1% £2,500m £2,200m
[image:33.612.97.512.606.685.2]2% (£100m) (£200m)
TABLE 5
Restructuring Costs
Restructuring costs (present value)
93/94 94/95 95/96 96/97 97/98 98/99 99/00
Government 427 415 239
Private sector 176 63 33 98
Total 427 415 239 176 63 33 98
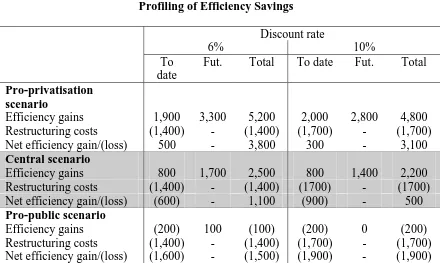
Table 6 (below) shows the profiling of the discounted savings between the period to
date (1996/97 to 1999/00) and the future (the savings gap achieved to date is assumed to
be closed over the next 15 years). The units of the data in Table 6 are £million
(discounted).
Under the Central Scenario (6% discount rate), the data show that privatisation has
already yielded £800m in efficiency savings, although these savings have been more than
offset by restructuring costs (£1,400m). This position is unsurprising, as the industry has
only been in private hands for four years, and we would expect the cost of restructuring to
be recovered over a longer period. Total savings (including future savings31) under the
Central Scenario amount to £1,100m (£500m at a 10% discount rate) after restructuring
[image:34.612.90.530.391.654.2]costs.
TABLE 6
Profiling of Efficiency Savings
Discount rate
6% 10%
To date
Fut. Total To date Fut. Total
Pro-privatisation scenario
Efficiency gains 1,900 3,300 5,200 2,000 2,800 4,800 Restructuring costs (1,400) - (1,400) (1,700) - (1,700) Net efficiency gain/(loss) 500 - 3,800 300 - 3,100
Central scenario
Efficiency gains 800 1,700 2,500 800 1,400 2,200 Restructuring costs (1,400) - (1,400) (1700) - (1700) Net efficiency gain/(loss) (600) - 1,100 (900) - 500
Pro-public scenario
Efficiency gains (200) 100 (100) (200) 0 (200)
The data in Table 6 are sensitive to the cost assumption under the counterfactual
scenario. The savings estimates are much higher if we assume that underlying unit costs
would have remained flat under public ownership (pro-privatisation scenario); on the
other hand, under a counterfactual cost assumption of 2% (pro-public scenario), the
savings become approximately zero (before restructuring costs)32. However, given the
fact that unit costs increased during the pre-privatisation period (by more than would
have been expected due to scale effects alone – see Table 3), it is difficult to argue for a
counterfactual cost reduction that is more aggressive than assumed in the central scenario.
It is important to note that this paper does not seek to explain the improvements in
efficiency. Freeman & Shaw (2000)33 provide some anecdotal evidence on efficiency
improvements achieved by the TOCs (through staff reductions). In addition, during the
2000 Periodic Review Railtrack reported significant efficiency savings since privatisation
(2.2% per annum between 1994/95 and 1999/00)34. Over the period since 1995/96, we
note that total TOC and Railtrack staff numbers declined from 58,400 to 50,30035, a
reduction of 14% (though it has been argued that TOCs reduced staff too quickly in the
early years after privatisation, resulting in driver shortages)36. The reduction in
TOC/Railtrack headcount provides some support for the efficiency improvements
reported in this paper.
31
Note that, as described earlier, the future savings do not reflect additional savings – rather they are based on the continuation of the savings gap in 1999/00 into future years (though declining each year as the public sector is assumed to catch up).
32
Note that it is assumed that the public sector (counterfactual) cost profile catches up with the privatisation scenario over time, but that no restructuring costs are required to achieve this catch up. In practice,
restructuring costs would also be required under public ownership. 33
Freeman and Shaw (2000), Chapter 7. 34
See Office of the Rail Regulator (December 1999). 35
TOC staff numbers taken from Affuso, Angeriz and Pollitt (2002); Railtrack data from Railtrack Annual Reports.
36
Furthermore, a recent survey of rail transport efficiency carried out by Oum, Waters
II and Yu (1999) found that increased competition (driven by liberalisation and
deregulation) led to improved efficiency in almost all of the papers reviewed37. This
finding was confirmed during the 2000 Periodic Review of Railtrack’s access charges,
where international and UK evidence all pointed to the strong efficiency savings expected
from change of ownership (and deregulation). These arguments were used to inform the
Regulator’s decision on future efficiency targets for Railtrack over the second control
period (2001 to 2006).
3. Allocation of efficiency savings
Table 7 shows the allocation of the efficiency gains/(losses) between producers,
government and consumers. ΔGov/(ΔProd) include the privatisation proceeds
/(payments). The subsidy data used in the analysis include both OPRAF subsidies and
PTE grants. The units of the data in Table 7 are £million (discounted).
The key result from the above table is that the consumer benefits from privatisation
to the tune of £1.2bn. Average revenue (passenger and freight revenue divided by a
composite volume index based on passenger miles and freight tonne-miles) was lower in
real terms in every year since privatisation than before the sell-off (see Figure 5 below).
This gain has been secured, in part, by the arrangements put in place to constrain price
increases on regulated fares below the rate of inflation. Before privatisation, prices were
37
often increased in real terms to choke off demand (the counterfactual assumes that this
[image:37.612.94.510.161.422.2]policy would have been continued).
TABLE 7
Allocation of Efficiency Savings
Discount rate
6% 10%
Pro-privatisation scenario (cost fall of 0% pa)
ΔGov 2,400 3,900
ΔProd 38 200 (2,000)
ΔCust 1,200 1,200
ΔW 3,800 3,100
Central scenario (cost fall of 1% pa)
ΔGov (300) 1,300
ΔProd 200 (2,000)
ΔCust 1,200 1,200
ΔW 1,100 500
Pro-public scenario (cost fall of 2% pa)
ΔGov (2,900) (1,100)
ΔProd 200 (2,000)
ΔCust 1,200 1,200
ΔW (1,500) (1,900)
Overall, under the Central Scenario, consumers gain slightly more than the level of
savings, leaving producers and government together with a loss of £100m. The split
between government and producers takes accounts of the privatisation sales proceeds
(£7bn in present value terms – see Table 8 below). However, the split between the two
groups is also highly sensitive to the assumption made about the government’s savings
through reduced capital investment (and correspondingly the level of private capital
investment), which is not the focus of this paper.
38
* Weighted index based on passenger miles and freight tonne-miles.
TABLE 8
Rail Privatisation Proceeds
Rail Privatisation proceeds £bn (current prices) £bn (present value)
Railtrack * ROSCOs Freight
Infrastructure & Maintenance cos. BR Central Services
Total 2.5 1.7 0.3 0.3 0.2 5.0 3.5 2.4 0.4 0.4 0.3 7.0
* Includes £596m of debt.
Sources: NAO Reports (HC 576, Session 1997/98; HC 25 Session 1998/99); Public Enterprise Partnerships Team, HM Treasury.
4. Capital costs
We have already noted that capital costs have been excluded from the social cost benefit
[image:38.612.95.509.411.537.2]analysis presented in this paper. Constructing a counterfactual scenario for capital
FIGURE 5
Actual and Counterfactual Average Revenue
30 35 40 45
88/89 89/90 90/91 91/92 92/93 93/94 96/97 97/98 98/99 99/00
T ot al R ev enue / V ol um e Inde x *
investment is especially difficult, since it is affected by so many different factors (for
example, the timing of large enhancement projects; traffic levels; the lumpy nature of
renewal programmes; cash constraints imposed by Treasury before privatisation; and
investment delays resulting from the privatisation process itself). Problems with capital
measurement and comparability mean that railway efficiency studies often focus solely
on operating costs.
However, railway investment is important in the present context for three reasons.
First of all, the overall level of capital investment will impact on output quality (safety,
asset condition and performance). Secondly, the obvious question arises concerning the
relative efficiency of capital investment under public and private ownership. Finally, it is
possible that capital substitution effects may have contributed to the operating efficiency
savings reported in the previous sub-section. Whilst there is insufficient information to
consider these effects within the formal SCBA methodology, in the discussion below we
seek to draw some indicative conclusions from the available data.
(a) Capital investment levels before and after privatisation
The privatised rail industry has been heavily criticised for its record on safety and
performance. Much of this criticism has been directed at Railtrack, which, it is argued,
has failed to invest sufficiently to maintain the condition of the network. However, the
key question for this paper is whether the position would have been better or worse under
already noted. However, the data suggests that it is highly unlikely that investment levels
would have been higher under public ownership (see table 9 below).
Table 9 shows the total investment in Britain’s rail industry over the period 1988/89
to 1999/00, as well as the breakdown between rolling stock and other (which largely
relates to infrastructure renewal and enhancement)39. This data includes investment made
by BR in preparation for the running of services through the Channel Tunnel40. Table 9
shows that total investment (real terms) has been considerably higher in the
post-privatisation period, especially from 1998/99. In 1999/00, total investment was more than
double the level of twelve years earlier (1988/89).
[image:40.612.84.538.388.601.2]
TABLE 9
Investment in Britain’s Rail Industry
£m (99/00 prices) Rolling Stock Other Total
1988/89 1989/90 1990/91 1991/92 1992/93 1993/94 1994/95 1995/96 1996/97 1997/98 1998/99 1999/00 316 331 432 561 644 493 414 224 51 120 180 236 739 927 910 1039 1125 890 1025 1007 1277 1508 1867 2012 1055 1258 1342 1600 1769 1383 1439 1231 1328 1628 2047 2248 Source: SRA 39
Although there are some definitional changes (from 1994/95 and post 1995/96), these do not appear to have a significant impact on the data.
40
However, it is clear that there are two stories here. Rolling stock investment has been
much lower in the post-privatisation environment (though the pre-privatisation data
includes rolling stock for the Channel Tunnel). The privatisation process itself created
considerable uncertainty which impacted on investment in the transition period (93/94 to
95/96); and the newly privatised industry was slow to invest during the early years (from
96/97), although investment doubled in 2000/01 compared to 1999/00. However, we note
that the number of rolling stock units increased over the period (between 1995 and
2000)41, and the number of train miles also increased sharply as described earlier in the
paper. We therefore consider that the delay in rolling stock orders did not adversely affect
the availability of services.
On the other hand, infrastructure investment has been considerably higher after
privatisation. Table 9 shows that, in 1999/00, infrastructure investment was almost three
times the level of 1988/89. Furthermore, between 1995/96 and 2000/01, Railtrack was
projected to spend around £1 billion more on renewals than was anticipated at the time of
the Regulator’s review of access charges in 1995 (this projection was made before the
Hatfield accident)42. Whilst the Regulator has argued that Railtrack’s investment was still
too low, given the sharp rise in traffic growth on the network, it is far from clear that
more investment would have been forthcoming under public ownership. It is well
recognised that public sector cash limits led to persistent underinvestment in the rail
network during BR’s stewardship, as table 9 shows.
In conclusion, the evidence shows that investment has been much higher after
privatisation than under the former BR period – especially in the key area of
41
See Affuso, Angeriz and Pollitt (2002). 42
infrastructure investment. Given this data, we conclude that it is very unlikely that
investment levels would have been higher under the counterfactual scenario; and indeed,
may have been considerably lower. We therefore expect that many of the output quality
issues, which have arisen since privatisation, would also have occurred under continued
public ownership (assuming the same level of traffic growth). Output quality trends are
discussed further in Section IV.5 below.
(b) Efficiency of capital investment
Data on total capital expenditure is of little help in comparing the efficiency with which
rail projects have been planned and delivered under public and private ownership.
Furthermore, we are not aware of any academic studies which have attempted such an
analysis. This is unsurprising, given the difficulty of making like-for-like comparisons,
especially between large, complex projects, which make up the bulk of Railtrack’s capital
programme. An alternative way of assessing the efficiency of capital investment (or
project management), is to compare initial forecasts of project costs with the final
outturn. However, this approach suffers from the problem that the final cost of a project
may change due to many factors which are not related to efficiency (for example scope
changes).
A case in point, is the ongoing West Coast Main Line (WCML) upgrade project.
This project was originally budgeted (1996) to cost £2.3bn. By the Periodic Review
10)43. This project is often quoted in the media as an example of the inefficiency of the
privatised rail industry in delivering large capital projects.
However, the majority of the cost overrun can be explained by two factors. First, the
decision to adopt a conventional signalling strategy (after the original, more advanced
technology had proved unworkable). Second, the re-evaluation of the renewals element of
the programme, as Railtrack developed a better knowledge of the poor state of the track
inherited from BR, as well as the impact of traffic growth on the network since
privatisation. Note that the bulk of the cost increase in table 10 relates to the core,
renewal element of the programme. It should also be noted that the original cost estimates
for the core investment programme were prepared - and contracts signed - whilst
Railtrack was still under public ownership (March 1996).
TABLE 10
The Estimated Cost of the West Coast Main Line Project
Categories of expenditure £m 1998/99 prices
1996 2000
Core investment programme (renewal)
Upgrade
Total cost
£ 1.5bn*
£0.8bn**
£2.3bn
£3.9bn
£1.9bn
£5.8bn
* Contracts signed in March 1996 (before the privatisation of Railtrack). ** Contracts signed in two stages (October 1996 and June 1998).
Source: ORR.
43
To put the WCML project into perspective, it is worth considering some other
examples. Skamris and Flyvbjerg (1997) provide evidence on cost overruns for large rail
and road projects in the UK, US and Sweden (during the last 15 years). Their study found
that cost overruns of 50% to 100% are common; and also reported overruns on some
projects in the range 100% to 500% (though they note that this analysis is problematic,
since part of the overspends may be due to project rescoping).
In respect of the former BR period, we have found little available evidence on
forecast and final outturn costs for major projects44. The one project which we have been
able to identify is British Rail’s investment programme in preparation for Channel Tunnel
services (covering the period 1985/86 to 1993/94). The original estimate for the project
was £700m (1999/00 prices), compared with the final outturn of £1.8 billion (an apparent
overrun of around 150%)45. As with the other analyses, it is difficult to identify the
reasons for this increase (for example, to separately identify changes in scope).
However, we also note that four separate reports (Monopolies and Mergers
Commission, 1980, 1989, and 1991 and National Audit Office, 1985) highlighted
concerns over the investment policies of British Rail and other nationalised industries
during the 1980s and early 1990s. In particular, questions were raised over the impact of
(Treasury-imposed) financial constraints, both on the level of funding (with consequent
implications for asset condition and safety), as well as their impact on the ability of
British Rail, and others, to develop sensible long-term plans. The reports also noted the
failure of public sector organisations to compare project outcomes with the original plans.
44
We have examined a number of sources: BR Annual Reports (1970-1974), National Audit Office, Public Account Committee, Select Committees (1960s onwards).
45
Finally, Figure 6 shows the range of over and under-spends on a sample of all
Railtrack projects (>£10m) completed during 2000/01 and 2001/02. These figures
compare project outturn cost with revised budget. The revised budget takes some account
of project scope changes, as well as the realisation of risks which were identified at the
time that the original budgets were set. On average, these data show cost overruns of 6%
(compared to the revised budget), though many projects came in under budget. When
compared against the original budget or authorisation value, the average cost overrun is
29% (though this average includes projects with overruns in excess of 1000%, which
clearly indicate significant changes in project scope).
Source: Railtrack
In conclusion, we do not believe that there is sufficient evidence to determine
[image:45.612.96.496.356.581.2]whether (rail) capital investment is more or less efficient under public or private
FIGURE 6
Railtrack Capital Project Cost: Variance Against Forecast
0 10 20 30 40 50 60
<20% -11% to -20% -1% to -10% 0% to 10% 11% to 20% >20%
Cost overspend/(underspend)
ownership. Whilst the privatised rail industry has been criticised in this regard, it is clear
that major problems existed under the old BR system. Evidence from other sources
suggests that significant cost overruns, such as those observed on the Channel Tunnel and
WCML rail projects, are common for large, complex infrastructure projects.
(c) Capital substitution effects
As noted above, it is possible that the operating cost savings reported in Section IV.2 are
in part explained by capital substitution effects. However, we argue that such effects do
not have a significant impact on our analysis. First of all, the counterfactual operating
cost assumption is based on labour productivity and operating cost data, which itself
would be impacted by capital substitution during the pre-privatisation period. Secondly,
TOC initiatives have been a major driver of cost savings since privatisation (see above);
however TOC capital investment is not significant relative to overall industry investment
levels. Finally we note that Railtrack’s total costs (including depreciation) have fallen by
almost the same percentage as operating costs since privatisation (6.5% compared with
6.9% for operating costs)46.
5. Output quality
The previous analyses have demonstrated that privatisation has resulted in significant
improvements in operating efficiency. Evidence has also been presented which suggests