Development and preliminary testing of the new five-level version
of EQ-5D (EQ-5D-5L)
M. Herdman•C. Gudex•A. Lloyd•
MF. Janssen• P. Kind•D. Parkin •
G. Bonsel• X. Badia
Accepted: 24 March 2011 / Published online: 9 April 2011
The Author(s) 2011. This article is published with open access at Springerlink.com
Abstract
Purpose This article introduces the new 5-level EQ-5D
(EQ-5D-5L) health status measure.
Methods EQ-5D currently measures health using three
levels of severity in five dimensions. A EuroQol Group task force was established to find ways of improving the instrument’s sensitivity and reducing ceiling effects by increasing the number of severity levels. The study was performed in the United Kingdom and Spain. Severity labels for 5 levels in each dimension were identified using response scaling. Focus groups were used to investigate the face and content validity of the new versions, including hypothetical health states generated from those versions.
Results Selecting labels at approximately the 25th, 50th,
and 75th centiles produced two alternative 5-level versions.
Focus group work showed a slight preference for the wording ‘slight-moderate-severe’ problems, with anchors of ‘no problems’ and ‘unable to do’ in the EQ-5D func-tional dimensions. Similar wording was used in the Pain/ Discomfort and Anxiety/Depression dimensions. Hypo-thetical health states were well understood though partici-pants stressed the need for the internal coherence of health states.
Conclusions A 5-level version of the EQ-5D has been
developed by the EuroQol Group. Further testing is required to determine whether the new version improves sensitivity and reduces ceiling effects.
Keywords Health-related quality of life EQ-5D
Development5 level
EQ-5DTMis a trade mark of the EuroQol Group. All EQ-5D products
are distributed exclusively from the EuroQol Executive Office ([email protected]).
M. Herdman (&)
Insight Consulting and Research, Cami Ral 266 287a, 08301 Mataro´, Spain
e-mail: [email protected]
M. Herdman
CIBER en Epidemiologı´a y Salud Pu´blica (CIBERESP), Barcelona, Spain
M. Herdman
Health Services Research Unit, Institut Municipal d’Investigacio´ Me`dica (IMIM-Hospital del Mar), Barcelona, Spain
C. Gudex
Department of Endocrinology, Odense University Hospital, Odense, Denmark
A. Lloyd
Oxford Outcomes, Oxford, United Kingdom
MF.Janssen
EuroQol Group Executive Office, Rotterdam, The Netherlands
P. Kind
Centre for Health Economics, University of York, York, United Kingdom
D. Parkin
NHS South East Coast, Horley, United Kingdom
G. Bonsel
Perinatal Care and Public Health, Erasmus Medical Center, Rotterdam, The Netherlands
X. Badia
Health Economics and Outcomes Research, IMS Health S.A, Barcelona, Spain
Introduction
The EQ-5D is a generic instrument for describing and valuing health. It is based on a descriptive system that defines health in terms of 5 dimensions: Mobility, Self-Care, Usual Activities, Pain/Discomfort, and Anxiety/ Depression [1]. Each dimension has 3 response categories corresponding to no problems, some problems, and extreme problems. The instrument is designed for self-completion, and respondents also rate their overall health on the day of the interview on a 0–100 hash-marked, ver-tical visual analogue scale (EQ-VAS). The EQ-5D has been widely tested and used in both general population and patient samples and has been translated into over 130 dif-ferent language versions [www.euroqol.org].
The EQ-5D was designed to measure decrements in health. Substantial use of the instrument has shown that it can suffer from ceiling effects, particularly when used in general population surveys but also in some patient popu-lation settings [2–8]. As a result, there may be issues regarding its ability to measure small changes in health, especially in patients with milder conditions. In light of these possible limitations, and stimulated by demand from the clinical field, the EuroQol Group decided to explore ways of improving the EQ-5D’s measurement properties.
In 2005, a task force was established within the EuroQol Group to investigate methods to improve the instrument’s sensitivity to small and medium health changes and to reduce ceiling effects. Initial discussions focused both on expanding the descriptive system by adding additional dimensions and also on expanding the number of levels of severity in each dimension [9]. The task force decided that there should be no change in the number of dimensions for a new version of EQ-5D. Twenty-five years’ experience of using the EQ-5D has provided evidence that the original choice of dimensions was a reasonable one, though there are some areas in which the range of dimensions included may not be optimal [10,11]. Moreover, the EuroQol Group has considerable experience with the measurement and valuation of health using the current five dimension model and retaining that model would allow for an easier transi-tion from the existing EQ-5D to a new version.
In terms of the number of levels per dimension, previ-ously published studies by EuroQol Group members showed that prototype 5-level versions of EQ-5D could significantly increase reliability and sensitivity (discrimi-natory power) while maintaining feasibility and potentially reducing ceiling effects [12–15]. The choice of a five-level descriptive system is also supported by substantial psy-chometric literature [16–18]. It was therefore decided that the new version of the EQ-5D should include five levels of severity in each of the existing five EQ-5D dimensions and that the new version would therefore be called the
EQ-5D-5L. The existing EQ-5D will be renamed the EQ-5D-3L, which is how it will be referred to in the rest of this paper.
The objectives of the current study were to select severity labels for the EQ-5D-5L and to test the face and content validity of the resulting instrument. The study was performed simultaneously in the United Kingdom and Spain.
Methods
The EuroQol Group task force recommended that English and Spanish versions be developed in parallel, where they could also serve as root languages for further translations and adaptations of the expanded version.
The study consisted of two phases. In the first phase, carried out from June to November 2007, a pool of potential labels for the new levels was identified and pro-visional labels for the 5-level version were chosen from that pool after a response scaling task carried out in face-to-face interviews with convenience samples of lay respon-dents. In the second phase, carried out from May to July 2008, face and content validity of two alternative 5-level systems were tested in focus group sessions with healthy participants and those with chronic illness. The second phase was also used to test the face validity of a series of health states based on the 5-level versions. Different groups of respondents were used in the two phases of the study.
Participants in both phases were recruited to ensure a wide range of socio-demographic characteristics. For the response scaling phase, the UK participants were recruited via local newspaper advertisements, local community advertisements, and from an existing participant database. The Spanish participants were recruited from among par-ents from local schools and from patient associations. Patient focus groups included primarily individuals with arthritis, diabetes, or asthma. In all groups, adequate writ-ten and oral fluency in English or Spanish was required.
Written informed consent to participate was obtained from all participants in both phases of the study.
Phase 1: response scaling
clearly had to fit with the lexical structure used in the EQ-5D-3L, such as ‘I have no problems doing my usual activities’ and ‘I have some problems doing my usual activities’.
In order to select labels from the pool for the new levels, an interviewer-administered response scaling exercise similar to those used in previous studies [14,19,20] was adopted to estimate the severity represented by each label. For this exercise, respondents were shown a rating scale in the form of a vertical, hash-marked, 40 cm visual analog scale (VAS) with end points of 0 and 100 to be used as a visual aid in grading label severity. For the Mobility, Self-Care and Usual Activities dimensions, the same set of labels was used. The interviewer placed a card labeled ‘No problems’, ‘No pain/discomfort’, or ‘No anxiety/depres-sion’ as appropriate at the bottom of the scale (0) to act as the lower anchor and a card labeled ‘Unable to, ‘The worst pain or discomfort I can imagine’, ‘As anxious or depres-sed as I can imagine’ as the upper anchor (100). The respondent was then shown other labels from the pool singly in a quasi-random order and asked to assign a score between 0 and 100 to indicate label severity in relation to the lower and upper anchors.
The interviewer noted all scores, and when the respon-dent had rated all labels for a particular dimension, the interviewer laid them out in rank order alongside the VAS and asked the respondent to review the ranking and make any changes he or she thought necessary. If labels were reordered at this point, the respondent was asked to assign a new score to the relevant labels. Final scores assigned were recorded in an answer booklet. The scaling task was repeated for each dimension. Before finishing with the cards, the respondent was asked whether any of the labels sounded unusual, or should not be used in relation to a particular dimension.
Respondents rated labels for all five dimensions. The three functional dimensions (Mobility, Self-Care and Usual Activities) were always interspersed by the Pain/Discomfort and Anxiety/Depression dimensions, so that the respondent did not rate the same label types consecutively. Before rating the actual labels, respondents performed a practice task based on levels of overall health to get used to the study requirements. Data on age, level of education, main activity, and use of any current treatment for health problems, toge-ther with the existing EQ-5D-3L descriptive system and EQ-VAS, were collected after the response scaling task.
Before the main response scaling task, a pilot test was performed to test study procedures and materials. Based on the results of the pilot study, some labels were elim-inated from the initial pool to achieve a more manageable number for the response scaling task. In particular, any labels using additional modifiers such as ‘very’ or ‘quite’ were eliminated as were any that were considered
excessively colloquial or too high a level of language. After pilot testing, it was concluded that the feasible limit was about 10–12 labels per dimension for an individual respondent.
Responses to the scaling task were analyzed by calcu-lating means and medians and the corresponding standard deviations and interquartile ranges (IQR). Labels to go forward for further testing were selected based on criteria that had been identified before data collection started. These included selecting labels close to or at the 25th, 50th, and 75th centiles on the VAS, ensuring consistency across dimensions and coherence with wording in the descriptive system. No quantitative comparison of label scores was carried out in deciding which labels to carry forward to the next stage; median scores were simply used as a guide to determine which labels fell closest to the 25th, 50th, and 75th centiles. Labels were also required to be in colloquial language. The choice of labels and their appropriateness was discussed by the task force at several meetings during the course of the study.
Phase 2: testing the face and content validity of alternative 5-level versions
The results of the response scaling task led to an inter-mediary result of two, rather than one, alternative 5-level versions in both UK English and Spanish (for an expla-nation, see Results). The second part of the study aimed to assess the ease of use, comprehension, interpretation, and acceptability of these two versions and to use these results to decide on a final, definitive version for validation work. A further aim of this part of the study was to evaluate the face validity of some hypothetical health states generated by the 5-level descriptive systems. To this purpose, the two alternative versions were tested in 8 focus groups in each country (total of 16 groups); four of these were composed of healthy participants and four under treatment for a health condition.
participants were asked their preferences for the alternative descriptive systems. The order of administration of ver-sions 1 and 2 was alternated between the groups to control for possible ordering effects, and groups were assigned randomly to the different orders.
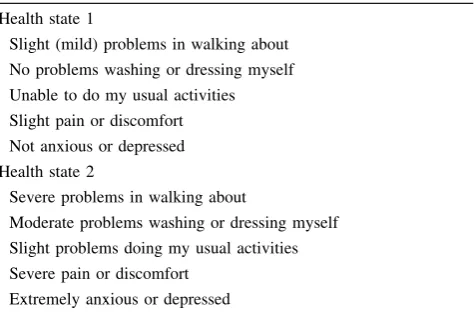
In the final stage of the focus groups, participants dis-cussed a set of hypothetical health states produced by combining different levels from the 5 dimensions using the alternative 5-level versions. Examples of the health states tested are shown in Table1. Participants reviewed the states and were asked to assess them for face validity, interpretability, and plausibility. The same procedures were used in the remaining groups, though the order in which the alternative versions of the questionnaire were administered was reversed.
The focus groups were run using a structured ‘script’ or guide, so the analysis was based initially on grouping and contrasting participant statements relating to each of the specific issues addressed. Thematic content analysis [21] was used to explore issues in more depth and to examine the transcripts for other, non-scripted statements and expressions.
Results
Response scaling
In Spain, in order to obtain a final sample of 40 individuals, 53 people were initially invited to participate. Of the 40 who agreed to attend, 3 failed to attend on the day of the interview, leaving a final sample of 37. In the UK, the recruitment strategy used resulted in a favorable response from the public so all those interested in participating in the study were invited to take part, until 40 participants were
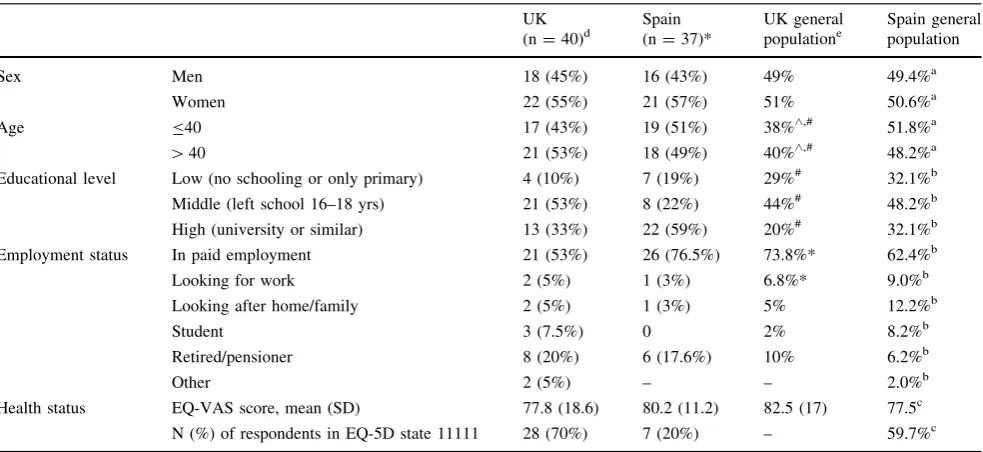
recruited. All 40 participants attended the interviews as scheduled. Sample characteristics of those who participated in the response scaling exercise in the UK and Spain are shown in Table 2 together with reference values for the two countries. Participants were evenly distributed by age and gender in both countries, though in terms of educa-tional level the sample in Spain included more people with higher levels of education, and in both countries the pro-portion of the samples with higher levels of education was considerably greater than that of the general population reference values.
The results of the response scaling task for the dimen-sions of Mobility, Self-Care and Usual Activities are shown in Table3 and for the dimensions of Pain/Dis-comfort and Anxiety/Depression in Table4. Rank ordering of the labels was similar between the two countries on all dimensions, and median ratings for the same labels were generally similar across dimensions and the two languages. For example, ‘slight’ and ‘leve’ had a median score of 15 across the 3 functional dimensions (except for one rating of 20 for that label in Spain for the self-care dimension); ratings for ‘severe’ and ‘grave’ were likewise all between 82 and 88 on the functional dimensions, and ‘moderate’ and ‘moderados’ were assigned median scores between 40 and 50 on all dimensions across the two languages. Larger differences were observed for some labels such as ‘may-ores’ and ‘major’ in the functional dimensions or ‘quite’ and ‘bastante’ on the anxiety/depression dimension, but those labels were not amongst those finally selected. The label which came closest to the mid-point in terms of scaling was ‘moderate’. Logically, the label ‘moderate’ describes the nature of the problem rather than the quantity of problems (e.g. ‘a few’). Therefore, a decision was made to select other labels to be consistent with this.
Based on this decision, two alternative 5-level versions were identified: in the case of the functional dimensions, the UK alternatives tested were ‘No problems-Minor problems-Moderate problems-Major problems-Unable to’ and ‘No Slight Moderate problems-Severe problems-Unable to’. In the Pain/Discomfort and Anxiety/Depression dimensions, alternative labels tested were ‘mild’ and ‘slight’ as the second level, and ‘severe pain’ or ‘a lot of pain’ and ‘severely’ or ‘very’ anxious or depressed at the 4th level. A similar process for label selection was followed in Spain.
Focus groups
[image:4.595.52.290.555.713.2]Sample characteristics for the focus groups are shown in Table5. The main difference between the two countries is seen on educational level, with considerably higher levels of education in the UK sample; 93.3% of healthy partici-pants and 66.7% of patients in the UK sample had gone on Table 1 Examples of two of the health states tested in the phase 2
focus groups
Health state 1
Slight (mild) problems in walking about
No problems washing or dressing myself
Unable to do my usual activities
Slight pain or discomfort
Not anxious or depressed
Health state 2
Severe problems in walking about
Moderate problems washing or dressing myself
Slight problems doing my usual activities
Severe pain or discomfort
to some form of higher education after school, compared with 33.3 and 21.0%, respectively, of the Spanish sample. In both Spain and the UK, participants generally found both of the two alternative versions easy to understand and complete, giving comments such as ‘‘Questions are
[image:5.595.53.545.71.297.2]well-formulated and specific’’. With reference to the new severity labels, participants commented that ‘‘they are very clear points, and there is no doubt that you go from less to more in each dimension’’ and that ‘‘all different levels seem to be covered’’. Some Spanish respondents thought Table 2 Sample characteristics of participants in the response scaling task with UK and Spain general population figures for comparison
UK (n=40)d
Spain (n=37)*
UK general populatione
Spain general population
Sex Men 18 (45%) 16 (43%) 49% 49.4%a
Women 22 (55%) 21 (57%) 51% 50.6%a
Age B40 17 (43%) 19 (51%) 38%^,# 51.8%a
[40 21 (53%) 18 (49%) 40%^,# 48.2%a
Educational level Low (no schooling or only primary) 4 (10%) 7 (19%) 29%# 32.1%b
Middle (left school 16–18 yrs) 21 (53%) 8 (22%) 44%# 48.2%b
High (university or similar) 13 (33%) 22 (59%) 20%# 32.1%b
Employment status In paid employment 21 (53%) 26 (76.5%) 73.8%* 62.4%b
Looking for work 2 (5%) 1 (3%) 6.8%* 9.0%b
Looking after home/family 2 (5%) 1 (3%) 5% 12.2%b
Student 3 (7.5%) 0 2% 8.2%b
Retired/pensioner 8 (20%) 6 (17.6%) 10% 6.2%b
Other 2 (5%) – – 2.0%b
Health status EQ-VAS score, mean (SD) 77.8 (18.6) 80.2 (11.2) 82.5 (17) 77.5c
N (%) of respondents in EQ-5D state 11111 28 (70%) 7 (20%) – 59.7%c ^ Data for age is provided for the age groupsB44,
[45
# Data from April 2009
* Data for England and Wales only
a Data from Spanish National Institute of Statistics for 2007 (http://www.ine.es) accessed September 10th, 2010) b Data from 2006 Spanish National Health Survey
c Data from 2006 Catalan Health Interview Survey d In the UK, missing data is n=2
e UK census data, 2001
Table 3 Comparison of median (IQR) scores for mobility, self-care, and usual activities labels, UK and Spain (Spanish labels in parenthesis)
Slight Minor A few* Some Moderate Many A lot Major Severe Very
severe
Extreme
Leves Menores Algunos Unos cuantos
Moderados Bastantes Muchos Mayores Graves Muy graves
Extremos
Mobility
UK 15(10–25) 17(10–25) 20(11–30) 30(20–40) 43(35–50) 60(51–75) 70(59–80) 85(80–90) 82(76–90) 90(85–95) 90(90–95)
Spain 15(8–28) 17(10–28) 25(15–46) 35(25–42) 47(28–50) 70(58–75) 75(69–80) 70(60–80) 85(80–90) 95(87–99) 95(90–98)
Self-care
UK 15(10–29) 20(10–29) 20(15–30) 30(20–39) 45(40–50) 65(60–79) 70(60–75) 80(75–90) 85(80–90) 95(90–97) 90(90–95)
Spain 20(10–27) 20(12–30) 25(14–31) 35(20–50) 42(30–50) 65(60–75) 79(70–88) 70(60–80) 88(80–90) 95(90–98) 95(90–99)
Usual activities
UK 15(10–25) 15(10–25) 25(16–40) 30(20–40) 50(35–50) 70(60–75) 70(55–75) 80(75–90) 85(80–90) 90(86–95) 90(90–95)
Spain 15(9–25) 15(9–22) 20(10–30) 30(20–45) 40(30–50) 69(47–75) 70(60–85) 75(65–80) 85(80–92) 90(88–98) 95(90–99)
[image:5.595.50.542.443.490.2]that it might be difficult to distinguish between some of the labels, particularly at the lower end of the scale. However, the results of the response scaling exercise and comments regarding the type of problems reflected by each of the labels suggested that most respondents were perfectly able to distinguish between the different labels used.
The alternative versions were not equally attractive and in both countries participants tended to prefer ver-sion 2, which used ‘slight’, ‘moderate’, and ‘severe’ for the central levels in the Mobility, Self-Care, and Usual Activities dimensions, as opposed to ‘minor’, ‘moderate’, and ‘major’ problems. The latter were generally consid-ered less colloquial. A typical comment was that you might use them ‘‘talking to a doctor or something…but I
can’t imagine saying to a friend or family having minor problems walking about’’. ‘Slight’ and ‘severe’ were described by one participant as being ‘‘common lan-guage’’ which ‘‘would trigger a response without having to think about it a lot’’. A smaller number of participants did prefer ‘minor’ and ‘major’, suggesting that it was ‘more modern language’; other participants suggested that there was very little difference between the alter-native sets of labels.
[image:6.595.49.545.75.216.2]In the Pain/Discomfort and Anxiety/Depression dimen-sions, participant preferences regarding labels were not so clear. In both the UK and Spanish versions, therefore, it was decided to maintain the same scaling as in the func-tional dimensions (‘slight’, ‘moderate’, ‘severe’).
Table 4 Comparison of median (IQR) scores for pain/discomfort and anxiety/depression labels, UK and Spain
Pain/discomfort
UK A little Slighta Mild Some Moderate – A lot Severe Very severe Extreme
10(10–20) 10(10–20) 15(10–25) 20(10–30) 45(35–50) – 70(60–75) 80(70–85) 90(85–93) 90(85–95)
Spain Un poco – Leve Algo de Moderado Bastanteb Mucho Fuerte Muy fuerte Extremo
18(10–26) – 18(10–26) 20(10–30) 45(30–50) 70(59–75) 75(69–80) 75(65–82) 85(75–90) 95(90–99)
Anxiety/depression
UK A little Slightly Mildly Somewhat Moderately Quite Very Severely Very severely Extremely
16(10–25) 20(10–30) 25(11–35) 30(16–40) 40(30–50) 43(30–59) 78(70–80) 85(80–90) 90(85–95) 90(85–95)
Spain Un poco Ligera-mente
Levemente Algo Moderada-mente
Bastante Muy Severa Muy severa Extremada-mente
20(10–30) 15(10–25) 15(10–25) 20(10–38) 40(30–50) 65(50–70) 75(70–80) 85(78–90) 85(75–90) 95(90–99)
a UK only, no equivalent tested in Spain b Spain only, no equivalent tested in UK
Labels ordered by UK ranking
Median values are in bold
Table 5 Sample characteristics of respondents in the focus groups; healthy participants and patient groups, UK and Spain
UK Spain
Healthy N=15 PatientsaN=15 Healthy N=18 Patients N=19 Sex
Women, N (%) 8 (53.3%) 5 (33.3) 12 (66.6) 11 (57.8)
Age
Years, mean (SD) 42.5 (16.7) 43.1 (17.3) 45.7 (11.2) 63.3 (18.0)
Educational level, N (%)
Further education after leaving school 14 (93.3) 10 (66.7) 6 (33.3) 4 (21)
Main activity, N (%)
Employed 8 (53.3) 6 (40.0) 12 (66.6) 11 (57.8)
Seeking work 3 (20.0) 4 (26.6) 3 (16.6) 1 (5.2)
Student 3 (20.0) 1 (6.7) – –
Retired 1 (6.7) 3 (20.0) 3 (16.6) 7 (36.8)
Missing 0 (0.0) 1 (6.7) – –
[image:6.595.57.546.308.495.2]Participants’ comments regarding the way they inter-preted the severity labels showed that the labels functioned well at the intended level of measurement. For example, to describe ‘slight problems’ in the self-care dimension a patient suggested ‘‘Maybe if you have a pulled muscle in your back and it’s difficult to wash your hair.’’ When referring to ‘moderate problems’ with mobility, partici-pants explained that ‘‘even though I have to use a crutch to get around, I can still get up on my own, and I can get around’’ and ‘‘I have moderate problems with walking because of my knee.…it describes it very well…neither a lot nor a little.’’ On the other hand, to describe ‘severe problems’ in this dimension, examples included people who experienced great pain when walking due to arthritis or a herniated disc.
Testing of health states based on new labeling systems
Participants found it relatively easy to understand the health states, whichever version was used. In fact, com-ments focused more on health state content, and particu-larly on what they saw as contradictions or a lack of realism in the health states, rather than on the way the health states were worded. For example, one respondent said that for her ‘‘washing and dressing are everyday activities and are therefore covered by usual activities [so the two dimensions should not be separate]’’. On the other hand, the labels used were not an impediment to understanding the health states, and participants were in general easily able to distinguish between health states. Both alternative versions of the 5-level descriptive system appeared to work equally well in this sense, though when asked explicitly the majority of participants preferred the ‘slight-moderate-severe’ alternative in the first three dimensions.
Discussion
This paper reports the process and results of developing a new 5-level version of the EQ-5D in UK English and Spanish for Spain. By using response scaling and focus groups, it was possible to develop 5-level versions in UK English and Spanish that have demonstrated initial content and face validity. The results of the response scaling exercise suggest that the labels selected are well-distributed across the health continuum and that their distribution was similar in the two countries.
Although 5-level versions of the EQ-5D have previously been developed and applied, they were experimental ver-sions prepared and tested by individual group members or research teams [12–15]. The UK English and Spanish versions reported here are the first to be produced as a
result of an official EuroQol Group initiative, and they should be considered the definitive versions, dependent on further testing of validity, reliability, and sensitivity to change. The opportunity was also taken to harmonize wording within the instrument by, for example, rewording the poor health extreme of the Mobility dimension as ‘Unable to walk about’ instead of ‘Confined to bed’.
As regards the decision to use 5 levels in each dimen-sion, this issue was discussed at length as it was also possible to use different numbers of levels across domains (in fact, the first version of the EQ was a six-domain instrument, with 3 domains having 3, the others having 2 levels [22]). Two lines of argument resulted in the choice of a uniform five-level instrument. First of all, there seemed to be no natural or obvious argument to apply different levels: all domains of the current EQ refer to ‘uncountable’ entities, where the full range must be refer-red to by general grading terms. These can be based on frequency or intensity of dysfunction/disability, but the principle is the same for all EQ domains. Likewise, we had no a priori preference for trying to discriminate more (or less) on a given domain than on others. Second, there are obvious practicalities in having an equalized system. Self-report of own health status (for description) and trade-off tasks (for valuation) are arguably easier to explain and understand: using a dissimilar number of levels may lead to questions about ‘missing’ levels. Consistency in choice of labels across dimensions (using ‘slight’, ‘moderate’, ‘severe’ wherever possible) should simplify operational aspects of using the questionnaire by facilitating respon-dent interpretation, aiding the construction of health states and simplifying the translation process. We are aware that terms such as ‘slight’, ‘moderate’, and ‘severe’ can be open to intra- and inter-cultural variability in interpretation and, for that reason, have modified the translation procedure for the 5L version in order to test respondent interpretations of these terms more thoroughly.
Results on the response scaling task were substantially similar in the UK and Spain, and scores assigned to labels generally varied only minimally across dimensions. For example, response scaling scores for ‘moderate’ always fell between 40 and 50 regardless of both country and dimen-sion. These results suggest some robustness in the response scaling scores.
continuum. Quantitative testing of the new EQ-5D-5L will provide additional evidence on the appropriateness of the labels selected.
This study provided an opportunity to test the compre-hensibility and face validity of health states derived from the EQ-5D-5L. Again, participants had little difficulty understanding the level of problems that the new labels were intended to describe; the majority of comments instead referred to what participants in both countries considered to be unlikely or self-contradictory health states. For example, some respondents thought that ‘having no problems with washing or dressing’ would sit uncom-fortably with ‘being unable to walk’ in the same health state. However, this is more an issue of the relationship among the attributes than the within attribute level descriptions and as such is likely to be pertinent for both the 3 and 5 level versions of the EQ-5D. To take this type of comment into account, the EuroQol Group has been discussing the use of such plausibility testing and cognitive debriefing prior to future valuation studies for the 5-level version.
Spanish and English were chosen as the two languages for the initial development of the EQ-5D-5L because they are two of the most widely spoken languages worldwide and because they can, to a certain extent, act as root lan-guages for translation into a number of other lanlan-guages. French and Chinese versions of the EQ-5D-5L have also recently been developed using a similar methodology.
Limitations
One limitation of the current study was that, for practical reasons, the test–retest reliability of the response scaling scores was not assessed. It was also observed that none of the major instruments had undertaken test–retest in this type of scaling exercise [19,20]. A further limitation of the study may have been the response scaling method used, in which labels were initially rated independently with only the VAS anchors providing context. Although respondents later had the opportunity to redress any ratings they saw as inconsistent when labels were ranked based on the ratings they had supplied, values may have differed if labels had been rated initially in the context of other labels, e.g., using a paired-choice exercise. Nevertheless, the findings were quite consistent across dimensions and countries, with good face validity in the focus groups, suggesting that the final ordering was acceptable to respondents. A further limitation was that we used convenience samples for the response scaling exercise which were not representative of the national populations and the sample sizes used were quite small, though in line with similar studies [20, 23].
These issues may limit the generalizability of the findings. Finally, in both the response scaling exercise and the focus groups, the proportion of participants with tertiary level education was high. This may have led to more consistent results and greater acceptance of wording than would have been the case if the sample had included more respondents at lower educational levels. Future studies of this type should aim to include more balanced, representative samples.
The next step in development will be to field test the EQ-5D-5L and EQ-5D-3L together in general population and clinical samples to evaluate the psychometric proper-ties (sensitivity, validity, and reliability) of the EQ-5D-5L and to compare them with the EQ-5D-3L. Further work is also required to determine the degree of cross-cultural equivalence of the severity labels. For this, properly con-structed samples using equal probability of selection methods are required which are sufficiently large to investigate the issues raised in this paper. It will also be necessary to develop value sets for the EQ-5D-5L based on new, large-scale valuation exercises. Preparation for these valuation exercises is on-going.
In conclusion, official versions of the new EQ-5D-5L now exist in UK English and Spanish for Spain, and translations have already been produced for use in a further 25 countries. The UK English and Spanish for Spain ver-sions have shown initial content and face validity, though further psychometric testing is required not only of validity and reliability but also sensitivity to change of the EQ-5D-5L, which is a necessary prerequisite for the development of a valuation set for the EQ-5D-5L. It is expected that the EQ-5D-5L will have better discriminative capacity and sensitivity to change than the EQ-5D-3L as well as smaller ceiling effects.
Acknowledgments The study was financed by grants from the EuroQol Foundation.
Conflict of interest All of the authors are current members of the EuroQol Group and the current study was financially supported by the EuroQol Group.
Open Access This article is distributed under the terms of the Creative Commons Attribution Noncommercial License which per-mits any noncommercial use, distribution, and reproduction in any medium, provided the original author(s) and source are credited.
Appendix 1
UK English MOBILITY
I have no problems in walking about I have slight problems in walking about I have moderate problems in walking about I have severe problems in walking about I am unable to walk about
SELF-CARE
I have no problems with washing or dressing myself I have slight problems with washing or dressing myself I have moderate problems with washing or dressing myself I have severe problems with washing or dressing myself I am unable to wash or dress myself
USUAL ACTIVITIES (e.g. work, study, housework, family or leisure activities) I have no problems doing my usual activities
I have slight problems doing my usual activities I have moderate problems doing my usual activities I have severe problems doing my usual activities I am unable to do my usual activities
PAIN / DISCOMFORT I have no pain or discomfort I have slight pain or discomfort I have moderate pain or discomfort I have severe pain or discomfort I have extreme pain or discomfort
ANXIETY / DEPRESSION I am not anxious or depressed I am slightly anxious or depressed I am moderately anxious or depressed I am severely anxious or depressed I am extremely anxious or depressed
Spanish for Spain MOVILIDAD
No tengo problemas para caminar Tengo problemas leves para caminar Tengo problemas moderados para caminar Tengo problemas graves para caminar No puedo caminar
AUTO-CUIDADO
No tengo problemas para lavarme o vestirme Tengo problemas leves para lavarme o vestirme Tengo problemas moderados para lavarme o vestirme Tengo problemas graves para lavarme o vestirme No puedo lavarme o vestirme
ACTIVIDADES COTIDIANAS (Ej.: trabajar, estudiar, hacer las tareas domésticas, actividades familiares o actividades durante el tiempo libre)
No tengo problemas para realizar mis actividades cotidianas Tengo problemas leves para realizar mis actividades cotidianas Tengo problemas moderados para realizar mis actividades cotidianas. Tengo problemas graves para realizar mis actividades cotidianas No puedo realizar mis actividades cotidianas
DOLOR / MALESTAR No tengo dolor ni malestar Tengo dolor o malestar leve Tengo dolor o malestar moderado Tengo dolor o malestar fuerte Tengo dolor o malestar extremo
ANSIEDAD / DEPRESIÓN No estoy ansioso ni deprimido Estoy levemente ansioso o deprimido Estoy moderadamente ansioso o deprimido Estoy muy ansioso o deprimido
Estoy extremadamente ansioso o deprimido
.
References
1. Brooks, R. (1996). EuroQol: The current state of play.Health Policy, 37, 53–72.
2. Sullivan, P. W., Lawrence, W. F., & Ghushchyan, V. (2005). A national catalog of preference based scores for chronic conditions in the United States.Medical Care, 43, 736–749.
3. Badia, X., Schiaffino, A., Alonso, J., & Herdman, M. (1998). Using the EuroQol 5-D in the Catalan general population: Fea-sibility and construct validity. Quality of Life Research, 7, 311–322.
4. Devlin, N., Hansen, P., & Herbison, P. (2000). Variations in self-reported health status: Results from a New Zealand survey.The New Zealand Medical Journal, 113, 517–520.
5. Johnson, J. A., & Pickard, A. S. (2000). Comparison of the EQ-5D and SF-12 health surveys in a general population survey in Alberta, Canada.Medical Care, 38, 115–121.
6. Kind, P., Dolan, P., Gudex, C., & Williams, A. (1998). Variations in population health status: Results from a United Kingdom national questionnaire survey.BMJ, 316, 736–741.
7. Luo, N., Johnson, J. A., Shaw, J. W., Feeny, D., & Coons, S. J. (2005). Self-reported health status of the general adult U.S. population as assessed by the EQ-5D and Health Utilities Index. Medical Care, 43, 1078–1086.
8. Wang, H., Kindig, D. A., & Mullahy, J. (2005). Variation in Chinese population health related quality of life: Results from a EuroQol study in Beijing, China.Quality of Life Research, 14, 119–132.
9. Agt, H. M., & van Bonsel, G. J. (2005). The number of levels in the descriptive system. In P. Kind, R. Brooks, & R. Rabin (Eds.), EQ-5D concepts and methods: A developmental history (pp. 29–33). Dordrecht: Springer.
10. Espallargues, M., Czoski-Murray, C. J., Bansback, N. J., Carlton, J., Lewis, G. M., Hughes, L. A., et al. (2005). The impact of age-related macular degeneration on health status utility values. Investigative Ophthalmology & Visual Science, 46, 4016–4023. 11. Kaplan, R.M., Tally, S., Hays, R.D., Feeny, D., Ganiats, T.G.,
Palta, M., et al. (2011). Five preference-based indexes in cataract and heart failure patients were not equally responsive to change. Journal of Clinical Epidemiology, 64, 497–506.
12. Janssen, M. F., Birnie, E., Haagsma, J. A., & Bonsel, G. J. (2008). Comparing the standard EQ–5D three level system with a five level version.Value Health, 11, 275–284.
13. Pickard, A. S., De Leon, M. C., Kohlmann, T., Cella, D., & Rosenbloom, S. (2007). Psychometric comparison of the standard EQ-5D to a 5 level version in cancer patients.Medical Care, 45, 259–263.
14. Janssen, M. F., Birnie, E., & Bonsel, G. J. (2008). Quantification of the level descriptors for the standard EQ-5D three level system and a five level version according to 2 methods.Quality of Life Research, 17, 463–473.
15. Pickard, A. S., Kohlmann, T., Janssen, M. F., Bonsel, G. J., Rosenbloom, S., & Cella, D. (2007). Evaluating equivalency between response systems: Application of the Rasch model to a 3-level and 5-level EQ-5D.Medical Care, 45, 812–819. 16. Lissitz, R. W., & Green, S. B. (1975). Effect of the number of
scale points on reliability: A Monte Carlo approach.Journal of Applied Psychology, 60, 10–13.
17. Nishisato, S., & Torii, Y. (1970). Effects of categorizing con-tinuous normal variables on the product-moment correlation. Japanese Psychology Research, 13, 45–49.
18. Preston, C. C., & Colman, A. M. (2000). Optimal number of response categories in rating scales: Reliability, validity, dis-criminating power, and respondent preferences. Acta Psycho-logica, 104, 1–15.
19. Szabo, S. (1996). World Health Organization Quality of Life (WHOQOL) assessment instrument. In B. Spilker (Ed.),Quality of life and of life and pharmaeconomics in clinical trials (pp. 355–362). Philadelphia: Lippincott-Raven.
the IQOLA Project. International Quality of Life Assessment. Journal of Clinical Epidemiology, 51, 933–944.
21. Grbich, Carol. (1999).Qualitative research in health: An intro-duction. St Leonards, N.S.W.: Allen & Unwin.
22. Rabin, R., & de Charro, F. (2001). EQ-5D: A measure of health status from the EuroQol Group.Annals of Medicine, 33, 337–343.

![Regional Fund awards grants of 54 M.U.A. First allocation 1977- U.K. receives nearly £5 millio [sic]. European Communities Commission Press Release ISEC/2/77, 19 January 1977](data:image/gif;base64,R0lGODlhAQABAIAAAP///wAAACH5BAEAAAAALAAAAAABAAEAAAICRAEAOw==)