Normalize the Intensity of High-Intensity Interval
Training
Carrie Ferguson1,2*, John Wilson2, Karen M. Birch1, Ole J. Kemi2
1School of Biomedical Sciences, Faculty of Biological Sciences, University of Leeds, Leeds, United Kingdom,2Institute of Cardiovascular and Medical Sciences, College of Medical, Veterinary and Life Sciences, University of Glasgow, Glasgow, United Kingdom
Abstract
The tolerable duration of continuous high-intensity exercise is determined by the hyperbolic Speed-tolerable duration (S-tLIM) relationship. However, application of the S-tLIMrelationship to normalize the intensity of High-Intensity Interval Training
(HIIT) has yet to be considered, with this the aim of present study. Subjects completed a ramp-incremental test, and series of 4 constant-speed tests to determine the S-tLIMrelationship. A sub-group of subjects (n = 8) then repeated 4 min bouts of
exercise at the speeds predicted to induce intolerance at 4 min (WR4), 6 min (WR6) and 8 min (WR8), interspersed with bouts
of 4 min recovery, to the point of exercise intolerance (fixed WR HIIT) on different days, with the aim of establishing the work rate that could be sustained for 960 s (i.e. 464 min). A sub-group of subjects (n = 6) also completed 4 bouts of exercise interspersed with 4 min recovery, with each bout continued to the point of exercise intolerance (maximal HIIT) to determine the appropriate protocol for maximizing the amount of high-intensity work that can be completed during 464 min HIIT. For fixed WR HIIT tLIMof HIIT sessions was 399681 s for WR4, 8926181 s for WR6and 15176346 s for WR8, with total exercise
durations all significantly different from each other (P,0.050). For maximal HIIT, there was no difference in tLIMof each of
the 4 bouts (Bout 1: 229627 s; Bout 2: 262637 s; Bout 3: 235649 s; Bout 4: 235653 s; P.0.050). However, there was significantly less high-intensity work completed during bouts 2 (153.5640. 9 m), 3 (136.9638.9 m), and 4 (136.7639.3 m), compared with bout 1 (264.9658.7 m; P.0.050). These data establish that WR6provides the appropriate work rate to
normalize the intensity of HIIT between subjects. Maximal HIIT provides a protocol which allows the relative contribution of the work rate profile to physiological adaptations to be considered during alternative intensity-matched HIIT protocols.
Citation:Ferguson C, Wilson J, Birch KM, Kemi OJ (2013) Application of the Speed-Duration Relationship to Normalize the Intensity of High-Intensity Interval Training. PLoS ONE 8(11): e76420. doi:10.1371/journal.pone.0076420
Editor:Franc¸ois Hug, The University of Queensland, Australia
ReceivedMarch 22, 2013;AcceptedAugust 27, 2013;PublishedNovember 14, 2013
Copyright:ß2013 Ferguson et al. This is an open-access article distributed under the terms of the Creative Commons Attribution License, which permits unrestricted use, distribution, and reproduction in any medium, provided the original author and source are credited.
Funding:The authors have no support or funding to report.
Competing Interests:The authors have declared that no competing interests exist.
* E-mail: [email protected]
Introduction
In classic epidemiological data it is well established that there are significant health benefits associated with leading a physically active lifestyle (e.g. [1,2,3]). This assertion is further strengthened by the demonstration that training interventions can increase the maximal rate of pulmonary oxygen uptake (VVO_ 2max) (a primary measure of physical fitness/exercise capacity and performance, and a strong predictor of all-cause mortality [4,5]) (e.g. [6,7]); and improve both metabolic and cardiovascular function when integrated as part of a lifestyle intervention or rehabilitation program (e.g. [8,9,10,11]). Hence, exercise training has the capacity to improve both performance/exercise tolerance and reduce risk factors for both metabolic and cardiovascular disease. Therefore, given the implications of training for improving exercise performance, and in the prevention/rehabilitation of chronic disease, establishing optimal training strategies – not only to maximize training adaptations and associated health-related benefits, but also to improve participation and adherence in the general population – is of critical importance.
Key in this regard is the intensity of the exercise. It has been suggested that improvements in physiological functioning resulting
from exercise training exist on a continuum [12,13,14], such that continuous higher-intensity exercise leads to greater benefits than that of a moderate-intensity [6,15,16,17]. However, accumulation of high volumes of continuous, progressively higher intensity exercise is limited by the mechanisms that result in rapid exercise intolerance – i.e. tolerable duration is intensity dependent [18,19]. This has led to significant interest in High-Intensity Interval Training (HIIT). Repeated short-duration (i.e. ,30 s) all-out Wingate-style HIIT; i.e. Sprint Interval Training (SIT) is popular, and has been demonstrated to effectively improve endurance capacity and time-trial performance [20,21,22,23], muscle oxida-tive enzyme activity [20,21,22,23] and aerobic capacity (VVO_ 2max) ([21,24]), as well as specific health-related parameters such as insulin sensitivity [24,25], blood pressure [24] and vascular function [26] in a time-efficient manner (compared with current moderate-intensity physical activity guidelines; i.e. 150 min/week; [27]).
,4 min) and performing this as either an all-out sprint (matched for total work with a SIT session; [28]), or at a constant WR, in both health and disease (e.g. [10,11,12,29,30]). However, when high-intensity constant-load exercise bouts are extended beyond
,2 min, exercise tolerance is shaped by the hyperbolic Power-tolerable duration (P-tLIM) relationship (analogous to the Speed-tolerable duration (S-tLIM) relationship in treadmill exercise) [18,31]. The P-tLIMrelationship is therefore of critical significance when trying to identify the correct WR for an HIIT protocol in which the exercise bouts are prolonged.
In the P-tLIMmodel, once a critical threshold (i.e. the critical power (CP) or critical speed (CS)) is exceeded – with this the asymptote of the P-tLIMrelationship which represents the upper limit for which a steady-state in VVO_ 2, arterial blood acid-base status and intramuscular phosphocreatine and inorganic phos-phate can be attained [18,32] – tolerable duration is predictably determined by the rate at which a fixed quantity of work above the CP asymptote is performed. This fixed quantity of supra-CP work is termed W9(cycle ergometry) or D9(treadmill exercise), with this hypothesized to reflect either a fixed energy store associated with O2deficit-related mechanisms (i.e. muscle phosphocreatine, stored O2, glycolysis/glycogenolysis) or the accumulation of related fatigue metabolites (e.g. intramuscular inorganic phosphate and H+, interstitial K+) to a fixed critical limit [18,32,33]. As the asymptote (CP) of the hyperbolic P-tLIM relationship does not change with prior exercise [34,35], subsequent high-intensity (supra-CP) exercise tolerance is therefore determined by the balance between the extent of W9depletion in the preceding bout and subsequent W9 repletion during the intervening recovery period [34,35,36].
Despite this, there has been little consideration of the P-tLIM relationship when determining the ‘intensity’ (or more correctly, the work rate) for HIIT that is comprised of exercise bouts longer than ,2 min, with studies typically defining the work rate used based on % HRmax(,95% HRmax; [10,11,12,30]) or %VVO_ 2max (,90%VVO_ 2max; [29,37,38]). However, as CP does not occur at a fixed % of HRmaxorVVO_ 2max[19] and W9does not represent the same volume of supra-CP exercise in all individuals (e.g. [39]) these approaches are sub-optimal. The consequence is that the metabolic stress and thus the exercise intensity experienced during the HIIT program will be variable between participants unless the P-tLIMis accounted for. However, given the proposed relationship between intensity and both health- and performance-related fitness benefits [12,13,14], and the potential for the duration of the high-intensity exercise bout to have an impact on the training adaptations [28], the P-tLIM relationship should be taken into account when normalizing the intensity of HIIT to appropriately investigate these assertions.
HIIT protocols comprising 464 min bouts are commonly used in both health and disease as a viable, more effective training protocol than traditional moderate-intensity interventions (e.g. [10,11,12,29,30]). Hence, the purpose of this investigation was to determine the appropriate constant-WR for a 464 min HIIT that would allow for the completion of the desired 464 min bouts, normalizing the intensity of HIIT between individuals, and then consider how the P-tLIMrelationship can be applied to maximize the volume of high-intensity work that can be completed in 464 min bouts in a HIIT program, thus making longer duration HIIT analogous to SIT (i.e. all-out effort in each bout) and providing a method to consider the relative importance of the work rate profile during intensity-matched training to the physiological adaptations. We hypothesized that for constant-WR HIIT the P-tLIMrelationship can be used to identify the WR
that normalizes the intensity of a 464 min HIIT protocol. In addition, we hypothesized that W9depletion and subsequent W9 repletion occurs at a fixed rate, allowing the P-tLIMrelationship to be used to maximize the volume of work that can be completed in a 464 min HIIT program.
Methods
Subjects
A total of 11 healthy, recreationally active males (mean 6 standard deviation (SD); age 2364 yr; height 17865 cm; mass 7265 kg) who met the inclusion criteria (i.e. recreationally active males, aged 18–35 yr who were free from illness or any medical condition) volunteered, and provided written informed consent to participate in the study (as approved by the Faculty of Biomedical and Life Sciences Ethical Committee for non-clinical research, University of Glasgow, in accordance with the Declaration of Helsinki). All subjects were well accustomed to high-intensity exercise. Although none of the subjects were participating in competitive training at the time of the study 2 subjects had a running background, with the others involved in recreational running training. Following familiarisation with all equipment, protocols and procedures, subjects visited the laboratory on at least 6 separate occasions, each at a similar time of day, with at least 24 hr between each test. Each individual participated in no more than 3 experimental sessions in any given week. For each test, subjects were instructed to arrive rested (no strenuous exercise in the previous 24 hr), and having abstained from alcohol (24 hr), food (2 hr minimum) and caffeine ingestion (4 hr) prior to each test. Throughout the study participants were asked to consume their normal diet, and prior to all testing, arrive at least 2 hr postprandial having consumed a normal, healthy meal.
Equipment and measurements
All exercise tests were conducted on a motor driven program-mable treadmill (PPS Med, Woodway, Weil am Rhein, Germany) set at a gradient of 1% to take into account the lack of air resistance with indoor treadmill running, and thus match the energetic cost of the treadmill exercise with that of outdoor running [40]. During all tests subjects breathed through a mouthpiece connected to a large 2-way non-rebreathing valve (2700 series, Hans Rudolph, Shawnee, KS, USA), allowing collection of the respired gas (via a 1.5 m length of 3.5 cm diameter tubing) in a Douglas bag. This allowed measurement of the expired gas concentrations (Paramagnetic (O2) and Infrared (CO2) analyzers; Servopro 4100 gas analyzer, Servomex, Crow-borough, UK) and gas volume (Dry gas meter; Harvard Apparatus, Edenbridge, UK), thus allowing calculation of gas exchange variables (specifically VVO_ 2). Prior to each test the gas analyzers were calibrated in accordance with manufacturers guidelines using precision analyzed gases which spanned the physiological range of inspired and expired gas concentrations, with gas mixtures re-sampled post-test to confirm stability in relation to the initial gas calibration.
Exercise protocols
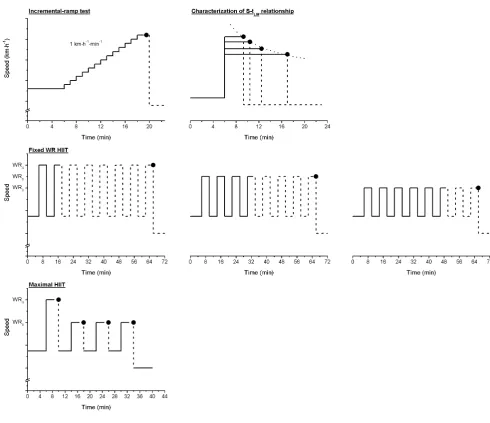
All exercise tests were preceded by a period of at least 6 min brisk walking at a speed of 5.5 km?h21(with the exception of the incremental-ramp test; see below for details), and concluded with a period of 6 min walking at a speed of 4.0 km?h21. For each test, subjects were instructed to run as long as possible (i.e. to the point of exercise intolerance), and at the point at which they could not longer maintain the set treadmill speed – despite strong verbal encouragement – they were instructed to support their weight on the handrails and straddle the treadmill. At this point (i.e. exercise intolerance) the speed of the treadmill was immediately reduced, and the 6 min cool-down at 4.0 km?h21 commenced. For a schematic of the exercise protocols please refer to Figure 1.
Incremental-ramp test. This test, to exercise intolerance, was performed to determine peakVVO_ 2(VVO_ 2peak), and establish an appropriate starting speed to characterize the S-tLIMrelationship (see below). In the incremental-ramp test, following a period of
6 min running at 8 km?h21, speed was increased at a rate of 1 km?h21?min21, until the point of exercise intolerance (Figure 1). Once the subject was considered to be close to the point of exercise intolerance, serial expired gas samples of a 60 s duration were collected in Douglas bags to ensureVVO_ 2peakwas captured. In the event that the limit of tolerance was obtained less than,20 s into the gas collection, the value obtained from the previous 60 s gas collection was assumed to beVVO_ 2peak.
[image:3.612.57.548.255.678.2]Characterization of the Speed-tolerable duration (S-tLIM) relationship. A randomized series of four separate constant-speed tests were conducted across a range of constant-speeds selected to induce intolerance within a duration of,3–20 min [18]. During these tests the treadmill speed was rapidly increased to that required (treadmill acceleration 0.72 km?h21?s21, 0.200 m?s21? s21) from the 5.5 km?h21 baseline, with subjects instructed to continue running at this speed until the point of exercise intolerance (Figure 1). From these tests the S-tLIM relationship
Figure 1. Schematic of the treadmill speed profiles performed during the Incremental-ramp test, the constant-speed tests for characterization of the Speed-tolerable duration (S-tLIM) relationship – dotted line (top left and right respectively), the fixed HIIT protocols in which 4 min bouts at WR4, WR6or WR8were alternated with 4 min recovery bouts until the limit of tolerance was attained (middle row), and the maximal HIIT protocol in which each bout was performed to the limit of tolerance, with a fixed 4 min recovery between each bout (bottom).
N
represents the limit of exercise tolerance in all protocols.was characterized, with CS (intercept) and D9 (slope), the parameters of this relationship, estimated using least-squares linear regression of the linear S-tLIM21relationship (i.e. S = (D9/ tLIM)+CS) [18]. Following estimation of the parameters of the S-tLIMrelationship within acceptable limits (defined as the standard error (SE) of the estimate being less than 2% for CS and 10% for D9; requiring additional tests at a different speed in 2 subjects), the speeds predicted to induce exercise intolerance at 4 min (WR4), 6 min (WR6) and 8 min (WR8) were derived by interpolation of the S-tLIMrelationship, and used as the work rates for the ‘‘ON’’ bouts for the interval training sessions.
_
V
VO2 in these tests was measured in the final minute of the 5.5 km?h21warm-up, thus establishing the baselineVVO_ 2.VVO_ 2peak was established by serial sampling of the expired gas (60 s collections) once the subject was considered to be close to the point of exercise intolerance (see Incremental-ramp test protocol above for further details). This VVO_ 2peakwas confirmed as VVO_ 2maxfor each subject by establishing no difference in theVVO_ 2peakattained with increases in constant-speed. Capillary blood samples were taken for lactate concentration ([L2]) analysis at rest, 30 s prior to the end of the 5.5 km?h21 warm-up and immediately following the attainment of the limit of tolerance.
Fixed WR HIIT. A sub-group of 8 subjects completed a series of 3 HIIT sessions, one at WR4, WR6 and WR8, in a random order. Following the completion of the 5.5 km?h21warm-up, the work rate alternated between 4 min of the appropriate ON work rate (i.e. WR4, WR6, or WR8) and 4 min brisk walking at 5.5 km?h21. This was repeated until the point of exercise intolerance, or until a maximum of 8 ON bouts were completed (Figure 1), allowing the total ON time, % of the target 16 min ON duration (i.e. 4 ON bouts of 4 min) to be calculated for each of the work rates performed.
Maximal HIIT. Given that effort is not maximal until the final bout in the fixed-WR HIIT protocol, a sub-group of 6 subjects completed a HIIT session in which the aim was to maximize effort in each of the 4 ON bouts, thus maximizing the amount of high-intensity work that can be completed with this format of training (i.e. analogous to SIT), with an anticipated duration of 4 min for each bout. The first ON bout was conducted at WR4 until the point of exercise intolerance was attained (at which point D9is theorized to be fully ‘depleted’; [18,31,35]). The remaining 3 ON bouts were conducted at WR8 and continued until the point of exercise intolerance, with this theorized to result in a tLIMof,4 min (based on evidence suggesting a D9recovery of,50% with an intervening recovery of 4 min [35]; Figure 1). In each ON bout tLIMwas recorded and used to calculate the extent of D9recovery in the preceding recovery period, and the amount of supra-CS work done for each bout.
During both HIIT protocols, ‘‘baseline’’VVO_ 2was measured in the final 60 s of the initial 5.5 km?h21warm-up, and in the final 60 s of each 4 min recovery between each ON bout.VVO_ 2peakwas also measured in the final 60 s of each ON bout, with serial sampling conducted when the subject was considered to be close to their tolerable limit (see above) to ensureVVO_ 2peakwas captured at the point of intolerance. Similarly, capillary blood samples were taken for [L2] analysis at rest, 30 s prior to the end of the 5.5 km?h21warm-up and 30 s prior to the onset of the next ON bout (‘‘baseline’’), immediately following the completion of each ON bout and immediately at the point of exercise intolerance. Subjects were informed during the HIIT protocols that if access to water was required this could be provided during the fixed 4 min recovery periods.
Analysis
Normal data distribution was confirmed using Kolmogorov-Smirnov test. A one-way ANOVA for repeated measures, with post hoc analysis (bonferroni) where appropriate, was used to compareVVO_ 2peakand peak [L2] values obtained in all protocols and baselineVVO_ 2and [L2] values obtained during the maximal HIIT protocol. Similarly this test was used to compare the ON duration sustained during HIIT at WR4, WR6and WR8, and the amount of supra-CS work performed during each interval during the maximal HIIT protocol. In addition, where appropriate, Cohen’s d was used of provide a measure of the Effect size. Thea
was set at 0.050. Values are expressed as mean 6 SD unless otherwise stated.
Results
Incremental-ramp test
_
V
VO2peak(4.1260.42 l?min21; 57.664.3 ml?kg21?min21; Range 50.9–65.0 ml?kg21?min21) was attained at an average speed of 18.961.8 km?h21 during the incremental-ramp test. Peak [L2] was 8.961.4 mM, and peak HR was 19268 beats?min21.
Characterization of the S-tLIMrelationship
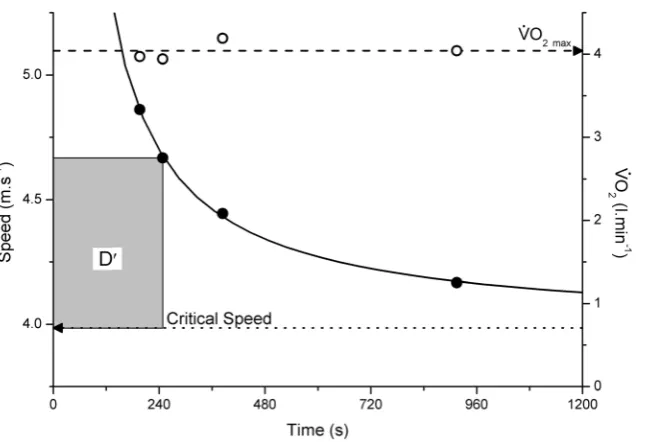
The individual values for VVO2peak_ were not influenced by treadmill speed (P.0.050), hence the mean of these values was taken as VVO_ 2max (4.1360.39 l?min21). Similarly, there was no difference in peak [L2] (P.0.050; mean 8.561.3 mM) or peak HR (P.0.050; mean 18868 beats?min21) with work rate at the point of exercise intolerance. Tolerable duration was well described by a hyperbolic function of the external treadmill speed, with the SE of the CS and D9 estimates of this relationship ,0.06 m?s21 (,2%; Range 0.3–1.8%) and ,18 m (,10%; Range 1.6–7.9%), respectively, in all instances (Figure 2). CS and D9 averaged 3.85360.429 m?s21 (equivalent to 13.961.5 km?h21) and 269.1673.2 m, respectively. WR4, WR6 and WR8 interpolated from this S-tLIM relationship were 4.97460.527 m?s21 (17.961.9 km?h21), 4.60060.475 m?s21 (16.661.7 km?h21) and 4.41360.455 m?s21(15.961.6 km?h21), respectively.
Fixed WR HIIT
In the sub-group of 8 subjects who completed the 3 fixed work rate HIIT sessions at WR4, WR6and WR8the tolerable duration of the HIIT sessions were 399681 s (95% CI; 331–467 s), 8926181 s (95% CI; 741–1044 s), and 15176346 s (95% CI; 1228–1807 s), respectively with total ON durations all significantly different from each other (P,0.050) (Figure 3A). This was equivalent to 41.668.4% (95% CI; 34.5–48.6%), 93618.9% (95% CI; 77.2–108.8%) and 158.1636.1% (95% CI; 127.9– 188.2%) of the target 960 s (i.e. 464 min) ON duration. There was, however, no difference in theVVO_ 2 attained at the limit of tolerance of WR4, WR6 or WR8 protocols, with this VVO_ 2 not different fromVVO_ 2maxin this cohort of 8 subject (P.0.050), thus confirmingVVO_ 2maxwas attained in all protocols. However, there was a tendency for theVVO2_ attained during WR8to be lower than
_
V
characterize the S-tLIM relationship at the point of exercise intolerance in WR6and WR8(P.0.050); however, peak [L
2
] was significantly higher in WR4 at the point of exercise intolerance than that attained in all other protocols (P,0.050; Table 1). Thus WR6provides the appropriate work rate to normalize the intensity of HIIT to the very-heavy intensity domain, with this speed equivalent to 8863% (Range 83–93%) of the speed attained at
_
V
VO2maxin the incremental-ramp test.
Maximal HIIT
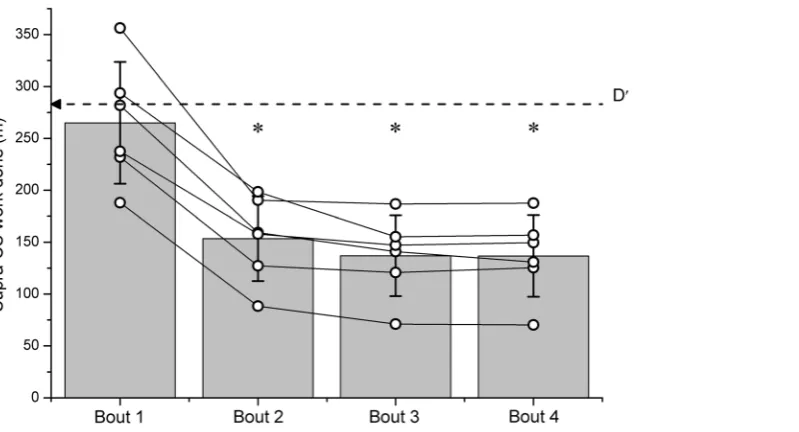
[image:5.612.63.388.57.278.2]In the sub-group of 6 subjects who completed this protocol, there was no significant difference in tolerable duration for each of the 4 ON bouts (ON Bout 1: 229627 s; Bout 2: 262637 s; Bout 3: 235649 s; Bout 4: 235653 s; P.0.050); withVVO_ 2maxattained in each of the 4 ON bouts (Table 2; Figure 4). Although there was a statistical difference in theVVO_ 2attained at the point of exercise intolerance between ON bouts 2 and 3 (P = 0.047), neither of these was different fromVVO_ 2maxdetermined during the constant-speed tests (P.0.050), and there was less than a 0.20 l?min21difference Figure 2. The relationship between speed and tolerable duration for 4 constant-speed tests (continued to exercise intolerance) in a representative subject (
N
).A hyperbolic relationship has been fitted to these data (solid line) allowing estimation of critical speed and D9. Also plotted is theVVO_ 2for each of these constant-speed tests (#), demonstratingVVO_ 2maxwas attained in each test.doi:10.1371/journal.pone.0076420.g002
[image:5.612.62.554.469.662.2]between all measurements of VVO_ 2 at the point of exercise intolerance in all subjects andVVO_ 2max. Hence,VVO_ 2remained well within the expected test-retest variability of 10% [41]. Similarly, there was no difference in HR at the point of exercise intolerance between each of the ON bouts, or that attained during the constant-speed tests (P.0.050; Table 2). In addition, although there was a significant difference in peak [L2] between ON bouts 1 and 2 (P,0.050), there was no difference in peak [L2] between all other bouts, and that attained in the constant-speed tests (P.0.050; Table 2).
_
V
VO2prior to each ON bout was elevated compared to the pre-exercise baseline value (P,0.050), however this was not signifi-cantly different between recovery (REC) bouts (P.0.050; Table 3, Figure 4). Similarly HR was elevated compared to the pre-exercise baseline value (P.0.050); however, there was no significant difference between the HR attained during the recovery bouts (Table 3). In addition, [L2] was significantly elevated prior to the pre-exercise baseline value in all recovery bouts (P.0.050); however, there was no significant difference in [L2] attained between each intervening recovery bout (P.0.050; Table 3).
These results are consistent with the finding that there was no difference in supra-CS work in Bout 1 compared with D9 (264.9658.7 m vs. 283.7679.5 m; P.0.050), but that there was significantly less work accomplished in ON bouts 2, 3 and 4 (P,0.050), with the amount of supra-CS work not different between these bouts (Bout 2: 153.5640. 9 m; Bout 3: 136.9638.9 m; Bout 4: 136.7639.3 m; Figure 5; P.0.050) suggesting a constantrateof D9‘recovery’ – thus fixedquantityof D9 recovered in 4 min – between bouts. D9 recovery averaged 54.767.8%, 48.9610.2% and 48.9611.2% for bouts 2, 3 and 4 respectively, with this recovery not significantly different between bouts (P,0.050).
Discussion
This is the first study to apply the S-tLIMrelationship to identify the appropriate work rate for HIIT to normalize the relative intensity between subjects to the very-heavy intensity domain, identifying that WR6 for a 464 min HIIT session provides the appropriate balance between D9depletion during the ON bouts, and repletion in the intervening 4 min recovery period that allowed for the completion of the required,4 (3.760.7; i.e. 93%) ON bouts. Hence, this protocol allows for the appropriate consideration of the role of exercise intensity in determining training adaptations, normalizing this between individuals.
Fur-thermore, this study establishes a protocol that, with knowledge of the extent of D9recovery between bouts, maximizes the amount of high-intensity work that can be completed in a 464 min HIIT protocol, precisely normalizing the intensity of both the overall session, and each ON bout (i.e. each ON bout resulted in the attainment ofVVO_ 2max). Hence, this protocol provides a means of differentiating the relative importance of the work rate profile (c.f. SIT) and exercise intensity to promote physiological adaptations.
Exercise intensity
While a specific work rate can be of a high absolute intensity (e.g. 100% VVO_ 2max) when performed as a continuous bout, this same specific work rate can be undertaken during HIIT in a manner which means the overall intensity of the training session can be either moderate, (metabolic rate,Lactate threshold (LT), no sustained metabolic acidosis), heavy (metabolic rate.LT,CS/ CP, sustained metabolic acidosis which eventually attains a steady-state) or very-heavy/severe (progressive increase inVVO_ 2, resulting in the attainment of VVO_ 2max if continued to tLIM, progressive metabolic acidosis which continues throughout the exercise until tLIM) [19,42]. While the specific work rate performed in relation to the overall intensity of training is not a consideration in short-duration SIT, as the ,30 s sprints are an all-out effort (e.g. [20,21,22,23,24]) with this long enough to result in the attainment (or very near attainment) of HRmaxandVVO_ 2maxin each sprint (i.e. very-heavy/severe intensity), the specific work rate used during HIIT is an essential consideration with respect to exercise intensity (and normalizing this between participants) when the duration of the ON exercise bout is extended.
Exercise bouts of 4 min are frequently used in HIIT both for health and performance benefits (e.g. [9,10,12,29,30]) in the format of a 464 min training session, with an intervening recovery of 3–4 min. Typically work rate is determined from % HRmaxor %VVO_ 2max; however, this fails to account for the variability of the derived work rate with respect to the parameters of the high-intensity relationship (i.e. CS and D9) between individuals (e.g. [19,39]). This is highlighted by the result in this study that WR6 exists at 87% of the speed attained atVVO_ 2maxin the incremental-ramp test, but with a range of 83–93%. In addition, any specific prescribed % VVO_ 2 or % HR during HIIT is only attained fleetingly as a steady-state is never achieved, with these variables continuing to increase towards their respective maxima through-out each bthrough-out [19]. However, by accounting for the S-tLIM relationship during treadmill running to normalize exercise intensity we were able to demonstrate that WR6 (i.e. the work rate derived from the S-tLIMrelationship that leads to the limit of tolerance in 6 min) was optimal, providing the required balance between D9‘‘depletion’’ during ON bouts and ‘‘repletion’’ during the intervening recovery that allowed for the completion of the required ,4 ON bouts. As this resulted in the attainment of
_
V
VO2max and peak lactate in the final bout this, by definition [19,42], puts the overall intensity of training for all subjects within the very-heavy intensity domain.
Maximal HIIT
While WR6 defines a work rate for HIIT that normalizes intensity to the very-heavy intensity domain for 464 min HIIT, with this resulting in a highVVO_ 2 and HR (with these variables continuing to increase towards their respective maxima through-out each bthrough-out until the limit of tolerance is attained), maximal effort is not required until the final bout (c.f SIT; [43]). Therefore, while WR6normalizes exercise intensity it does not maximize the
Table 1.VVO_ 2max, HR and [L2] attained at the limit of
tolerance during Control, and fixed WR HIIT protocols performed at WR4, WR6and WR8.
Control WR4 WR6 WR8
_
V
VO2max(l?min
21
) 3.9560.26 3.9460.23 3.9260.21 3.8160.25
HR (beats?min21
) 188643 19063 18966 18864
[L2
] (mM) 8.461.1 9.761.1* 8.561.5 8.061.0
Values are means6SD.VVO_ 2max(maximal rate of pulmonary oxygen uptake); HR (heart rate) and [L2
] (Lactate concentration) measured at the limit of tolerance during the constant-speed tests used to characterize the Speed-tolerable duration (S-tLIM) relationship (Control) and during HIIT performed at WR4, WR6and WR8(work rates predicted to induce exhaustion at 4, 6 and 8 min respectively).
*Significantly higher [L2
amount of supra-CS work that can be completed during 464 min HIIT. For high-intensity, supra-CS exercise of ,2–30 min tolerable duration is dependent on the rate of D9depletion, with this rate of depletion increasing proportionally with work rate. Therefore, interpolating WR4 from the S-tLIM relationship maximizes supra-CS work on Bout 1 of 464 min HIIT (Bout 1 tLIM: 229627 s; Range 117–248 s), with this leading to the attainment of HRmaxandVVO_ 2max. As CS is unchanged following fatiguing exercise, subsequent exercise tolerance is dependent exclusively on the extent of D9recovery, with this demonstrated to be,50% in 4 min recovery [35]. Hence, in Bout 2 WR8should be sustainable for,4 min, thus providing the necessary work rate to maximize supra-CS work in 4 min. In this study as D9recovery averaged,50%, and confirms the assumption that the extent of D9recovery does not differ between repeated bouts [44], WR8is then the appropriate work rate for bouts 2, 3 and 4 to maximize the amount of supra-CS work that can be accumulated in 4 min
(tLIM: Bout 2: 262637 s; Bout 3: 235649 s; Bout 4: 235653 s), and provides a protocol to maximize the amount of supra-CS work that can be accumulated in 464 min HIIT, resulting in the attainment of HRmaxandVVO_ 2maxin each bout. This makes this 464 min HIIT analogous to SIT, allowing the relative contribu-tion of the work rate profile, when matched for exercise intensity, to be investigated. These data also confirm the assumption that during this 464 min HIIT protocol performance is determined by the S-tLIM relationship, with the profile of D9 depletion and recovery alone ‘‘shaping’’ supra-CS exercise tolerance [44].
Consideration of the work rate profile of HIIT and practical applications
[image:7.612.63.299.88.169.2]By correctly defining and normalizing the intensity of HIIT between participants to maximize the amount of supra-CS work that can be accumulated in a 464 min HIIT protocol, thus ensuring the same metabolic stress throughout training, this allows appropriate comparison of different interval training strategies (e.g. short vs. long duration ON bouts). Hence, the relative
Figure 4. TheVVO_ 2response during the maximal HIIT protocol.Although there was some (insignificant) variability in ON duration at WR4 (bout 1) and WR8(bouts 2, 3 and 4) (horizontal error bars), note the constancy of theVVO_ 2attained, with this indistinguishable fromVVO_ 2max. Similarly, althoughVVO_ 2did not recover to baseline (BASE) following 4 min recovery (REC; P,0.050,w), there was no difference in theVVO_ 2attained in REC following WR4(bout 1) or WR8(bouts 2 and 3).
[image:7.612.318.554.102.171.2]doi:10.1371/journal.pone.0076420.g004
Table 2.VVO_ 2max, HR and [L2] attained at the limit of
tolerance during the control and maximal HIIT protocols.
Control ON Bout 1
ON Bout 2
ON Bout 3
ON Bout 4
_
V
VO2max(l?min
21
) 4.2260.51 4.2860.47 4.2960.53 4.1860.48 4.2060.53
HR (beats?min21
) 19063 18866 18569 18965 18866
peak [L2
] (mM) 8.261.1 7.261.5* 9.761.6 9.361.2 9.161.4
Values are means6SD.VVO_ 2max(maximal rate of pulmonary oxygen uptake); HR (heart rate) and [L2
] (Lactate concentration) measured at the limit of tolerance during the constant-speed tests used to characterize the Speed-tolerable duration (S-tLIM) relationship (Control) and ON bouts 1, 2, 3 and 4 of the maximal HIIT protocol.
*Significantly lower [L2
] than that achieved in Bout 2. doi:10.1371/journal.pone.0076420.t002
Table 3.VVO_ 2max, HR and [L2] attained at the pre-exercise
baseline, and in the 4 min recovery bouts during the maximal HIIT protocol.
Baseline REC 1 REC 2 REC 3
_
V
VO2max(l?min
21
) 1.3760.13 1.6460.18* 1.6760.24* 1.6160.20*
HR (beats?min21
) 10866 13267* 13367* 13768*
peak [L2
] (mM) 0.960.2 9.261.4* 8.861.3* 8.661.9*
Values are means6SD.VVO_ 2max, maximal rate of pulmonary oxygen uptake; HR, heart rate; [L2
], Lactate concentration and; REC, recovery bout. *Significantly higher than the pre-exercise baseline.
[image:7.612.60.385.445.675.2]contributions of both exercise intensity and the intermittent/ interval work rate profile to any training induced physiological adaptations can be appropriately deconvoluted, with this having important implications when investigating the mechanistic basis for training adaptations.
While exercise intensity is an essential consideration with regards to training adaptations [16,30,45,46,47] there is evidence emerging that the actual work rate profile is also important [12,28]. Even when appropriately matching for exercise intensity and total work the physiological changes during HIIT (in terms of, for example, the dynamics and proportional contribution of the different energy systems to the energy demand, and blood flow dynamics) will be significantly different with short, compared with long ON bouts. That is, when the overall intensity of the exercise session is controlled, but the duration of the ON bout is extended, there is a proportionally greater aerobic contribution to the overall energy requirement when matched for energy expenditure. Hence with longer ON bouts (i.e.,4 min), given the response dynamics of VVO_ 2, HR and cardiac output, there will be a greater time accumulated at a relatively high proportion of these respective maxima, compared with short (i.e. 30 s) ON bouts. Although this requires further systematic investigation, this is likely to have significant consequences with regards to the specific physiological adaptations seen (e.g. [28]) following a training program.
For example, it has been suggested that there may be an intensity threshold over which exercise has to be performed to promote cardiovascular benefits [13,14], although this suggestion is not universal (e.g. [17]). Hence, it is likely that generating a high relative HR and cardiac output (with respect to their maxima) is important for inducing intrinsic cardiac benefits and promoting improvements in vascular function [9,13,45]. Thus, as there is a greater accumulation of time under these ‘‘conditions’’ i.e. high HR and cardiac output in long vs. short bouts for the same overall training session intensity and total training session time commit-ment (i.e.,30 min per session), the relevance of the work rate profile is likely an essential consideration with regards to
developing optimal training strategies to maximize training adaptations.
In addition, the physiological differences between different HIIT protocols, even when matched for exercise intensity may be of particular importance when considering adaptations relating to metabolic and cardiovascular risk factors such as insulin sensitivity and aerobic capacity. For example, increased mitochondrial energy flux is associated with greater improvements in insulin sensitivity [48]. In addition, while PCG-1a(a critical regulator of mitochondrial biogenesis; [49]) has been demonstrated to be activated following both short [50,51] and long [11] HIIT, given the bioenergetic differences between the different interval training strategies it is unclear which work rate profile will have the greatest impact on, for example, mitochondrial capacity, insulin sensitivity and aerobic capacity when exercise intensity is controlled. Therefore, while the work rate profile likely contributes to training adaptations, thespecificwork rate profile which maximizesspecific adaptations to subsequently improve physiological function (and the interaction of this with the exercise intensity) has yet to be resolved. However, the results from this study enable the correct work rates to be identified, thus allowing intensity to be removed as a confounding variable in order to investigate the relative importance of the work rate profile in training strategies.
While it has been postulated that there is a dose-response relationship between exercise intensity (quantified in terms of
_
V
[image:8.612.65.465.59.275.2]VO2max) and training adaptations [14], the full nature of this dose-response has yet to be established. Therefore, whether it is necessary to provide an all-out effort to maximize any physiolog-ical adaptations from training has yet to be resolved. Hence, it is possible that, similar to the proposal that there is a minimum intensity for some specific training induced adaptations [13,14], there may also be an upper limit/optimal exercise intensity above which the magnitude of any training induced adaptations is diminished. However, calculating appropriate work rates based on the S-tLIMrelationship and the extent of D9recovery, provides a method of normalizing, and then titrating the overall training intensity for longer duration ON bouts to identify the existence of Figure 5. The quantity (with units of meters, m) of supra-CS work (i.e. D9) performed during the maximal HIIT protocol.Bars represent the group mean (6SD), with#representing the individual data. In bout 1, the amount of supra-CS work performed is indistinguishable from D9 determined from the Speed-tolerable duration relationship. However, in bouts 2, 3 and 4 significantly less supra-CS work is performed (,50%) with this significantly less than D9(P,0.050,w).
any intensity (comparing this with appropriate proposed ‘‘practi-cal’’ short duration HIIT strategies; e.g. [52,53]), and thus effort related threshold with regards to training adaptations. This however, requires systematic investigation.
Of course underpinning all considerations with regards to training strategies and physiological adaptations must be the potential to translate effective lab-based training strategies in to the home environment. There is evidence that interval training in general may be a more enjoyable training strategy than continuous moderate-intensity interventions [37], with this possibly related to the challenge of undertaking the more challenging aspect of the exercise intervals, rather than the monotony of continuous moderate-intensity exercise. Hence, research into optimizing HIIT has the potential to have a significant impact with regards to establishing a range of effective training strategies as alternatives to traditional continuous moderate-intensity exercise for the improvement of exercise tolerance/performance and risk factors for chronic illness, allowing individuals to adhere to training strategies which fit with their individual training preferences and lifestyle [54].
Limitations
While this study has identified that WR6 normalizes the intensity of HIIT to the very heavy-intensity domain, it must be acknowledged that the subjects in this study were from a relatively homogenous group; therefore, whether these findings can be extended to other populations remains unclear. In addition, although these results highlight the importance of the S-tLIM relationship to normalize the intensity of both continuous and HIIT one of the primary limitations when considering the translational application of these findings is the number of tests
required to characterize this relationship and identify the correct work rates. Therefore, developing a strategy that allows quick and accurate identification of the appropriate work rates from the S-tLIMrelationship for use in HIIT remains an important goal.
Conclusion
In conclusion, WR6 derived from the S-tLIM relationship provides the appropriate work rate to normalize the intensity of 464 min HIIT to the very heavy-intensity domain. In addition, as there is no difference in the extent of D9recovery between fatigue bouts, this study establishes an approach in which supra-CS work can be maximized and exercise intensity can be normalized precisely for each subject during 464 min HIIT. This strategy therefore allows the relative contributions of exercise intensity and the work rate profile to any training induced adaptations to be appropriately quantified. This has important implications for establishing HIIT strategies to maximize improvements in physiological functioning.
Acknowledgments
The authors would like to express thanks to all subjects who volunteered to participate, and to Kerry Griffiths Jamie Hitchmough, David Knox, Andrew Leishman, Nandini Shah, Kerry Steel and Sun Weizhe for their assistance during data collection.
Author Contributions
Conceived and designed the experiments: CF JW OJK. Performed the experiments: CF JW OJK. Analyzed the data: CF JW KMB OJK. Wrote the paper: CF JW KMB OJK.
References
1. Bassuk SS, Manson JE (2005) Epidemiological evidence for the role of physical activity in reducing risk of type 2 diabetes and cardiovascular disease. Journal of applied physiology 99: 1193–1204.
2. Morris JN, Heady JA, Raffle PA, Roberts CG, Parks JW (1953) Coronary heart-disease and physical activity of work. Lancet 265: 1111–1120; concl. 3. Paffenbarger RS Jr., Laughlin ME, Gima AS, Black RA (1970) Work activity of
longshoremen as related to death from coronary heart disease and stroke. The New England journal of medicine 282: 1109–1114.
4. Blair SN, Kampert JB, Kohl HW 3rd, Barlow CE, Macera CA, et al. (1996) Influences of cardiorespiratory fitness and other precursors on cardiovascular disease and all-cause mortality in men and women. JAMA : the journal of the American Medical Association 276: 205–210.
5. Myers J, Prakash M, Froelicher V, Do D, Partington S, et al. (2002) Exercise capacity and mortality among men referred for exercise testing. The New England journal of medicine 346: 793–801.
6. O’Donovan G, Owen A, Bird SR, Kearney EM, Nevill AM, et al. (2005) Changes in cardiorespiratory fitness and coronary heart disease risk factors following 24 wk of moderate- or high-intensity exercise of equal energy cost. Journal of applied physiology 98: 1619–1625.
7. Skinner JS, Jaskolski A, Jaskolska A, Krasnoff J, Gagnon J, et al. (2001) Age, sex, race, initial fitness, and response to training: the HERITAGE Family Study. Journal of applied physiology 90: 1770–1776.
8. Knowler WC, Barrett-Connor E, Fowler SE, Hamman RF, Lachin JM, et al. (2002) Reduction in the incidence of type 2 diabetes with lifestyle intervention or metformin. The New England journal of medicine 346: 393–403.
9. Moholdt T, Aamot IL, Granoien I, Gjerde L, Myklebust G, et al. (2011) Long-term follow-up after cardiac rehabilitation: a randomized study of usual care exercise training versus aerobic interval training after myocardial infarction. International journal of cardiology 152: 388–390.
10. Moholdt T, Aamot IL, Granoien I, Gjerde L, Myklebust G, et al. (2012) Aerobic interval training increases peak oxygen uptake more than usual care exercise training in myocardial infarction patients: a randomized controlled study. Clinical rehabilitation 26: 33–44.
11. Tjonna AE, Lee SJ, Rognmo O, Stolen TO, Bye A, et al. (2008) Aerobic interval training versus continuous moderate exercise as a treatment for the metabolic syndrome: a pilot study. Circulation 118: 346–354.
12. Helgerud J, Hoydal K, Wang E, Karlsen T, Berg P, et al. (2007) Aerobic high-intensity intervals improve VO2max more than moderate training. Medicine and science in sports and exercise 39: 665–671.
13. Kemi OJ, Wisloff U (2010) High-intensity aerobic exercise training improves the heart in health and disease. Journal of cardiopulmonary rehabilitation and prevention 30: 2–11.
14. Wisloff U, Ellingsen O, Kemi OJ (2009) High-intensity interval training to maximize cardiac benefits of exercise training? Exercise and sport sciences reviews 37: 139–146.
15. Coker RH, Hays NP, Williams RH, Brown AD, Freeling SA, et al. (2006) Exercise-induced changes in insulin action and glycogen metabolism in elderly adults. Medicine and science in sports and exercise 38: 433–438.
16. Gormley SE, Swain DP, High R, Spina RJ, Dowling EA, et al. (2008) Effect of intensity of aerobic training on VO2max. Medicine and science in sports and exercise 40: 1336–1343.
17. Swain DP, Franklin BA (2002) Is there a threshold intensity for aerobic training in cardiac patients? Medicine and science in sports and exercise 34: 1071–1075. 18. Poole DC, Ward SA, Gardner GW, Whipp BJ (1988) Metabolic and respiratory profile of the upper limit for prolonged exercise in man. Ergonomics 31: 1265– 1279.
19. Rossiter HB (2010) Exercise: Kinetic Considerations for Gas Exchange. Comprehensive Physiology: John Wiley & Sons, Inc.
20. Burgomaster KA, Heigenhauser GJ, Gibala MJ (2006) Effect of short-term sprint interval training on human skeletal muscle carbohydrate metabolism during exercise and time-trial performance. Journal of applied physiology 100: 2041– 2047.
21. Burgomaster KA, Howarth KR, Phillips SM, Rakobowchuk M, Macdonald MJ, et al. (2008) Similar metabolic adaptations during exercise after low volume sprint interval and traditional endurance training in humans. The Journal of physiology 586: 151–160.
22. Burgomaster KA, Hughes SC, Heigenhauser GJ, Bradwell SN, Gibala MJ (2005) Six sessions of sprint interval training increases muscle oxidative potential and cycle endurance capacity in humans. Journal of applied physiology 98: 1985–1990.
23. Gibala MJ, Little JP, van Essen M, Wilkin GP, Burgomaster KA, et al. (2006) Short-term sprint interval versus traditional endurance training: similar initial adaptations in human skeletal muscle and exercise performance. The Journal of physiology 575: 901–911.
24. Whyte LJ, Gill JM, Cathcart AJ (2010) Effect of 2 weeks of sprint interval training on health-related outcomes in sedentary overweight/obese men. Metabolism: clinical and experimental 59: 1421–1428.
but does not affect the thermogenic response to beta-adrenergic stimulation. The Journal of physiology 588: 2961–2972.
26. Rakobowchuk M, Tanguay S, Burgomaster KA, Howarth KR, Gibala MJ, et al. (2008) Sprint interval and traditional endurance training induce similar improvements in peripheral arterial stiffness and flow-mediated dilation in healthy humans. American journal of physiology Regulatory, integrative and comparative physiology 295: R236–242.
27. Haskell WL, Lee IM, Pate RR, Powell KE, Blair SN, et al. (2007) Physical activity and public health: updated recommendation for adults from the American College of Sports Medicine and the American Heart Association. Circulation 116: 1081–1093.
28. Whyte LJ, Ferguson C, Wilson J, Scott RA, Gill JM (2013) Effects of single bout of very high-intensity exercise on metabolic health biomarkers in overweight/ obese sedentary men. Metabolism: clinical and experimental 62: 212–219. 29. Rognmo O, Hetland E, Helgerud J, Hoff J, Slordahl SA (2004) High intensity
aerobic interval exercise is superior to moderate intensity exercise for increasing aerobic capacity in patients with coronary artery disease. European journal of cardiovascular prevention and rehabilitation : official journal of the European Society of Cardiology, Working Groups on Epidemiology & Prevention and Cardiac Rehabilitation and Exercise Physiology 11: 216–222.
30. Wisloff U, Stoylen A, Loennechen JP, Bruvold M, Rognmo O, et al. (2007) Superior cardiovascular effect of aerobic interval training versus moderate continuous training in heart failure patients: a randomized study. Circulation 115: 3086–3094.
31. Moritani T, Nagata A, deVries HA, Muro M (1981) Critical power as a measure of physical work capacity and anaerobic threshold. Ergonomics 24: 339–350. 32. Jones AM, Wilkerson DP, DiMenna F, Fulford J, Poole DC (2008) Muscle
metabolic responses to exercise above and below the ‘‘critical power’’ assessed using 31P-MRS. American journal of physiology Regulatory, integrative and comparative physiology 294: R585–593.
33. Coats EM, Rossiter HB, Day JR, Miura A, Fukuba Y, et al. (2003) Intensity-dependent tolerance to exercise after attaining V(O2) max in humans. Journal of applied physiology 95: 483–490.
34. Ferguson C, Whipp BJ, Cathcart AJ, Rossiter HB, Turner AP, et al. (2007) Effects of prior very-heavy intensity exercise on indices of aerobic function and high-intensity exercise tolerance. Journal of applied physiology 103: 812–822. 35. Ferguson C, Rossiter HB, Whipp BJ, Cathcart AJ, Murgatroyd SR, et al. (2010)
Effect of recovery duration from prior exhaustive exercise on the parameters of the power-duration relationship. Journal of applied physiology 108: 866–874. 36. Chidnok W, Dimenna FJ, Bailey SJ, Vanhatalo A, Morton RH, et al. (2012)
Exercise tolerance in intermittent cycling: application of the critical power concept. Medicine and science in sports and exercise 44: 966–976.
37. Bartlett JD, Close GL, MacLaren DP, Gregson W, Drust B, et al. (2011) High-intensity interval running is perceived to be more enjoyable than moderate-intensity continuous exercise: implications for exercise adherence. Journal of sports sciences 29: 547–553.
38. Bartlett JD, Hwa Joo C, Jeong TS, Louhelainen J, Cochran AJ, et al. (2012) Matched work high-intensity interval and continuous running induce similar increases in PGC-1alpha mRNA, AMPK, p38, and p53 phosphorylation in human skeletal muscle. Journal of applied physiology 112: 1135–1143.
39. Murgatroyd SR, Ferguson C, Ward SA, Whipp BJ, Rossiter HB (2011) Pulmonary O2 uptake kinetics as a determinant of high-intensity exercise tolerance in humans. Journal of applied physiology 110: 1598–1606. 40. Jones AM, Doust JH (1996) A 1% treadmill grade most accurately reflects the
energetic cost of outdoor running. Journal of sports sciences 14: 321–327. 41. Day JR, Rossiter HB, Coats EM, Skasick A, Whipp BJ (2003) The maximally
attainable VO2 during exercise in humans: the peak vs. maximum issue. Journal of applied physiology 95: 1901–1907.
42. Turner AP, Cathcart AJ, Parker ME, Butterworth C, Wilson J, et al. (2006) Oxygen uptake and muscle desaturation kinetics during intermittent cycling. Medicine and science in sports and exercise 38: 492–503.
43. Moholdt T, Bekken Vold M, Grimsmo J, Slordahl SA, Wisloff U (2012) Home-based aerobic interval training improves peak oxygen uptake equal to residential cardiac rehabilitation: a randomized, controlled trial. PloS one 7: e41199. 44. Skiba PF, Chidnok W, Vanhatalo A, Jones AM (2012) Modeling the expenditure
and reconstitution of work capacity above critical power. Medicine and science in sports and exercise 44: 1526–1532.
45. Kemi OJ, Haram PM, Loennechen JP, Osnes JB, Skomedal T, et al. (2005) Moderate vs. high exercise intensity: differential effects on aerobic fitness, cardiomyocyte contractility, and endothelial function. Cardiovascular research 67: 161–172.
46. Swain DP, Franklin BA (2006) Comparison of cardioprotective benefits of vigorous versus moderate intensity aerobic exercise. The American journal of cardiology 97: 141–147.
47. Wenger HA, Bell GJ (1986) The interactions of intensity, frequency and duration of exercise training in altering cardiorespiratory fitness. Sports medicine 3: 346–356.
48. Thyfault JP (2008) Setting the stage: possible mechanisms by which acute contraction restores insulin sensitivity in muscle. American journal of physiology Regulatory, integrative and comparative physiology 294: R1103–1110. 49. Wu Z, Puigserver P, Andersson U, Zhang C, Adelmant G, et al. (1999)
Mechanisms controlling mitochondrial biogenesis and respiration through the thermogenic coactivator PGC-1. Cell 98: 115–124.
50. Gibala MJ, McGee SL, Garnham AP, Howlett KF, Snow RJ, et al. (2009) Brief intense interval exercise activates AMPK and p38 MAPK signaling and increases the expression of PGC-1alpha in human skeletal muscle. Journal of applied physiology 106: 929–934.
51. Little JP, Safdar A, Bishop D, Tarnopolsky MA, Gibala MJ (2011) An acute bout of high-intensity interval training increases the nuclear abundance of PGC-1alpha and activates mitochondrial biogenesis in human skeletal muscle. American journal of physiology Regulatory, integrative and comparative physiology 300: R1303–1310.
52. Hood MS, Little JP, Tarnopolsky MA, Myslik F, Gibala MJ (2011) Low-volume interval training improves muscle oxidative capacity in sedentary adults. Medicine and science in sports and exercise 43: 1849–1856.
53. Little JP, Safdar A, Wilkin GP, Tarnopolsky MA, Gibala MJ (2010) A practical model of low-volume high-intensity interval training induces mitochondrial biogenesis in human skeletal muscle: potential mechanisms. The Journal of physiology 588: 1011–1022.
![Table 2. VO_2max, HR and [L2] attained at the limit oftolerance during the control and maximal HIIT protocols.](https://thumb-us.123doks.com/thumbv2/123dok_us/7976636.201187/7.612.60.385.445.675/table-attained-limit-oftolerance-control-maximal-hiit-protocols.webp)