Population and conservation
genetics of the shy albatross
complex
Cathryn L. Abbott
A th esis subm itted for th e degree of Doctor of
Philosophy of The A u stralian N ational U niversity
The research presented in this thesis is my own original work except where due
reference is given in the text. All chapters are the result of collaborative research
that I carried out with others, and in Chapters I and V John Trueman contributed to
phylogenetic analyses. However, I am the principal contributor to all aspects of the
work, none of which has been submitted for any previous degree.
CATHRYN L. ABBOTT
Dedication
Acknowledgements
The flame of conception seems to flare and go out, leaving man shaken, and at once happy and afraid... This is the greatest mystery of the human mind - the inductive leap. Everything falls into place,
irrelevancies relate, dissonance becomes harmony, and nonsense wears a crown of meaning. But the clarifying leap springs from the rich soil of confusion, and the leaper is not unfamiliar with pain.
— John Steinbeck, Sweet Thursday
I suspect suggesting this thesis is a clarifying leap is a leap in itself, though I assure
you it wasn’t entirely painless. Such a great number of people nursed me through the
production of this work that it’s overwhelming to think of how to thank them all. I
am immeasurably grateful to my supervisors Mike Double and Andrew Cockburn.
Mike was dedicated, passionately interested, and incredibly helpful throughout all
the stages of this research; not only did I benefit from this immensely but the quality
of the work was also tremendously improved by it. I recognise and appreciate the
level of commitment it took for Mike to be as accessible to me as he was. Andrew
provided excellent advice and support that came in too many forms to mention,
though the feedback he provided on manuscript drafts was particularly insightful. He
was a constant source of clarity when I was too close to a problem to see its solution
(or when I just wasn’t clever enough!), and is an inspiring person to work with.
Barry Baker and Rosemary Gales provided instrumental assistance in getting this
project off the ground and have given me enduring collaborative support since then.
Barry helped with gaining funding, contributed valuable input on the fisheries related
research, and always provided a worthy excuse for me to go somewhere new for
coffee. Rosemary shared her wealth of experience in working with shy albatrosses,
was very helpful with permits and access requirements, and has left me with fond
memories of crunchy camp rice that make me smile about those magical days on
It has been a pleasure and a privilege to work in as friendly and achieving a work
environment as Botany and Zoology. I worked alongside great people who shared
with me the joys and sorrows of doing scientific research: Rachel Alderman, Rose
Andrew, Amber Beavis, Nadeena Beck, Caroline Blackmore, Chris Boland, Susan
Burrows, Dave Chappie, Stu Dennis, Miranda Ebbers, Dan Ebert, Diana Fisher, Janet
Gardner, Kelli Gowland, Rob Heinsohn, Anke-Maria Hoefer, Naomi Langmore,
Sarah Legge, Matt Morgan, Steve Murphy, Penny Olsen, Dirk Platzen, Jess Stapley,
Ian Wallis, and Bob Wong. Many of you have become dear friends. I especially
thank Janet and Kelli for always being available for some decent girl talk.
Though the genetics lab is somewhat of a nemesis for many of my BoZo peers, I
confess to actually liking it in there. Thanks to: Chris Hayes, for liking it too (you do
so!) and sharing so many of your lab secrets with me; Ginny Sargent, for always
being accessible and finding a solution to any problem; Mike Double, for
recognizing that the results did not come easy and were worth getting excited about;
and to everyone who kept me company.
A wealth of wild and often wonderful ideas, or a friendly hand to hold while wading
down the muddled path of labwork and genetic analyses, were given to me by
Theresa Burg, Lyn Cook, Mike Crisp, Rod Peakall, Anna Robinson, and Dave
Rowell. In particular I thank John Trueman for his vital contribution to solving the
mystery of the ‘double sequence phenomenon’.
I relied heavily on many people both for help in the field and for obtaining samples
from several far reaches of the southern hemisphere. They were generous in sharing
their knowledge and experience with me, and patient with me while I got my feet wet
in the field (quite literally at times). They are: Jacinda Amey, Nigel Brothers, Ian
Flux, Anna Lashko, Gus McAllister, Pete McClelland, Peter Milbum, Janice Molloy,
floor space to crash on in Hobart. Support from the following organizations was also
instrumental for sample collection in this study: New Zealand Conservation Services
Levy Program, New Zealand Department of Conservation, Southern Ocean Seabird
Studies Association, Southland Kaitiaki roopu, Tasmanian Museum and Art Gallery,
Tasmania’s Nature Conservation Branch (DPIWE).
Financial support was provided by Environment Australia, Winifred Violet Scott
Estate, Gould League of NSW, Stuart Leslie (Birds Australia), and Australian
Geographic. Madeleine Haag and Gary Mayo were lifesavers with respect to
tackling the confusing worlds of administration and ordering lab supplies.
Thanks to Neil Smith and the Wild Wind for several unforgettable voyages to Albatross Island in Bass Strait. While some trips took 6 hours and another took 2
days, and anchor ropes sometimes snapped, Neil always got us there and back again.
I am also hugely appreciative o f ‘Big Maurie’ and the Tasmanian Police Marine and
Rescue Division (at Stanley) for safe, reliable, fun, and FAST trips. I loved Maurie’s
legendary pep talk before our roughest trip: “Remember, this boat is designed to
travel through the air as well as through the water; whatever you do, just don’t let
go!” I thank the crew of the Marine Countess for transporting us safely, and more importantly, smoothly, to and from the Auckland Islands in New Zealand’s
subantarctic. I never knew how good mutton chops for breakfast could taste!
I have family and friends near and far who deserve credit for buoying me when I
needed it most. Mom, Dad, Bryna, Josh, and Kath: you are precious to me. Life in
Canberra was made loads of fun by my local ‘fam’ in particular: Lee Halasz, Natane
Halasz, and Julie Matarczyk. I miss you now that you’re gone. Thanks to Allan and
Vll
dinners and decadent desserts at the farm. Finally, thanking my husband Scott feels
like an unsatisfactory token for such hearty gifts; I trust that he already knows how
T hesis ab stract
Shy (Thalassarche cauta) and white-capped (T. steadi) albatrosses are categorised as vulnerable according to the International Union for the Conservation of Nature
criteria and are incidentally killed during their interactions with fisheries. I used
genetic tools to allow the first reliable separation of shy and white-capped
albatrosses, and to describe their evolutionary histories, their conservation and
population genetics, their unusual patterns of mitochondrial DNA evolution, the
spatial distribution of fisheries bycatch mortality, and the mating system of shy
albatrosses. This is the first in-depth study to investigate these species concurrently,
and thereby provides extensive species-specific information that was previously
unavailable for these taxa.
The first part of this thesis begins with an investigation of the evolutionary
relationship between shy and white-capped albatrosses using mitochondrial DNA
control region sequences (Chapter I). Phylogenetic analyses showed strong
separation of a clade containing shy and white-capped albatrosses from a clade
containing their closest relatives (T. eremita and T. salvini), but did not decipher species-level relationships. However, phylogeographic techniques confirmed the
demographic isolation of shy from white-capped albatrosses, and suggested that shy
albatrosses arose through range expansion by white-capped albatrosses. In Chapter
II, I built on the results obtained in Chapter I by using polymorphic microsatellite
DNA markers. I detected high levels of genetic structuring and many unshared
alleles between the species, which provided strong evidence against any
contemporary gc-ne flow between them. Within each species, the three island
populations of shy albatrosses were found to be genetically distinct, whereas the
three island populations of white-capped albatrosses were undifferentiated. I
shy albatross population be treated as separate units for conservation. All measures
indicated lower genetic diversity within shy albatrosses than within white-capped
albatrosses and support the hypothesis that shy albatrosses were derived from white-
capped albatrosses.
In Chapter III, I used genetic data to assess the relative impact of fisheries bycatch
mortality on shy and white-capped albatrosses, which had previously been precluded
by difficulties identifying bycatch carcasses to species level. I describe a simple test
based on a single nucleotide polymorphism in mtDNA of shy and white-capped
albatrosses to determine the species composition of fisheries bycatch carcasses
recovered from Australian, New Zealand, and South African waters. The accuracy
of this test was found to he 98%, as evaluated using a more rigorous microsatellite-
based method of provenance assignment, which was also used to determine the
population of origin of bycatch shy albatrosses. Results indicated that bycatch
mortality co-occurred between the two species in Tasmanian waters only; in all other
zones the by catch was exclusively comprised of white-capped albatrosses.
Genotypic provenance assignment testing correctly assigned 72% of shy albatrosses
to their population of origin. This study is the first to provide insight into the relative
vulnerability of shy and white-capped albatrosses to bycatch mortality across a broad
spatial scale, and to establish the vast differences in their at-sea distributions.
In Chapter IV, I investigated the mating system of shy albatrosses. Data on the
reproductive behaviour of procellariiform seabirds are notably lacking, and where
available are inconsistent with genetic paternity data. Hence I combined genetic
paternity analysis with behavioural observations during the pre-laying period to
describe the copulatory behaviour of this species and to identify how males achieve
within-pair and extra-pair paternity. I discovered that the vast majority of
In Chapter V, I characterized a novel mitochondrial DNA duplication near and
including the control region in five Thalassarche albatrosses. Although it was initially thought that selection for small genome size in mtDNA would result in
duplicated segments having a relatively short lifespan, recent studies have revealed
ostensibly functional duplicate copies of the control region that have persisted
through speciation events. Indeed, I found that the duplicate control regions aligned
easily, were not identical in sequence or in length, and did not contain evidence of
degeneration. Phylogenetic analyses indicated that the two control region copies
were evolving largely in concert, however a short section within them was clearly
evolving independently. To my knowledge this is the first time contrasting
evolutionary patterns have been reported for duplicate control regions. Other
evidence suggested that this duplication is present in all procellariform seabirds, and
hence needs to be considered in the development of phytogenies based on
Table of Contents
D eclaration
ii
Dedication
iii
Acknowledgments
iv
Thesis A bstract
viii
G eneral Introduction
1
C hapter T Phylogeography of shy and w hite-capped
albatrosses inferred from m itochondrial DNA sequences-
im plications for population history and taxonom y
13
Abstract 14
Introduction 15
Methods 16
Results 25
Discussion 32
References 39
C hapter II- Genetic stru ctu re, conservation genetics, and
evidence of speciation by range expansion in shy and
white-capped albatrosses
47
Abstract 48
Introduction 49
Methods 52
Results 58
Discussion 63
References 69
C hapter III- M olecular provenance analysis for shy and
w hite-capped albatrosses killed by fisheries interactions
in A ustralia, New Z ealand and South Africa
77
Abstract 78
Discussion 93
References 100
C h ap ter IV- Copulation behaviour and p atern ity in shy
albatrosses
104
Abstract 105
Introduction 106
Methods 107
Results 110
Discussion 117
References 123
C h ap ter V- D uplicate m itochondrial control regions in
Thalassarche
albatrosses consist of both independently
and concertedly evolving segm ents
126
Abstract 127
Introduction 128
Methods 129
Results and Discussion 135
References 144
F u tu re D irections
149
General
Albatrosses spend most of their lives foraging over large tracts of ocean, favouring
the rough and bountiful seas in high latitudes of the southern ocean that early sailors
dubbed the ‘Roaring Forties, Furious Fifties, and Shrieking Sixties’. After fledging
from their natal island juveniles spend years at sea before returning to land to find a
mate and breed. Reproductive rates are low; albatrosses take up to 12 years to reach
breeding age (Croxall et al. 1990; Weimerskirch et al. 1987) and then produce a single chick every one or two years (Gales 1998). Mean annual adult survival rates
are naturally very high, in the order of 95% (Croxall et al. 1990; Weimerskirch et al
1987). They are amongst the longest living of birds: the oldest known albatross was
over 60 years old when it ceased returning to its nest (Robertson 1993).
One of the better-known behavioural characteristics of albatrosses is their tendency
to be highly philopatric, which has been confirmed in several species by
demographic studies (e.g. Prince et al. 1994; Sagar et al. 1998; Weimerskirch et al.
1985). This has become a defining feature of the family (Diomedeidae), to the extent
that resulting predictions of restricted gene flow among breeding locations have lead
to a growing view that individual breeding islands host distinct terminal taxa
(Robertson & Nunn 1998). Consistent with this, a recent taxonomic revision of
albatrosses, based in part on cytochrome-6 data (Nunn et al. 1996), recommended that the number of albatross genera be increased from two to four, and recognised
species from 14 to 24 (Robertson & Nunn 1998). The changes to generic boundaries
have not been overly contentious, however assignment of species status to many
populations remains highly debated, and has prompted fine-scale molecular studies
to resolve evolutionary relationships between similar species. This thesis contributes
to that debate.
Burg & Croxall (2001) v.ere the first to publish detailed species specific genetic
analyses of albatrosses following the introduction of the new taxonomy (Robertson
& Nunn 1998). They used mitcohondrial control region sequences and microsatellite
General Introduction 3
albatross complex (Thalassarche melanophris and T. impavida) and within grey headed albatrosses (T. chrysostoma; Burg & Croxall 2001). They followed this with a similar study on the wandering albatross complex (Diomedea antipodensis, D. exulans, D. gibsoni, and D. dabbenena; Burg & Croxall 2004). These studies provided novel and clarifying information about the taxonomy and phylogeography
of these groups, and were the first to investigate population level structuring within
single species. Among their taxonomic results were the discovery of a potentially
cryptic species within T. melanophris, support for recognition of T. impavida as a distinct species, and support for species recognition of three of the four wandering
albatross taxa, with the recommendation that D. antipodensis and D. gibsoni be reclassified as a single species (Burg & Croxall 2001, 2004). At the within-species
level, Burg & Croxall (2001, 2004) found widely distributed global populations of
both grey-headed albatross and the D. exulans type of wandering albatross to be undifferentiated and described them as globally panmictic. Similarly, a group of
three geographically distant T. melanophris black-browed albatross populations were undifferentiated (Burg & Croxall 2001). These results not only shed light on
albatross taxonomy, but they also contribute to a small but growing body of recently
emerging evidence that dispersal among albatross populations can be
demographically and genetically significant. More recently, Inchausti &
Weimerskirch (2002) found that juvenile dispersal among D. exulans wandering albatross populations was sufficient to cause metapopulation structure throughout
their range.
Arriving at a consensus on appropriate taxonomic boundaries in albatrosses and
improving our understanding of within-species population dynamics is not only of
academic value, but is particularly relevant to ongoing conservation concerns. An
intimidating 83% of albatross species are categorised as Threatened under the
International Union the Conservation of Nature (IUCN) criteria, which is the highest
1998). Concern for the future of albatross species centres around fisheries-related
albatross mortality, which is occurring on a global scale and is thought to affect a
large proportion of species (Croxall et al. 1998; Gales 1998; Inchausti & Weimerskirch 2001; Nel et al. 2002; Prince et al. 1998; Prince et al. 1994; Weimerskirch et al. 1997).
Pelagic and demersal oceanic longline fishing are both known to kill significant
numbers of albatrosses (Gales 1998). This is most commonly caused when birds
ingest baited hooks and drown as they are dragged under the water by the sinking
line. Despite having received considerably less attention than longlining bycatch,
significant albatross mortality also results from interactions with trawl fisheries
(Bartle 1991, Robertson et al. 2003). Deaths tend to occur when birds collide with trawl warps or other cables, or become entangled in the net itself (Baker et al. 2002). While albatrosses have historically encountered a myriad of anthropogenic threats
including introduced predators, habitat degradation, pollutants, and direct human
depredation (Croxall 1998), the current threat imposed by fisheries-related mortality
is potentially the most serious (Gales 1998).
Conservation efforts are typically aimed at the species level (Haig 1998), therefore
an inexact taxonomy for albatrosses could lead to misguided conservation priorities.
Further, even with a well-established taxonomy, taxonomic designations in
themselves may not sufficiently reflect levels of genetic diversity within single
species from a conservation standpoint. To guard against significant loss of genetic
diversity, which corresponds to a loss in evolutionary potential, conservation
priorities may need to consider individual populations or sets of populations
separately (Moritz 1994). This philosophy has lead to the emergence of the concept
of evolutionarily significar. units (ESUs; reviewed in Fraser & Bernatchez 2001),
which are designed to guide conservation priorities below taxonomic levels. ESUs
have been identified within many species of conservation relevance (e.g. Alpers et al.
General Introduction 5
& Thorley 2003; Waits et al. 2000; Zink et al. 2002), including black-browed and wandering albatrosses (Burg & Croxall 2001, 2004).
One of the most contentious recommendations made by the new albatross taxonomy
involves two taxa, which are the main focus of this thesis. Each of four subspecies
of the polytypic shy albatross (Diomedea cauta) was upgraded to separate species, named shy (Thalassarche cauta), white-capped (T. steadi), Salvin’s (7! salvini), and Chatham (T. eremita) albatrosses (Robertson & Nunn 1998). The separation of shy and white-capped albatrosses has been hotly debated, as there is no substantial
evidence for any genetic or morphological differences between them. Further, the
validity of criteria used to justify the split have been questioned (Holdaway et al.
2001; Tennyson 2002), resulting in some recent publications recognising them as
separate species (Garnett & Crowley 2000; Shirihai 2002) and others regarding them
as a single species (Brooke 2004; Tickell 2000). While investigating the
appropriateness of this classification is one of the aims of this thesis, for ease of
discussion I use the names ‘shy albatross’ and ‘white-capped albatross’ and refer to
them as species. I also use the term ‘shy-type’ albatrosses to refer to them
collectively.
Shy albatross breeding populations are found on three islands near Tasmania,
Australia, which are roughly 1800 km from the three main breeding sites of white-
capped albatrosses within the Auckland Islands group in New Zealand’s subantarctic.
The global number of breeding pairs is estimated at 12000 for shy albatrosses and
75000 for white-capped albatrosses (Gales 1998). Shy and white-capped albatrosses
are both categorised as Vulnerable under IUCN guidelines (Croxall & Gales 1998)
and are thought to be suffering severe fisheries-related mortality across a wide
geographic range. Estimates of longline fishing bycatch from tuna fisheries in
Australian waters in 1992 indicate that shy-type albatrosses were caught in the
1997). Similarly, the abundance of shy-type albatrosses killed by tuna longliners in
South African waters from 1998-2000 was higher than that of any other albatross
species (Ryan et al. 2002). In New Zealand, more shy-type albatrosses were killed by interactions with the squid trawl fishery between 1996 and 2001 than any other
seabird (Robertson et al. 2003).
Due to the inherent difficulties associated with observing animals that spend most of
their lives at sea and breed on remote oceanic islands, genetic methods present one of
the most logistically feasible means of studying them. Indeed many conservation
efforts have used genetics to learn more about species that are difficult or impossible
to track in the wild (e.g. Amos et al. 1993, Duran et al. 2004, Encalada et al. 1998, Nielsen et al. 1994, Page et al. 2004, Primmer et al 1999, Watts et al. 2004). My aim in this thesis is to apply currently available genetic tools to gain useful and
interesting information about shy and white-capped albatrosses.
My thesis is organised into five chapters. Each chapter is designed to stand alone
and includes a thorough introduction to the specific topic and a review of relevant
literature, therefore I have kept this general introduction brief. All chapters are
written in a style suitable for publication; some have already been published and
others have been submitted. It begins with two chapters in which I develop
molecular markers and investigate the genetic relationship between shy and white-
capped albatrosses. The following two chapters apply these molecular tools; first to
assign provenance to by catch birds, and second to examine parentage. The final
chapter stems from an intriguing result I obtained while developing techniques to
generate mitochondrial control region sequence data. A brief outline of my thesis is
General Introduction 7
• In Chapter I, I clarify the evolutionary relationship between shy and white-
capped albatrosses through a phylogenetic and phylogeographic study using
the mitochondrial control region. I also investigate the population histories of
both taxa and relate them to speciation processes.
• In Chapter II, I use microsatellite DNA markers to examine the partitioning
of genetic diversity within and between shy and white-capped albatrosses on
a finer scale than was possible using mitochondrial DNA. I assess whether
natal philopatry has lead to population level genetic differentiation in these
species and discuss how results impact on conservation priorities and possible
ESU designations.
• In Chapter III, I develop a genetic method of distinguishing between shy and
white-capped albatrosses, which overcomes our previous inability to identify
shy-type bycatch carcasses to species level based on morphology. Next, I
determine where and in what proportions these species are killed by fisheries-
related activity in Australian, New Zealand, and South African waters.
• In Chapter IV, I use microsatellite DNA markers to determine whether shy
albatrosses are always faithful to their social mates and, if not, what
behavioural mechanisms lead to extra-pair young. This was prompted by
results of Huyvaert et al. (2000) who discovered 25% extra-pair paternity in waved albatrosses, in contrast to previous evidence that colonial seabirds had
low levels of extra-pair paternity. Behavioural data were not available to help
interpret this surprising finding.
• In Chapter V, I investigate the source of an unexpected finding in Chapter I
of apparent sequence heteroplasmy in the mitochondrial control region of shy
References
Alpers DL, Van Vuuren BJ, Arctander P, Robinson TJ (2004) Population genetics of
the roan antelope (Hippotragus equinus) with suggestions for conservation.
Molecular Ecology, 13, 1771-1784.
Amos B, Schlotterer C, Tautz D (1993) Social structure of pilot whales revealed by
analytical DNA profiling. Science, 260, 670-672.
Baker GB, Gales R, Hamilton S, Wilkinson V (2002) Albatrosses and petrels in
Australia: a review of their conservation and management. Emu, 102, 71-97. Bartle JA (1991) Incidental capture of seabirds in the New Zealand subantarctic
squid trawl fishery, 1990. Bird Conservation International, 1, 351-359.
Brooke M (2004) Albatrosses and Petrels across the World. Oxford LIniversity Press, New York.
Burg TM, Croxall JP (2001) Global relationships amongst black-browed and grey
headed albatrosses: analysis of population structure using mitochondrial DNA
and microsatellites. Molecular Ecology, 10, 2647-2660.
Burg TM, Croxall JP (2004) Global population structure and taxonomy of the
wandering albatross species complex. Molecular Ecology, 13, 2345-2355.
Croxall JP, Rothery P, Pickering SPC, Prince PA (1990) Reproductive performance,
recruitment and survival of wandering albatrosses Diomedea exulansat Bird Island, South Georgia. Journal o f Animal Ecology, 59, 775-795.
Croxall JP, Gales R (1998) An assessment of the conservation status of albatrosses.
In: Albatross Biology and Conservation (eds. Robertson G, Gales R), pp. 46- 66. Surrey Beatty & Sons, Chipping Norton.
Croxall JP, Prince PA, Rothery P, Wood AG (1998) Population changes in
General Introduction 9
Croxall JP (1998) Research and conservation: a future for albatrosses? In: Albatross: Biology and Conservation(eds. Robertson G, Gales R), pp. 269-290. Surrey Beatty & Sons, Chipping Norton.
Duran S, Palacin C, Becerro MA, Turon X, Giribet G (2004) Genetic diversity and
population structure of the commercially harvested sea urchin Paracentrotus lividus (Echinodermata, Echinoidea). Molecular Ecology, 13, 3317-3328.
Encalada SE, Bjomdal KA, Bolten AB, et al. (1998) Population structure of loggerhead turtle (Caretta caretta) nesting colonies in the Atlantic and
Mediterranean as inferred from mitochondrial DNA control region sequences.
Marine Biology, 130, 567-575.
Fraser DJ, Bernatchez L (2001) Adaptive evolutionary conservation: towards a
unified concept for defining conservation units. Molecular Ecology, 10, 2741 -
2752.
Gales R (1998) Albatross populations: status and threats. In: Albatross Biology and Conservation (eds. Robertson G, Gales R), pp. 20-45. Surrey Beatty & Sons, Chipping Norton.
Garnett S, Crowley G (2000) The Action Plan for Australian Birds. Environment Australia, Canberra.
Haig SM (1998) Molecular contributions to conservation. Ecology, 79, 413-425.
Hammond RL, Macasero W, Flores B, et al. (2001) Phylogenetic reanalysis of the Saudi gazelle and its implications for conservation. Conservation Biology, 15,
1123-1133.
Holdaway RN, Worthy TH, Tennyson AJD (2001) A working list of breeding bird
species of the New Zealand region at first human contact. New Zealand Journal o f Zoology, 28, 119-187.
Huyvaert KP, Anderson DJ, Jones TC, Duan WR, Parker PG (2000) Extra-pair
paternity in waved albatrosses. Molecular Ecology, 9, 1415-1419. Inchausti P, Weimerskirch H (2001) Risks of decline and extinction of the
endangered Amsterdam albatross and the projected impact of long-line
Inchausti P, Weimerskirch H (2002) Dispersal and metapopulation dynamics of an
oceanic seabird, the wandering albatross, and its consequences for its
response to long-line fisheries. Journal o f Animal Ecology, 71, 765-770. Klaer N, Polacheck T (1997) By-catch of albatrosses and other seabirds by Japanese
longline fishing vessels in the Australian Fishing Zone from April 1992 to
March 1995. Emu, 97, 150-167.
Moritz C (1994) Defining evolutionarily significant units for conservation. Trends in Ecology & Evolution, 9, 373-375.
Moscarella RA, Aguilera M, Escalante AA (2003) Phylogeography, population
structure, and implications for conservation of white-tailed deer (Odocoileus virginianus) in Venezuela. Journal o f Mammalogy, 84, 1300-1315.
Nel DC, Ryan PG, Crawford RJM, Cooper J, Huyser OAW (2002) Population trends
of albatrosses and petrels at sub-Antarctic Marion Island. Polar Biology, 25, 81-89.
Nielsen JL, Tupper D, Thomas WK (1994) Mitochondrial DNA polymorphism in
unique runs of Chinook salmon (Oncorhynchus tshawytscha) from the Sacramento-San Joaquin river basin. Conservation Biology, 8, 882-884. Nunn GB, Cooper J, Jouventin P, Robertson CJR, Robertson GG (1996)
Evolutionary relationships among extant albatrosses (Procellariiformes,
Diomedeidae) established from complete cytochrome-6 gene sequences. Auk, 113, 784-801.
Page TJ, Sharma S, Hughes JM (2004) Deep phylogenetic structure has conservation
implications for ornate rainbowfish (Melanotaeniidae: Rhadinocentrus ornatus) in Queensland, eastern Australia. Marine and Freshwater Research, 55, 165-172.
General Introduction 11
Prince PA, Croxall JP, Trathan PN, Wood AG (1998) The pelagic distribution of
South Georgia albatrosses and their relationships with fisheries. In: Albatross: Biology and Conservation (eds. Robertson G, Gales R), pp. 137-167. Surrey Beatty & Sons, Chipping Norton.
Prince PA, Rothery P, Croxall JP, Wood AG (1994) Population dynamics of black-
browed and grey-headed albatrosses Diomedea melanophris and D. chrysostomaat Bird Island, South Georgia. Ibis, 136, 50-71.
Robertson CJR (1993) Survival and longevity of the Northern Royal Albatross
Diomedea epomophora sanfordiat Taiaroa Head 1937-93. Emu, 93, 269-276. Robertson CJR, Bell E, Schofield P (2003) Autopsy report for seabirds killed and
returned from New Zealand fisheries, 1 October 2001 to 30 September 2002.
Department of Conservation, Wellington, New Zealand.
Robertson CJR, Nunn GB (1998) Towards a new taxonomy for albatrosses. In:
Albatross: Biology and Conservation(eds. Robertson G, Gales R), pp. 13-19. Surrey Beatty & Sons, Chipping Norton.
Ryan PG, Keith DG, Kroese M (2002) Seabird by catch by tuna longline fisheries off
southern Africa, 1998-2000. South African Journal o f Marine Science, 24, 103-110.
Sagar PM, Stahl JC, Molloy J (1998) Sex determination and natal philopatry of
southern Buller's mollymawks {Diomedea bulleri bulleri). Notornis, 45, 271 - 278.
Shirihai H (2002) A complete guide to Antarctic wildlife Alula Press, Degerby, Finland.
Solorzano S, Baker AJ, Oyama K (2004) Conservation priorities for resplendent
quetzals based on analysis of mitochondrial DNA control-region sequences.
Condor, 106, 449-456.
Stefanni S, Thorley JL (2003) Mitochondrial DNA phylogeography reveals the
Pomatoschistus minutus in the Adriatic (Eastern Mediterranean). Molecular Phylogenetics and Evolution, 28, 601-609.
Tennyson A (2002) A recent review of New Zealand seabirds. Australasian Seabird Bulletin, 38, 3-5.
Tickell WLN (2000) Albatrosses. Pica Press, Sussex.
Waits L, Taberlet P, Swenson JE, Sandegren F, Franzen R (2000) Nuclear DNA
microsatellite analysis of genetic diversity and gene flow in the Scandinavian
brown bear (Ursus arctos). Molecular Ecology, 9, 421-431.
Watts PC, Rouquette JR, Saccheri J, Kemp SJ, Thompson DJ (2004) Molecular and
ecological evidence for small-scale isolation by distance in an endangered
damselfly, Coenagrion mercuriale. Molecular Ecology, 13, 2931-2945. Weimerskirch H, Clobert J, Jouventin P (1987) Survival in five southern albatrosses
and its relationship with their life history. Journal o f Animal Ecology, 56, 1043-1055.
Weimerskirch H, Brothers N, Jouventin P (1997) Population dynamics of wandering
albatross Diomedea exulans and Amsterdam albatross D. amsterdamensis in the Indian Ocean and their relationships with long-line fisheries -
conservation implications. Biological Conservation, 79, 257-270.
Weimerskirch H, Jouventin P, Mougin JL, Stahl JC, Van Beveren M (1985) Banding
recoveries and the dispersal of seabirds breeding in French austral and
Antarctic territories. Emu, 85, 22-33.
Zink RM, Drovetski SV, Rohwer S (2002) Phylogeographic patterns in the great
C hapter I
Phylogeography of shy and white-capped
albatrosses inferred from mitochondrial
DNA sequences: implications for
population history and taxonomy
Abstract
The evolutionary relationship between shy (Thalassarche cauta) and white-capped
(T. steadi) albatrosses was examined using mitochondrial control region sequences. Results were interpreted in the context of a recent and contentious taxonomic
revision that recommended full species status for shy and white-capped albatrosses.
Low sequence divergence between shy and white-capped albatrosses (1.8%) and
between their close relatives, Salvin’s and Chatham albatrosses (2.9%) was observed.
Much higher sequence divergence was found between the shy/white-capped pair and
the Salvin’ s/Chatham pair (7.0%). Phylogenetic analyses confirmed the separation
of the shy/white-capped pair from the Salvin’s/Chatham pair but did not provide
species-level resolution. Phylogeographic analyses, including a nested clade
analysis, Fst estimates, and an analysis of molecular variance indicated unambiguous genetic structuring between shy and white-capped albatrosses, thus confirming the
demographic isolation of the species, but showed little to no structuring within each
species. The geographic distribution of mtDNA haplotypes and other evidence
suggest that shy albatrosses arose through range expansion by white-capped
Chapter I: Phylogeography o f shy and white-capped albatrosses 15
Introduction
Attempts to define appropriate taxonomic boundaries in albatrosses (Family
Diomedeidae) have traditionally been encumbered by a heavy reliance on incomplete
specimen collections and a singular focus on morphology (Robertson & Nunn 1998).
In 1998, Robertson and Nunn (1998) suggested a revised taxonomy for albatrosses
based on morphology and cytochrome b sequence data presented by Nunn et al.
(1996). It was recommended that the number of albatross genera be increased from
two to four, and recognised species from 14 to 24 (Robertson & Nunn 1998). The
generic changes have not been overly contentious, however a number of species
status designations have remained highly debated, and have prompted molecular
studies targeting the more quickly evolving mtDNA control region to resolve fine
scale relationships between similar species (e.g. Burg & Croxall 2001).
The new taxonomic recommendations have been accepted as an ‘interim taxonomy’
and as the basis for further research (Alexander et al. 1997). Among the
recommendations is the suggestion that four subspecies of the polytypic shy albatross
(Diomedea cauta) be split into four species, named shy (Thalassarche cauta), white- capped (T. steadi), Salvin’s (Tsalvini), and Chatham (T. eremita) albatrosses. The designation of shy and white-capped albatrosses as unique species has been hotly
contended, as there is no substantial evidence for any genetic or morphological
differences between them. Further, the validity of criteria used to justify the split
have been questioned (Tennyson 2002; Holdaway et al. 2001), resulting in some recent publications recognising them as separate species (e.g. Garnett & Crowley
2000; Shirihai 2002) and others regarding them as a single species (e.g. Tickell
2000). I refer to them jointly as ‘shy-type’ albatrosses in this paper.
Conservation issues make an accurate understanding of the evolutionary relationship
with longline fisheries is considered the biggest threat to the world’s albatross
populations (Croxall 1998). Like the vast majority (83%) of albatross species, shy
and white-capped albatrosses are categorised as Threatened under the IUCN Red List
criteria (Croxall & Gales 1998). Shy-types are reported to be suffering by-catch
mortality on longline fishing hooks in Australian (Brothers 1991), New Zealand
(Murray et al. 1993), and South African (Ryan et al. 2002) waters, however our inability to separate them makes it impossible to assess the impact of bycatch
mortality on either one.
The aims of this study are to (1) explore the phylogenetic relationships among the
four species formerly known together as Diomedea cauta; (2) determine the
phylogeographic distribution of shy and white-capped albatross haplotypes; and (3)
investigate the population histories of shy and white-capped albatrosses and the
evolutionary relationship between them. I use the mitochondrial control region
which is often used for intraspecies or closely-related species comparisons of avian
taxa because it evolves more quickly and therefore can be more informative than
cytochrome b (e.g. Avise et al 2000; Burg & Croxall 2001; Crochet et al. 2000; Milot et al. 2000; Wennerberg 2001). Tree-building methods of phylogeny
reconstruction, Fst estimates, analysis of molecular variance, and network methods including a nested clade analysis are used.
Methods
Nomenclature
In accordance with the most recent taxonomic hypothesis available for albatrosses,
and for ease of discussion in this paper, I have adopted the species nomenclature
‘white-Chapter I: Phylogeography o f shy and white-capped albatrosses 17
capped albatross’ and refer to them as species, although my aim is to investigate the
appropriateness of this classification. The term ‘shy-type’ is used to refer to them
collectively.
Study species and sample collection
Shy and white-capped albatrosses breed in separate geographic regions at slightly
different times of year [shy albatrosses begin laying around the start of September
whereas white-capped albatrosses begin laying in mid-November (Gales 1998)]. Shy
albatrosses breed exclusively on three islands near Tasmania, Australia, which is
roughly 4800 km from the main breeding sites of white-capped albatrosses in the
Auckland Islands group in New Zealand’s subantarctic (Figure 1). A small
population of 50-100 pairs of white-capped albatrosses breed at Bollons Island in the
Antipodes Islands.
I obtained DNA by taking blood from nestlings at breeding colonies. The population
sizes and relative locations of breeding sites, with the number of nestlings sampled
indicated in parentheses, are as follows. Shy albatross at Mewstone (n = 20) and Pedra Branca (n = 20) are separated by about 50 km and have c. 7000 and c. 250 breeding pairs respectively (Brothers et al 1998). Approximately 420 km away is a shy albatross population on Albatross Island (n = 20) with c. 5000 breeding pairs (Brothers et al. 1998). The three white-capped albatross breeding sites in the Auckland Islands are located within approximately 30 km of each other (population
sizes taken from Gales 1998): c. 72000 pairs on Disappointment Island (n = 20); c.
3000 pairs at Southwest Cape, Auckland Island (n = 19); and c. 100 pairs at Logan Point, Adams Island {n = 20). Samples from the small population of white-capped albatrosses at Bollons Island were not obtained. Both species lay only one egg per
year, hence sampling siblings was not a concern, though I also purposely sampled
Figure 1. Locations of sampled breeding sites for shy and white-capped albatrosses. Sample sizes per population are as follows: Albatross Island (n = 20), Mewstone (n = 20), Pedra Branca (n = 20), Disappointment Island (n = 20), Southwest Cape (n =
Chapter I: Phylogeography o f shy and white-capped albatrosses 19
probability of sampling related individuals at adjacent nests. A minimum of five
nests separated the nests of sampled chicks, except at Logan Point where small
population size demanded more intensive sampling.
Tissue samples from three Salvin’s albatrosses, three Chatham albatrosses, and two
Buller’s albatrosses (Thalassarche bullert) were obtained from specimens from the New Zealand Conservation Services Levy Program and provided to us by the New
Zealand Department of Conservation and CJR Robertson. Both blood and tissue
samples were stored in 70% ethanol.
DNA extraction and sequencing
DNA was extracted using ammonium acetate as described in Nicholls et al. (2000). As there were no control region primers published for albatrosses at the time, I
obtained sequence from cytochrome b and 12S genes for shy albatrosses using
universal primers (Kocher et al. 1989; Simon et al. 1994). Within these regions I designed specific primers (forward primer cbFl: 5’-
ATGAATCGGCAGCCAACCAGTAG-3’ and reverse primer 12sRl: 5’-
TAAGCGTTTGTGCTCGTAGTTCTC-3’) that amplified a 3000 bp fragment of
mtDNA containing the control region. I obtained complete sequence for this region
by repeatedly sequencing, designing internal primers, and sequencing again until I
had ‘walked-through’ the entire fragment.
The initial ‘long-range’ PCR using cbFl and 12sRl was done using the Expand High
Fidelity PCR System (Boehringer Mannheim). Each reaction contained 100-200 ng
of genomic DNA, 200 pM dNTP, 10 pmol of each primer, and 2.6 U of Expand High
Fidelity enzyme mix in lx reaction buffer in a 50 pi reaction volume. The cycling
parameters were: 94 °C for 2 min; 30 cycles of 5 s at 94 °C, 30 s at 65 °C, 2.5 min
products were run in a 2% agarose gel, and then purified using the Bresaclean DNA
Purification Kit (Bresatec). I sequenced 2-5 pi o f purified PCR product using
Applied Biosystems BigDye sequencing system and 1.6 pmol o f primer in a 10 pi
reaction volume. Products were then run on an ABI Prism 377 automated sequencer.
Internal sequencing using nested primers followed the same protocol.
Domain I was the only readily amplifiable, variable segment o f the control region:
long repeats in Domain III made sequencing and subsequent alignment problematic.
Similar complex repeats have been reported in mtDNA o f other albatross (Burg
2000) and seabird (Berg et al. 1995) species. Domain II was highly conserved
between shy-types and therefore uninformative at the level I was targeting. Forward
primer GluF6 (5’-AGGATTAGACGCAACTGCCAGC-3’) and reverse primer
GluR6 (5’-GACGCCCCAAAAAAAAAAGG-3’) were designed for specific
amplification o f 600 bp containing all o f Domain I and flanking regions using the
same PCR reaction conditions and cycling parameters stated above except that an
annealing temperature of 55 °C was used. PCR products were gel purified using
Concert Rapid Gel Extraction System (Life Technologies). Approximately 340 bp o f
sequence were obtained using an internal primer GluR7 (5*-
CGGGTTGCTGATTTCTCG-3’) because it yielded superior sequence quality
compared to GluR6.
Initial amplifications yielded ambiguous sequence due to the consistent occurrence
o f double peaks at some sites. To investigate the source o f the ambiguity, PCR
products were cloned into pGEM-5Zf(+) according to the protocol supplied by the
manufacturer (Promega), and transformed using heat shock into JM109 Competent
Cells (Promega). Several clones were sequenced for one individual o f each species.
Two unique sequences were identified within single individuals for all species. New
forward primers were designed that specifically amplified each copy with GluR7.
Chapter I: Phylogeography o f shy and white-capped albatrosses 21
and SPECF2 (5 ’ - A AC AGCCT AT GT GTT GAT GT-3 ’) amplified a copy referred to
as F2. All FI copies were found to contain a recombination signal on analysis using
the reverse successive weighting method o f Trueman (1998). Mitochondria are not
known to recombine, hence FI copies were thought to be nuclear pseudogenes,
which are commonly reported in birds (Allende et dl. 2001; Kidd & Friesen 1998;
Ruokonen et al. 2000; Sorenson & Fleischer 1996). Several recombinant
mitochondrial pseudogenes have been reported in Conirostrum species by Nielsen
and Arctander (2001). As there was no evidence o f recombination in any o f the F2
copies, they were presumed to be o f mitochondrial origin and targeted in this study.
Molecular data set
My molecular data set comprised a 299 bp fragment o f Domain I of the
mitochondrial control region for each o f 30 shy, 29 white-capped, three Salvin’s,
three Chatham, and two Buller’s albatrosses. Sample sizes used in the analyses
varied with the nature o f the technique, as described in relevant sections below.
Sequence quality and base-calling accuracy were evaluated by viewing
chromatograms using Sequencher 3.0 (Gene Codes Corporation). All sequences
aligned easily using ClustalX version 1.8 (Thompson et al. 1994).
SNP Test
Initial control region sequencing o f 59 birds revealed one substitutional change that
consistently separated shy and white-capped albatrosses (see Figure 2). A simple
single nucleotide polymorphism (SNP) test was developed using this site following
the approach outlined in Fitzsimmons et al. (1997) as a time- and cost-effective
means o f screening a larger sample size to test the consistency o f this pattern. Ten
more birds from each o f the six main shy-type breeding islands, all o f which were
4 4 6 7 6 6 7 8 4 5 6 0 7 6 7 8 0 1 2 3 4 5 5 6 0 1 2 3 1 5 3 7 8 4 5 6 8 2 3 6 9 1 3 4 5 7 3 7 9 0 1 6 7 4 6 7 8 3 8 1 2 4
s i ( 5 ) TGGTCGAGCGTACATGCAGGGCGTGi s S l ... A ...
AGTAAGTGGTAATTAGGAGGCTTGCTCGAGTGAATT . . . G ... s S 4 ... G ...
[image:34.541.79.495.103.555.2]s S 7 ... A. . . . s S l O . . T ... G ... s S 5 ... s S 9 ...
...G ... A ...A. . . . ... A . . . T . C ... A. . . . ...C. . . . G ... G ...A . . . . ...A T ... s S 2 . . T ... G ...
s S l l ...
... A . . . T ... A. . . . ...G ... A ... s S 1 4 . A ... ...G . . . . N ... s L I O ... ...G ...A. . . . s L 2 ( 2 ) ...A ...
s L 3 ( 2 ) . . . . N ... G ... ...A ... s L 2 1 ...G ...
s L 4 ( 2 ) ... i
. . C . . . . A . . . G. . . A ... ...A ... s L 2 5 ... T ...AA. . . .
s D 3 8 . . . C ...
...C ... A . T ... ... A ... s D 5 0 ... ...c.
s D 1 6 . . T . . T ...G ... s D 5 . . . . T ... G ... s D 4 1 ... |
... A A ... | ... G. . G . . G . A ... r... G ... s D 7 ...A ... | ... A . . . . c A l l ... C
c A 2 6 ...AC.C
3 . A ... G. . . . . . A. . . . . G. . . A. . . . . 1 ...G ...
c A 3 2 (
c A 6 5 C ... AC. I c A 8 5 ... A ... C
c A l ( 2 ) C.C
cM30 1
cM38 C
cM4 0 1
I...G ... N . A . . . C
1. A ... G ...
1...G ... A ...A . . . . 3 ...G ...A. . . . ! ...G ... A ... A. . . . 3. A . . . AC . . . . G ... A ... A. . . . | ...G. . . A ... cM4 5 ... ( 3 ...G ...T ... cM2 ( 3) ... ] 3 ...G ... c P 3 3 . . . . T ...
c P 3 ( 2 ) ... G ... c P 4 ( 2 ) ... A ... c 5 ( 1 1 ) ... 1
3...G ... A. . . . 3 .A ... G ... A ...A. . . . S ...G ... A ...AG . . . 3 ...G ... A. . . . S a l l O ...A G ...GG. . GT. . .ACAj
S a l l 5 ... G ...G . . G T . . . ACA< S a l l 7 C ...G. . . GT. . T . C . < E r e l ...G T . . . A C A I E r e 2 ( 2 ) ... G. . . GT. . .ACAJ B u i 5 . T T . . T . . T . CG. G . ATG. . . . ACA B u i 9 . T T C . T . . T A T G . G . A T ...AC.
1 . . . . G . G... A A ... AT . . A . . C . . G . . 5 . A . . . . G . A . . G . . . A A ... A T . . A . . C . . G . . I ...G A . C ...A A ... AT. . A . . C . . G . . 3 . A . . . A G ... A A . A . . . . A T . . A . . C . . G . . 1 ...A G ...A A . A . . . . A T . . A . . C . . G . . (G. . . G G . A . . . . C G . A A . A . . . . A . C T . G . C ... | . . . . GA. A . . . . C G . A A . A A . C . . . C T . G A C A . . . .
Chapter I: Phylogeography o f shy and white-capped albatrosses 23
PCR amplifications for the SNP test generated a 183 bp fragment using the
mismatched forward primer (TEST F4t
5’-C A5’-CTT A A A5’-CGG ATT A AA5’-C5’-C5’-C AT G A YT-3 ’) and GluR7. Reactions consisted o f
50 ng o f genomic DNA, 200 pM dNTP, 3.2 mM MgCE, 2 pmol o f each primer, 0.5
U o f AmpliTaq DNA Polymerase (Applied Biosystems) in lx reaction buffer in a 10
pi reaction volume. PCR cycles were 2 min at 94 °C; a ‘touchdown’ o f 25 s at 94
°C, 25 s at 65 °C to 55 °C (dropping 5 °C per 2 cycles), 25 s at 72 °C; 30 cycles o f
25 s at 94 °C, 25 s at 50 °C, 25 s at 72 °C and one final cycle o f 3 min at 72 °C.
PCR products were digested with 3 U o f H infl (Pharmacia Biotech) at 37 °C for at least one hour in a 15 pi reaction volume. Digestion products were run in a 3%
agarose gel to resolve the 26 bp difference between cut products produced by shy
albatross samples and uncut products produced by white-capped albatross samples.
Analysis
Phylogenetic analyses were performed using sequence data from 12 shy, 12 white-
capped, three Salvin’s, three Chatham, and two Buller’s albatrosses (as outgroup).
Trees were constructed in PAUP*4.0bl0 (Swofford 2002) using both unweighted
cladistic parsimony and Maximum Likelihood (ML) methods. Evolutionary process
models for the ML analyses were optimised in Modeltest 3.06 (Posada & Crandall
1998). The robustness o f the tree estimates was assessed by bootstrapping
(Felsenstein 1985) as implemented in PAUP.
Phylogeographic analyses used sequence data from ten shy albatrosses from each o f
the three breeding islands, ten white-capped albatrosses from Disappointment Island
and Adams Island, and nine white-capped albatrosses from Auckland Island.
Arlequin Version 2.001 (Schneider et al. 2000) was used for the analyses and
descriptive statistics described here. Total molecular variance within shy and white-
analyses of molecular variance (amova; Excoffier et al. 1992). Pairwise EVr estimates were generated to investigate genetic differences within and between shy
and white-capped albatross populations, whereby probability values for Fst derive from null distributions generated from 1023 random permutations among
populations. As correcting for multiple hits was unnecessary due to low divergence,
uncorrected sequence divergence estimates were calculated from Nei’s average
number of pairwise differences within and between populations (PiXY; Nei & Li
1979).
A nested clade analysis (NCA) was also performed to examine the population
structure and population histories of shy and white-capped albatrosses. NCA is
aimed at “separating population structure from population history as sources of
geographical associations” among haplotypes (Templeton et al. 1995:768), and has recently become a popular tool for analysing intraspecific genetic data (e.g. Gomez-
Zurita et al. 2000; Paulo et al. 2002; Perkins 2001; Worheide et al. 2002). A statistical parsimony network using a 95% confidence limit was estimated for shy
and white-capped albatross haplotypes and subsequently converted into a nested
cladogram using the program TCS version 1.13 (Clement et al. 2000) and following nesting rules outlined in Crandall (1996), Templeton et al. (1987), and Templeton & Sing (1993). The program GeoDis 2.0 (Posada et al. 2000) was used to test for significant associations between haplotypes and geography using: 1) a nested
contingency analysis, which treats sampled locations as categorical variables; and 2)
a nested geographical distance analysis, which incorporates information of
geographical distances between sampled locations. The latter analysis calculates two
main statistics: the clade distance (Dc) which measures the geographical spread of a
clade, and the nested clade distance (Dn) which measures the geographical spread of
a clade in relation to other clades nested in the same higher-level category (Posada et al. 2000). An inference key first presented in the appendix of Templeton et al.
Chapter /; Phylogeography o f shy and white-capped albatrosses 25
no geographical association among haplotypes is rejected. I used an updated version
of the inference key to interpret the population structure and history of all clades that
yielded significant results (P < 0.05) in the nested geographical distance analysis. In- depth details on nested clade analyses are described in Templeton (1998).
Results
Forty-three variable sites were found among the 59 shy and white-capped albatross
sequences, which defined 37 unique haplotypes: 15 within shy albatrosses and 22
within white-capped albatrosses. Among the 66 total sequences generated from shy,
white-capped, Salvin’s, Chatham, and Buller’s albatrosses, there were 44 unique
haplotypes defined by 62 variable sites (Figure 2). No haplotypes were shared
between shy and white-capped albatrosses and one fixed nucleotide difference was
identified between the two species. Average pairwise sequence divergence between
shy and white-capped albatrosses (1.8%) was less than that between Salvin’s and
Chatham albatrosses (2.9%). Sequence divergence between these two groups was
much higher (7.0%).
Phylogenetics
Fifty-six variable sites were found among the 32 sequences used in the phylogenetic
analyses on shy, white-capped, Salvin’s, Chatham, and Buller’s albatrosses; 42 of
which were parsimony-informative. Cladistic parsimony produced 12 trees in all of
which a Salvin’s/Chatham group is sister to a shy/white-capped group. There was no
clear resolution of the branching order within either of these groups, and bootstrap
support for the Salvin’s/Chatham group was low (51%), implying that its monophyly
Modeltest (Posada & Crandall 1998) applied to the whole of the data suggested a
highly unusual maximum likelihood model in which base-transitions and G-T
transversions are common but all other transversions are disallowed. On inspection
of the aligned data, three variable sites (nos. 46, 102 and 148) were seen to carry
apparent G-T transversions that, because of their distribution across the taxa, raised
serious doubts concerning: (1) the homology of identical states; or (2) the
independence of the apparent transversion event from transitions in immediately
adjacent positions. These three characters were excluded from the analysis.
Modeltest applied to the remaining characters recovered a maximum likelihood
model in which parameter values were biologically reasonable. Application of this
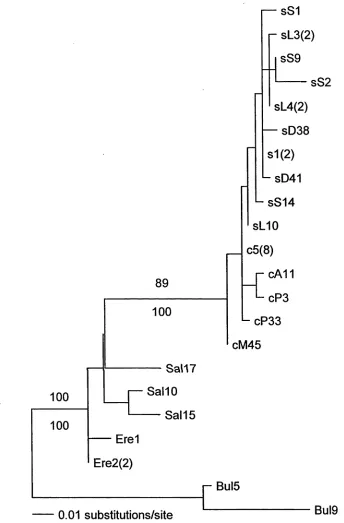
model gave the ML tree in Figure 3, shown with parsimony and ML bootstrap
results.
Results from maximum likelihood and parsimony both suggest a monophyletic but
internally unresolved shy/white-capped group which is well separated from an
unresolved Salvin’ s/Chatham group. The latter is paraphyletic or else not
convincingly monophyletic. Further testing of branches using models optimised with
a variety of combinations of the 'suspect' and adjacent positional characters found no
significant variation from these bootstrap scores (data not shown), further confirming
these results.
Population genetics
The various population genetic analyses of 30 shy and 29 white-capped albatrosses
yielded consistent results, amova showed a small yet statistically significant
proportion of the variance residing among populations within each of the two species
r— sS1
r sL3(2)
sS9
--- sS2
sL4(2)
— sD38
100
100
89
100
---Sal17
— Sal10
--- Sal15
---- Ere1
Ere2(2)
s1 (2)
— sD41
L sS14
sL10
_ c5(8)
p cA11
- cP3
- cP33
cM45
r Bul5
[image:39.541.98.442.64.587.2]0.01 substitutions/site Bul9
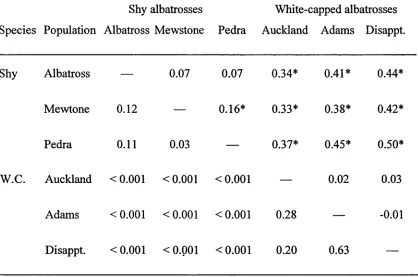
from -0.01 (interpreted as zero) between Logan Point and Disappointment Island, to
0.50 between Pedra Branca and Disappointment Island (Table 1). Fst values for all excepting one (Mewstone/Pedra Branca, P < 0.05) within-species population level comparisons were non-significant, and all between-species population level
comparisons were highly significant (P < 0.001).
Phylogeography and nested clade analysis
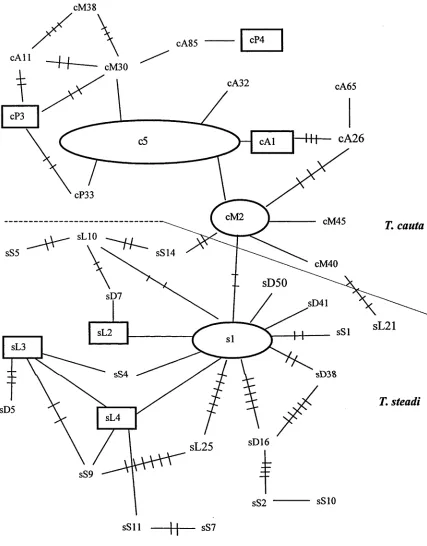
The minimum spanning network (MSN; Figure 4) depicts shy and white-capped
albatrosses as two distinct groups connected by as little as one fixed substitutional
change, with one white-capped albatross haplotype as an exception (sL21). This
outlier is four mutational steps from the nearest shy albatross haplotype (cM40), five
steps from one other shy haplotype (cM2), and is over five steps from other shy
haplotypes. However it is five mutational steps from four white capped albatross
haplotypes. Its correct association appears ambiguous therefore it was excluded
from the NCA.
During the nesting procedure of the NCA, loops in the statistical parsimony network
lead to ambiguities in the nesting design. In these cases I placed geographically
more proximate haplotypes or clades together to prevent significant results arising
artificially from the nesting procedure itself.
The whole network was included in four three-step clades (Figure 5). The
geographical distribution of clade 3.2 corresponded to the shy albatross breeding
range, that of both clades 3.1 and 3.4 corresponded to the white-capped albatross
breeding range that was represented in this study, and the distnnution of clade 3.4
covered Disappointment Island and Southwest Cape only. The null hypothesis of no
geographical association of clades was rejected by the nested contingency analysis in
Table 1. Matrix of pairwise comparisons of Fst (above diagonal) and their
probability values (below diagonal) for three populations of shy albatrosses and three populations of white-capped albatrosses (W.C.). Values significant at P < 0.05 are marked with an asterisk.
Shy albatrosses White-capped albatrosses
Species Population Albatross Mewstone Pedra Auckland Adams Disappt.
Shy Albatross — 0.07 0.07 0.34* 0.41* 0.44*
Mewtone 0.12 — 0.16* 0.33* 0.38* 0.42*
Pedra 0.11 0.03 — 0.37* 0.45* 0.50*
W.C. Auckland <0.001 <0.001 <0.001 — 0.02 0.03
Adams <0.001 <0.001 <0.001 0.28 — -0.01
[image:41.541.71.489.273.550.2]cM30
cA32
cM45 T. cauta
cM40
[image:42.541.75.502.59.605.2]T. steadi
n. >
* ■§ £ ^ c «
a . 3
:s
and
la
be
ls
o
f
th
re
e
-s
te
p
c
9
three-step clade, 3.1
(x
= 10.8; P < 0.05). Clade 2.1 did not have correspondinglysignificant results in the geographic distance analysis, however clades 2.4 and 3.1,
that were each comprised of four nested lower-level clades, each had one clade with
significantly small and/or large Dc/Dn values. In both cases, the geographical
pattern identified by the inference key was restricted gene flow with isolation by
distance.
The entire cladogram showed highly significant (%2 = 67.4; P < 0.001) associations
between geography and sequence types. The inference key predicted that range
expansion through long distance colonisation from the white-capped albatross range
to the shy albatross range. Each of the three-step clades nested within the entire
cladogram had significantly small Dc values, and clade 3.2 (which was comprised
exclusively of shy albatrosses, who were absent from all other three-step clades) also
had a significantly large Dn value. The coupling of a small Dc and large Dn for
clade 3.2 is suggestive of long-distance movements.
SNP Test
All of the 60 known-provenance birds that were subjected to the SNP test were
correctly identified, thus implying that the substitutional change is indeed a fixed
difference between shy and white-capped albatrosses.
Discussion
I found low levels of sequence divergence in the mitochondrial control region
between shy and white-capped albatrosses. Phylogenetic analyses aimed at reducing
the current ambiguity around their taxonomic status did not resolve species-level
Chapter I: Phylogeography o f shy and white-capped albatrosses 33
shy and white-capped albatrosses and the evolutionary relationship between them
was gained using analytical tools designed for intra-specific comparisons. Similar
findings of low control region divergence have been reported in other closely related
albatross species (Burg 2000).
Shy and white-capped albatrosses do not form phylogenetically distinct groups,
though there is a fixed difference between them. The absence of shared haplotypes is
unlikely to be an artifact of high haplotype diversity and inadequate sample sizes
because the AMOVA analysis shows that the between-species component of molecular
variance is 15 times higher than the within-species component. Hence it can be
inferred that the lack of haplotype sharing indicates that females do not migrate
between the geographic areas in which the forms occur. The low divergence
observed between shy and white-capped albatrosses suggests that this demographic
isolation is recent, as does the starburst pattern in Figure 4.
Phylogeny
Phylogenetic analyses showed that the shy and white-capped albatross group is
monophyletic, but the Salvin’s and Chatham albatross group is not monophyletic.
These analyses did not provide resolution to species level within either group. This
is surprising with respect to the Salvin’s and Chatham albatross group considering
the gross morphological differences between them. Adult Chatham albatrosses have
very dark plumage on the head and neck and unmistakably bright yellow bills, while
Salvin’ s albatrosses have noticeably lighter grey head and neck plumage and grey
bills with a contrasting pale culminicom (Tickell 2000). Conversely, it is less
surprising that phylogenetic methods did not resolve the shy and white-capped