Effect of Applied Field and Rate of Voltage Rise on
Surface Breakdown of Oil-Immersed Polymers
Mark P. Wilson, Igor V. Timoshkin, Martin J. Given, Scott J. MacGregor
Institute for Energy and Environment, Dept. Electronic & Electrical Engineering, University of Strathclyde Royal College Building, 204 George Street
Glasgow, G1 1XW, UK
Mark A. Sinclair, Ken J. Thomas
Hydrodynamics Division AWE Aldermaston Reading, RG7 4PR, UK
and
Jane M. Lehr
Sandia National Laboratories P.O. Box 5800, MS 1193 Albuquerque, NM 87185-1193, USA
ABSTRACT
In sub-systems of high-voltage, pulsed-power machines, the introduction of a solid into bulk liquid insulation located between two conductors is often necessary to provide mechanical support. Breakdown events on or around the surface of the solid can result in permanent damage to the insulation system. Described in the present paper are experimental results pertaining to surface breakdown of five different solid dielectrics held between plane-parallel electrodes immersed in mineral oil. The effect of varying level of peak applied field from 200 kV/cm (dV/dt 70 kV/µs) to 1 MV/cm (dV/dt 350 kV/µs) is investigated, and the breakdown voltages and times to breakdown are compared to those for an open oil gap. The time to breakdown is shown to be reduced by the introduction of a solid spacer into the gap. Rexolite and Torlon samples suffered significant mechanical damage, and consistently showed lower breakdown voltage than the other materials – average streamer propagation velocity up to 125 km/s was implied by the short times to breakdown. Although ultra-high molecular weight polyethylene yielded the longest times to breakdown of the five types of liquid-solid gap, breakdown events could be initiated at lower levels of applied field for spacers of this material than those with permittivity closely matched to that of the surrounding mineral oil. Polypropylene and low-density polyethylene are concluded to provide the most stable performance in mineral oil. Due to the similarity of the applied voltage wave-shape (1/6.5 µs) to short-tail lightning impulses, the results may also be of interest to high-voltage system designers in the power industry.
Index Terms — Dielectric breakdown, flashover, oil insulation, plastic insulation,
pulse power systems.
1 INTRODUCTION
THE interface between different dielectric media often proves to be the weakest link in a composite high-voltage insulation system; usually comprising a solid dielectric immersed in either atmospheric air, vacuum, a compressed gas, or a dielectric liquid.
For three of these media – air, vacuum and compressed gases such as SF6 – dielectric performance under different conditions
of applied voltage are fairly well documented, and reliable test
procedures and design criteria have been established. On the other hand, less information is available on the behavior of solid dielectrics immersed in dielectric liquids; an area of high-voltage engineering that has become increasingly important in recent years with the development of new industrial-scale pulsed-power machines to be operated under multi-megavolt regimes.
cylindrical plastic legs necessary to provide mechanical support. Breakdown events on or around the surface of the solid can result in permanent damage to the insulation system, resulting in reduced voltage hold-off capability and system downtime as the damaged component is located and replaced. Experimental data on the electrical field levels that can be applied to different oil-immersed solids without resulting in surface breakdown events is therefore required to facilitate the design of composite liquid-solid insulation systems. The present study is a contribution to this area of high-voltage pulsed-power engineering, and involves an investigation of the performance of five different dielectric materials (polypropylene (PP), low-density polyethylene (LDPE), ultra-high molecular weight polyethylene (UHMWPE), Rexolite, and Torlon) held between plane-parallel electrodes and immersed in mineral oil.
In such a composite insulation system, charge creation at the liquid-solid interface affects streamer development and propagation. Korobeynikov et al. describe the mechanism of surface charge creation by image forces, leading to the formation of electric double layers, in [1]. In the case of a polar solid of high relative permittivity (Torlon in the present study) immersed in a non-polar liquid such as mineral oil, the image force is negative and charges present in the liquid due to dissociation of molecules can be attracted towards the liquid-solid interface. Korobeynikov et al. show through theoretical analysis that the recombination constant for ion pairs at the interface is one order of magnitude less than that in the liquid bulk, while the dissociation constant is approximately seven orders of magnitude greater than in the liquid bulk. In terms of the influence of the applied electric field, Korobeynikov et al. calculate that a field of 200 kV/cm will cause a strong increase of ion dissociation when the direction of the field is parallel to the solid surface. This electric field level is chosen as the minimum applied field for the present study.
The authors of this paper previously reported on the voltages and times associated with breakdown of PP, LDPE, UHMWPE, Rexolite, and Torlon samples immersed in mineral oil, when the composite insulation system was subjected to over-voltages [2]. Described in the present paper are the results of experiments at field levels where breakdown did not follow the application of each impulse, for the same five materials. Differences in the minimum applied field required to initiate breakdown events, the breakdown voltages, times to breakdown, and corresponding implied average streamer propagation velocities and modes of propagation are described and discussed. The results are compared to those for an open oil gap without solid spacer, and recommendations made regarding the most suitable materials for use as mineral-oil immersed insulation in high-voltage pulsed-power machines.
Due to the similarity of the applied voltage wave-shape (1/6.5 µs) to short-tail lightning impulses, the results may also be of interest to high-voltage system designers in the power industry.
2 EXPERIMENTAL ARRANGEMENT
The experimental system comprised a high-voltage impulse generator, test cell, and voltage/current monitoring
diagnostics. The impulse generator is a ten-stage, air-insulated, inverting Marx generator, capable of producing output voltages in the region of 500 kV. The erected capacitance of the Marx is 8 nF, and switching is achieved by the depressurization of an in-line spark-column, consisting of ten discrete spark-gap switches, filled with dry air. The storage capacitors are charged by a positive-polarity Glassman high-voltage dc supply. An 800 Ω aqueous copper sulphate (CuSO4) wave-tail resistor and a 1.6 kΩ CuSO4 wave-front
resistor were utilised as shaping components. A wave-front capacitance of 200 pF was also connected in parallel with the test-cell load. The impulse rise-time was ~1 μs, with a fall-time to half peak value of 6.5 μs.
[image:2.612.385.507.292.361.2]The test cell consists of a pair of 50-mm-diameter aluminium electrodes in a plane-parallel configuration, between which the polymer samples are inserted for testing, as illustrated in Figure 1. For testing, the cell is immersed in ~20 litres of EOS Ltd. L10B reclaimed mineral oil.
Figure 1.Sketch of electrode/sample geometry (d = 3.5 mm).
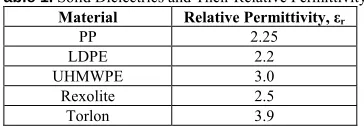
[image:2.612.349.531.531.594.2]The cylindrical solid samples used in the study were of diameter 25 mm. The materials are listed along with their relative permittivity in Table 1. Prior to testing, all samples were rinsed in warm water with a little detergent to remove any surface grease, and then rinsed in isopropyl alcohol and dried in an oven at 50 °C for one hour to remove surface moisture. Powder-free latex gloves were worn throughout the pre-treatment process to prevent re-contamination of the sample surfaces.
Table 1.Solid Dielectrics and Their Relative Permittivity
Material Relative Permittivity, εr
PP 2.25 LDPE 2.2 UHMWPE 3.0
Rexolite 2.5 Torlon 3.9
The impulse voltage waveforms were monitored using a Tektronix P6015A probe connected to a tap-off point on a Samtech Ltd. DE(LRP)-02 CuSO4 voltage divider (10 kΩ
sensitivity of 14 V/kA. Typical example waveforms at breakdown are shown in Figure 2.
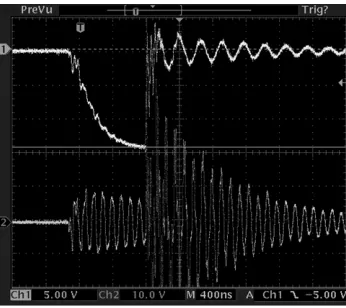
[image:3.612.86.259.82.236.2]
Figure 2. Example voltage and current waveforms for breakdown of an UHMWPE sample at 400 kV/cm applied field (dV/dt 140 kV/µs): breakdown voltage 140 kV; time to breakdown 936 ns. Note the current increase (lower trace) and voltage collapse (upper trace) at the point of breakdown.
3 EXPERIMENTAL RESULTS
A series of tests was conducted at four different levels of applied voltage: 70 kV; 140 kV; 245 kV; and 350 kV. As the impulse rise-time was fixed at 1 µs, changing the applied voltage resulted in a different rate of voltage rise as well as different peak applied electric field – the details for the different test conditions are listed in Table 2. Average rate of voltage rise was calculated by dividing the peak applied voltage by the time to peak voltage (i.e. 1 µs). The sample and inter-electrode gap length, d, was fixed at 3.5 mm for all tests. The insulation system was subjected to 20 impulse voltages, and the breakdown voltages and times to breakdown were recorded each time a breakdown event occurred.
As well as testing liquid-solid gaps consisting of each of the solid polymers immersed in mineral oil, an open oil gap (i.e. no solid spacer between the electrodes) of length 3.5 mm was also tested to provide reference data.
Table 2.Details of Different Test Conditions
Voltage (kV) dV/dt (kV/µs) Peak Applied Field (kV/cm)
70 70 200
140 140 400
245 245 700
350 350 1000
At the lowest level of peak applied field, 200 kV/cm, no breakdown event was found to occur, either on the rising or the falling edge of the impulse, for the open oil gap or any of the liquid-solid gaps.
When the peak applied field was increased to 400 kV/cm (dV/dt 245 kV/µs), the open oil gap again withstood all 20 applied impulses. The materials with εr close to that of the oil
– PP, LDPE, and Rexolite – again withstood each applied impulse.
Torlon, the material with highest εr, was broken down upon
application of each voltage impulse to the insulation system, and the variation in breakdown voltage over the 20 shots is
shown in Figure 3. Between these two extremes of behavior, the UHMWPE sample, with εr lower than Torlon but higher
than the other three materials, was broken down on application of 11 of 20 shots, a probability of 0.55. The time to breakdown for UHMWPE was up to 4 µs for these measurements, as breakdown occurred on the falling edge of the impulse. For comparison, the average time to breakdown for Torlon was 675±119 ns (± value corresponds to standard deviation), and all breakdown events occurred on the impulse rising edge. The breakdown voltages for UHMWPE are also shown in Figure 3. These results suggest that the breakdown initiation field for the gaps with solids of higher εr solids lies
between 200 kV/cm and 400 kV/cm.
UHMWPE Torlon
100 110 120 130 140 150 160
0 5 10 15 20
B
re
akdow
n V
ol
tag
e
M
ag
ni
tude (
kV
)
[image:3.612.316.565.237.369.2]Shot Number
Figure 3. Breakdown voltage magnitude versus shot number for 400 kV/cm peak applied field (dV/dt 140 kV/µs).
The curves in Figure 4 show the breakdown behavior when the applied field was increased to 700 kV/cm (dV/dt 245 kV/µs), which resulted in breakdown of the open oil gap and all liquid-solid gaps for each of the 20 applied impulses. Breakdown always occurred around the peak of the impulse in the open oil gap, and it is clear that the breakdown voltage was more stable than that for any of the liquid-solid gaps. This suggests a consistent breakdown mechanism for the open oil gap. The breakdown voltage for LDPE decreased with an increasing number of breakdown events, whereas the breakdown voltage for both PP and UHMWPE initially increased and then stabilized at around the peak impulse magnitude for shots 10-20. Torlon showed the least variation in this configuration, but at lower voltages than PP, LDPE, and UHMWPE. The breakdown voltage for Rexolite initially decreased, was relatively constant over shots 6-16, and then rapidly decreased to shot 19, corresponding with the propagation of faster streamers.
[image:3.612.59.288.524.580.2]and UHMWPE. The response for Torlon was also fairly flat, but again at lower voltages than the other materials.
80 130 180 230 280
0 5 10 15 20
B
rea
kd
ow
n V
ol
ta
ge
M
ag
ni
tu
de
(k
V
)
Shot Number
[image:4.612.48.300.82.210.2]PP LDPE UHMWPE Rexolite Torlon Open Oil Gap
Figure 4.Breakdown voltage magnitude versus shot number for 700 kV/cm peak applied field (dV/dt 245 kV/µs).
100 150 200 250 300 350
0 5 10 15 20
Br
ea
kd
ow
n V
ol
ta
ge
M
ag
n
it
u
d
e (
k
V
)
Shot Number
[image:4.612.314.562.144.426.2]PP LDPE UHMWPE Rexolite Torlon Open Oil Gap
Figure 5.Breakdown voltage magnitude versus shot number for 1 MV/cm peak applied field (dV/dt 350 kV/µs).
Average times to breakdown and standard deviation (± values) for the different conditions are listed in Table 3. The average delay time was clearly reduced by the introduction of a solid spacer of any material into the gap. At both 245 kV/µs and 350 kV/µs, the rank of the average delay time from longest to shortest was:
1. Open oil gap 2. UHMWPE 3. PP 4. LDPE 5. Rexolite 6. Torlon
Despite the long times to breakdown shown by UHMWPE however, breakdown events did occur at lower levels of peak applied field than for materials that did not perform so well when ranked by time to breakdown. The significance of this will be discussed in section 5.
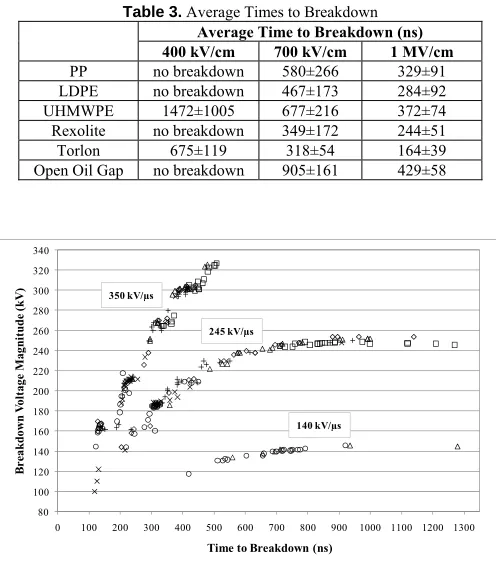
Plotted in Figure 6 are Volt-time (V-t) curves for all materials and the open oil gap under all test conditions. Data where breakdown events occurred after 1.3 µs (for five
breakdown events with an UHMWPE/oil gap at 140 kV/µs) have been omitted from Figure 6. It is clear that the gradient of the curves increases with increasing rate of voltage rise, indicative of the propagation of streamers in faster modes as the rate of voltage rise is increased.
Table 3.Average Times to Breakdown
Average Time to Breakdown (ns)
400 kV/cm 700 kV/cm 1 MV/cm
PP no breakdown 580±266 329±91 LDPE no breakdown 467±173 284±92 UHMWPE 1472±1005 677±216 372±74
Rexolite no breakdown 349±172 244±51
Torlon 675±119 318±54 164±39
Open Oil Gap no breakdown 905±161 429±58
80 100 120 140 160 180 200 220 240 260 280 300 320 340
0 100 200 300 400 500 600 700 800 900 1000 1100 1200 1300
B
rea
kd
ow
n V
ol
tag
e
M
ag
ni
tude (
kV
)
Time to Breakdown (ns)
350 kV/µs
245 kV/µs
140 kV/µs
Figure 6. V-t curves for all materials and open oil gap for all test conditions. Open diamonds: PP; plus signs: LDPE; open triangles: UHMWPE; crosses: Rexolite; open circles: Torlon; open squares: open oil gap.
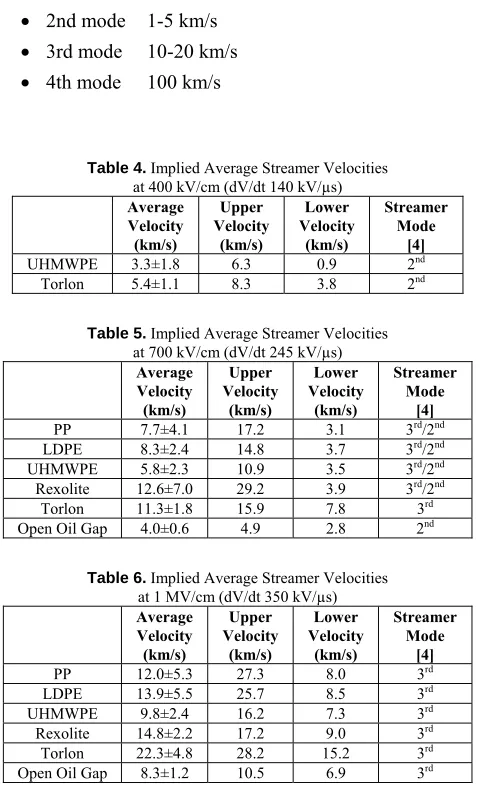
At such short time intervals and high dV/dt, it is reasonable to assume a streamer mechanism of breakdown. Forster and Wong [3] have previously reported on streamers in hydrocarbons under uniform-field conditions, at electric fields 300-500 kV/cm. While the actual velocity of the streamer that propagates to the point of breakdown cannot be accurately stated without imaging of the streamer development, the average streamer velocities, calculated simply by dividing the sample/inter-electrode gap length by the time to breakdown, can provide a minimum implied velocity of streamer propagation, and a basis for comparison with other studies.
[image:4.612.47.303.265.395.2]following average streamer propagation velocities are reported as typical in liquids:
• 1st mode 0.1 km/s
• 2nd mode 1-5 km/s
• 3rd mode 10-20 km/s
[image:5.612.54.295.107.502.2]• 4th mode 100 km/s
Table 4.Implied Average Streamer Velocities at 400 kV/cm (dV/dt 140 kV/µs)
Average Velocity (km/s)
Upper Velocity
(km/s)
Lower Velocity
(km/s)
Streamer Mode
[4]
UHMWPE 3.3±1.8 6.3 0.9 2nd Torlon 5.4±1.1 8.3 3.8 2nd
Table 5.Implied Average Streamer Velocities at 700 kV/cm (dV/dt 245 kV/µs)
Average Velocity (km/s)
Upper Velocity
(km/s)
Lower Velocity
(km/s)
Streamer Mode
[4]
PP 7.7±4.1 17.2 3.1 3rd/2nd LDPE 8.3±2.4 14.8 3.7 3rd/2nd UHMWPE 5.8±2.3 10.9 3.5 3rd/2nd Rexolite 12.6±7.0 29.2 3.9 3rd/2nd Torlon 11.3±1.8 15.9 7.8 3rd Open Oil Gap 4.0±0.6 4.9 2.8 2nd
Table 6.Implied Average Streamer Velocities at 1 MV/cm (dV/dt 350 kV/µs)
Average Velocity (km/s)
Upper Velocity
(km/s)
Lower Velocity
(km/s)
Streamer Mode
[4]
PP 12.0±5.3 27.3 8.0 3rd LDPE 13.9±5.5 25.7 8.5 3rd UHMWPE 9.8±2.4 16.2 7.3 3rd Rexolite 14.8±2.2 17.2 9.0 3rd Torlon 22.3±4.8 28.2 15.2 3rd Open Oil Gap 8.3±1.2 10.5 6.9 3rd
At 140 kV/µs (Table 4), average velocities were in the range 1-8 km/s, indicating mainly 2nd mode streamer
propagation.
With an increase in rate of voltage rise to 245 kV/µs (Table 5), both 2nd and 3rd mode streamers were observed for
all liquid-solid gaps. In the open oil gap however, only 2nd
mode streamers propagated, with upper velocity approaching 5 km/s. The minimum implied velocity for Torlon was at least double that for the other materials, and the data are indicative of mainly 3rd mode streamer propagation. The high upper
velocity for Rexolite in Table 5 corresponds with shot number 19 in Figure 4, where the breakdown voltage had fallen significantly due to considerable surface damage. If the shortest time to breakdown was taken at shot 16 before the breakdown voltage collapsed, then the upper velocity would decrease to 11 km/s.
Further increase in the rate of voltage rise to 350 kV/µs resulted in the propagation of 3rd mode streamers in the main,
with velocities approaching 30 km/s implied. The open oil gap
showed the slowest propagation velocities. Of the five solid dielectrics, UHMWPE again yielded the slowest propagation velocities, and Torlon the fastest.
In the case where Rexolite and Torlon surfaces are subjected to further discharges and damage occurs to the extent that significant material is removed, 4th mode streamers
were also observed, with average propagation velocity ~125 km/s. It appears clear that the propagation of discharges via paths other than the original liquid-solid interface is central to the appearance of faster streamers, resulting in consistently shorter times to breakdown for these materials.
4 STATISTICAL ANALYSIS
A Weibull statistical analysis was conducted on the data recorded at 245 kV/µs and 350 kV/µs. It was found that a 3-parameter Weibull distribution best described the time to breakdown rather than the breakdown voltage data, and hence this analysis is presented here. The cumulative probability of failure is defined by equation 1, where t is the time to breakdown, α is the scale parameter, β is the shape parameter, and γ is the location parameter. Polypropylene and UHMWPE were best described by a 2-parameter Weibull distribution, with a zero-value location parameter, γ, for both rates of voltage rise.
⎥ ⎥ ⎦ ⎤ ⎢
⎢ ⎣ ⎡
⎟ ⎠ ⎞ ⎜ ⎝ ⎛ − − −
= β
α γ
t t
F( ) 1 exp (1)
Displayed in Figure 7 are the 245 kV/µs Weibull plots. The data points for PP, UHMWPE, and the open oil gap show a linear behaviour. The Rexolite and Torlon samples show different straight line regions separated by shoulders, suggesting changing breakdown mechanisms. The shallow gradient for the open oil gap arises due to the high value of γ required to bring the data points onto a straight line – the γ value suggests that breakdown of the open oil gap would not occur before 700 ns. The other non-zero γ values were 230 ns for LDPE and 210 ns for Torlon.
-4 -3 -2 -1 0 1 2
2 3 4 5 6
ln
(
U
n
re
lia
bilit
y)
ln (Time to Breakdown)
[image:6.612.47.300.52.307.2]7 PP LDPE UHMWPE Rexolite Torlon Open Oil Gap
Figure 7.Weibull plots of time to breakdown data for peak applied field 700 kV/cm (dV/dt 245 kV/µs).
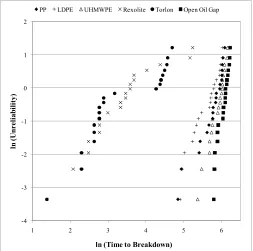
-4 -3 -2 -1 0 1 2
1 2 3 4 5 6
ln
(
U
n
re
lia
bilit
y)
ln (Time to Breakdown)
PP LDPE UHMWPE Rexolite Torlon Open Oil Gap
Figure 8.Weibull plots of time to breakdown data for peak applied field 1 MV/cm (dV/dt 350 kV/µs).
5 DISCUSSION
The impulse breakdown characteristics of liquid-solid gaps between plane-parallel electrodes have been investigated when subjected to four different levels of peak electrical field. The breakdown voltages associated with open oil gaps were generally higher than those for liquid-solid gaps. Katahoire et
al. [5] found that the breakdown strength of a silicone oil/XLPE interface was reduced compared to that of an open silicone oil gap when subjected to positive-polarity lightning impulses (1.2/50 µs). The breakdown strength of the interface decreased from 500 kV/cm for a 2.5 mm gap to 350 kV/cm for a 7.5 mm gap, compared with respective values of 540 kV/cm and 380 kV/cm for the open oil gap.
It was found that 200 kV/cm, with dV/dt of 70 kV/µs, could be applied to an open oil gap and liquid-solid gaps 20 times without resulting in surface flashover or other breakdown events. For the open oil gap, and for gaps bridged with materials of permittivity close to that of the surrounding mineral oil – namely PP, LDPE, and Rexolite – an electrical field of 400 kV/cm, with dV/dt of 140 kV/µs, could also be applied 20 times without inducing breakdown events.
At higher field levels of 700 kV/cm (245 kV/µs) and 1 MV/cm (350 kV/µs), all 20 applied impulse voltages resulted in a breakdown event for all five materials, and for the open oil gap. Although UHMWPE showed the longest average times to breakdown (and hence highest breakdown voltages) at 700 kV/cm and 1 MV/cm, breakdown events consistent with slower streamer propagation modes could be initiated at lower applied fields with samples of higher permittivity, namely UHMWPE and Torlon.
For the field levels tested, the probability of breakdown over 20 applied impulses was usually either 0 or 1. The only test where this was not the case was with an UHMWPE sample at 400 kV/cm (140 kV/µs), where the probability of breakdown was 0.55. In this test, a breakdown event did not always occur after the first breakdown event, and the sequence was: no breakdown for shots 1-7; breakdown for shots 8-13; no breakdown for shots 14-15; and breakdown following shots 16-20. So even though the sample surface was damaged by each breakdown event, application of the same electric field did not always result in breakdown in subsequent shots.
In terms of the breakdown mechanism, the image charge theory described in [1] appears to be corroborated by the results, insofar as the gaps with solids of higher permittivity are broken down at lower voltages than those with solids of permittivity closer to that of the oil – this result was also found by the authors of [6] under non-uniform field geometry. Similar concepts are explored for ac voltages in [7], where the authors propose two different breakdown mechanisms for an oil-pressboard interface: the first is the electric double layer at the liquid-solid interface, where space charge can drift due to the applied electric field and cause tracking; and the second is the oil boundary layer, associated with high-energy flashover.
[image:6.612.47.300.355.606.2]and seed oils of permittivity around 3.0 [8], and ester fluids of permittivity around 3.2 [4]. A study of the breakdown characteristics of such composite insulation systems would provide interesting future work.
Devins and Rzad [9] found that streamer velocities in oil gaps with a PMMA spacer were very similar to those in open oil gaps under point-plane geometries. The average streamer velocities calculated for liquid-solid gaps in the present paper are comparable to those presented in [4] for point-plane gaps in mineral oil. A transition from slow streamers of velocity 3.6 km/s to fast streamers of velocity 17 km/s was observed in [9] under point-plane geometry in oil, with the transition occurring for impulses of 1.2 µs rise-time, but not for impulses of rise-time 4 µs.
Wang et al. [10] applied shorter impulses, of duration ~40 ns, to cylindrical samples of PMMA in uniform fields in insulating oil, and found that the breakdown field associated with surface discharges increased from 450 kV/cm to 700 kV/cm when the rate of voltage rise was raised from 11 kV/ns to 22 kV/ns. With maximum sample length of 4 mm, 4th mode streamer propagation (average propagation velocity
at least 100 km/s) can be assumed even for the slowest rate of voltage rise investigated in [10] – it appears that as the breakdown mechanism was essentially the same for all tested conditions, significantly higher breakdown voltages could be achieved at faster rates of voltage rise. In the present study, the measured breakdown voltages were higher with increasing dV/dt and level of peak applied field.
By modeling streamers as spheres or cylinders, Massala and Lesaint [11] calculated electric fields associated with streamers in mineral oil, and identified a threshold streamer field ~400 kV/cm that defines propagation mode: streamers propagate in the slow 2nd mode if the streamer field is below
400 kV/cm, and in fast 3rd or 4th modes if the field is above
this threshold. When considering the average electrical field across the gap, as has been done in the present paper, the results are broadly in agreement with this threshold streamer field level, although 2nd mode streamer propagation was
identified for the open oil gap at peak applied field 700 kV/cm.
6 CONCLUSION
For the dielectric materials tested, the introduction of a solid spacer between plane-parallel electrodes caused a reduction in the delay times to breakdown compared to those associated with an open oil gap. Higher breakdown voltages were observed with increasing rate of voltage rise and level of peak applied field.
In terms of conservative design safety margins, it was found that 200 kV/cm (dV/dt 70 kV/µs) could be applied to a 3.5-mm open oil gap, and to gaps bridged by 3.5-mm long cylindrical samples of all materials, 20 times without resulting in breakdown for the 1/6.5 μs wave-shape.
Rexolite and Torlon are poor choices to act as oil-immersed insulators for the conditions investigated. Gaps bridged by these materials facilitate the propagation of streamers in faster modes, reducing the pre-breakdown delay times and hence the
breakdown voltages. The combined effects of bulk solid discharges as well as surface breakdown events act to remove large parts of material from the discharge sites, and this could lead to mechanical instability if undiscovered in large-scale industrial machines which are fully immersed in insulating oil.
While UHMWPE yielded longer times to breakdown than the other materials, the high permittivity means that this material is not ideally suited for use in mineral oils with permittivity around 2.2.
Considering both the minimum applied field required to initiate breakdown events and the times to breakdown, gaps with PP and LDPE spacers – that is, the materials with permittivity closely matched to that of the surrounding mineral oil – give the closest performance to that of the open oil gap. These materials are therefore recommended as most appropriate for use as mechanical supports in mineral-oil immersed high-voltage systems, operating with similar voltage wave-shapes and levels of applied field to those reported herein.
ACKNOWLEDGMENT
M. P. W. gratefully acknowledges financial support of the study from AWE Aldermaston.
REFERENCES
[1] S. M. Korobeynikov, A. V. Melekhov, G. G. Furin, V. P. Charalambakos, and D. P. Agoris, “Mechanism of surface charge creation due to image forces,” J. Phys. D: Appl. Phys., vol. 35, pp. 1193-1196, 2002.
[2] M. P. Wilson, S. J. MacGregor, M. J. Given, I. V. Timoshkin, M. A. Sinclair, K. J. Thomas, and J. M. Lehr, “Surface flashover of oil-immersed dielectric materials in uniform and non-uniform fields,” IEEE Trans. Dielectr. Electr. Insul., vol. 16 (4), pp. 1028-1036, 2009. [3] E. O. Forster, and P. Wong, “High speed laser Schlieren studies of
electrical breakdown in liquid hydrocarbons,” IEEE Trans. Electr. Insul., vol. EI-12 (6), pp. 435-442, 1977.
[4] R. Liu, C. Tornkvist, V. Chandramouli, O. Girlanda, and L. A. A. Pettersson, “Ester fluids as alternative for mineral oil: The difference in streamer velocity and LI breakdown voltage,” Conference Report: Conference on Electrical Insulation and Dielectric Phenomena, pp. 543-548, 2009.
[5] A. M. S. Katahoire, M. R. Raghuveer, and E. Kuffel, “Power frequency and impulse voltage breakdown along silicone oil/XLPE interface,” IEEE Trans. Electr. Insul., vol. EI-15 (2), pp. 97-104, 1980.
[6] M. Krins, H. Borsi, and E. Gockenbach, “Impact of carbon particles on the impulse flashover behaviour of different solid/liquid interfaces in a non-uniform field,” in proc. 1998 International Symposium on Electrical Insulating Materials, pp. 363-368, 1998.
[7] P. M. Mitchinson, P. L. Lewin, B. D. Strawbridge, and P. Jarman, “Tracking and surface discharge at the oil-pressboard interface,” IEEE Electr. Insul. Mag., vol. 26 (2), pp. 35-41, 2010.
[8] E. A. Al-Ammar, “Evaluation of seed oils based on statistical breakdown data for their application as insulating fluids in distribution transformers,” European Journal of Scientific Research, vol. 40 (1), pp. 15-26, 2010.
[9] J. C. Devins and S. J. Rzad, “Streamer propagation in liquids and over liquid-solid interfaces,” IEEE Trans. Electr. Insul., vol. EI-17 (6), pp. 512-516, 1982.
[10] J. Wang, Y.X. Zhou, P. Yan, W.L. Huang, G.J. Li, S.C. Zhang and G.S. Sun, “Study on dielectric surface discharge in transformer oil under high voltage nanosecond pulse,” J. Electrostatics, vol. 63, pp. 665-671, 2005. [11] G. Massala, and O. Lesaint, “Positive streamer propagation in large oil
namic simulation.
er of the IET oP.
f the IEEE Nuclear and Plasma Sciences Society.
Mark P. Wilson (M’10) was born in Stranraer,
Scotland, in 1982. He received the B.Eng. (with honours) and M.Phil degrees in electronic and electrical engineering from the University of Strathclyde, Glasgow, U.K., in 2004 and 2007, respectively, where he is currently working toward the Ph.D. degree, working on a project to analyze the surface breakdown properties of dielectric materials immersed in insulating oil. He is a member of the IET.
Igor V. Timoshkin (M’07) received the degree in
physics from the Moscow State University (Russia) in 1992, and the Diploma and the Ph.D. degree from the Imperial College of Science, Technology and Medicine, (London, UK) in 2001. After graduation from MSU he worked as a Researcher at Moscow State Agro-Engineering University, and then at the Institute for High Temperatures of Russian Academy of Sciences before moving to ICSTM in 1997. He joined the Department of Electronic and Electrical Engineering of the University of Strathclyde (Glasgow, UK) in 2001 as an Academic Visitor, where he became a Research Fellow in 2002 and a Lecturer in 2006. His research interests include properties of solid and liquid dielectric materials, electronics of plasma discharges in condensed media, practical applications of electro-hydraulic and high-power ultrasound pulses, bio-dielectrics and effects of electromagnetic fields on biological objects.
Martin J. Given (M’99) is currently a Senior
Lecturer in the Department of Electronic and Electrical Engineering at the University of Strathclyde. He received a degree in physics from the University of Sussex in 1981 and a PhD in electronic and electrical engineering from the University of Strathclyde in 1996. His research interests include, ageing processes and condition monitoring in solid and liquid insulation systems, high speed switching and pulse power applications.
Scott J. MacGregor (M’95) received the B.Sc. and
Ph.D. degrees from the University of Strathclyde, Glasgow, U.K., in 1982 and 1986, respectively. He is currently with the University of Strathclyde, where he
became a Pulsed-Power Research Fellow in 1986, a Lecturer in pulsed-power technology in 1989, a Senior Lecturer in 1994, and a Reader and a Professor of high-voltage engineering in 1999 and 2001, respectively. He has been Dean of Engineering at the University of Strathclyde since January 2010. His research interests include high-voltage pulse generation, high-frequency diagnostics, high-power repetitive switching, high-speed switching, electronic methods for food pasteurization and sterilization, generation of high-power ultrasound (HPU), plasma channel drilling, pulsed-plasma cleaning of pipes, and stimulation of oil wells with HPU.
Mark Sinclair (M’03) received the B.Sc. degree
from the Victoria University of Manchester, UK, in 1990 and then went to St. Andrews and Strathclyde Universities in Scotland to receive an MSc in Laser Engineering and Pulsed Power Technology. In 1992 he joined the Pulsed Power Group at AWE. Initially he worked on the E Minor machine moving on to Mogul E which was optimised for radiography of dense objects. Currently he is the technical lead and Team Leader for Pulsed Power at AWE running a number of programmes to develop fundamental knowledge and skills, to develop new x-ray sources and to use Pulsed Power for Hydrody
Kenneth J. Thomas (M’05) was born in Carmarthen,
South Wales in 1958. He received the B.Sc degree in physics from Imperial College, London in 1979. He completed the Ph.D. degree in Laser Physics, also at Imperial College, in 1983 and joined the Pulsed Power Group at AWE. Since then he has been involved in the design and construction of multi-MegaVolt pulsed power machines for flash radiography and supporting research, particularly the application of Induction Voltage Adder technology to the next generation of accelerators. He is a C. Phys. and a memb
and I
Jane Lehr (S’91-M’96-SM’02-F’08) received the