Adaptive Range Control Scheme to Improve QoS
for WSNs
Vivek Deshpande, Vladimir Poulkov, Dattatray Waghole
Abstract:T InT wirelessT sensorT networksT (WSNs),T economicalT
powerT utilizationT isT crucialT analysisT drawbackT sinceT fromT
lastT twentyT years.T TheT WSNsT areT clusterT ofT energyT strainedT andT littleT sensingT elementT nodes.T SinceT fromT theT emergeT ofT WSNT mechanism,T researchersT conferredT numerousT waysT toT
enhanceT theT networkT periodT ofT timeT supportedT completelyT
differentT layersT likeT routingT protocol,T macT (MediumT AccessT
Control)T protocolsT etc.T exceptT forT thisT theT transmissionT
rangeT parameterT thatT isT byT defaultT fixedT inT WSNsT alsoT canT facilitateT toT reduceT theT overallT powerT consumption.T InT thisT
paper,T weT proposedT AdaptivelyT TransmissionT RangeT &T
MinimizationT ofT EnergyT (ATREM)T algorithmT utilizationT ofT
theT energyT resourcesT soT asT toT extendT theT networkT periodT ofT timeT ofT WSNs.T TheT plannedT algorithmT designedT toT estimateT theT minimumT transmissionT powerT forT currentT linkT forT dataT
transmissions.T InT ATREM,T theT transmissionT rangeT isT
computedT atT everyT intervalT forT everyT sensingT nodeT andT thusT theT transmissionT rangeT ofT eachT sensingT nodeT isT completelyT
differentT becauseT itT isT computedT basedT onT theT 30T nodesT
networkT topology.T WeT haveT aT tendencyT toT exploitedT theT
networkT connectionT parameterT forT dynamicallyT adjustT theT
transmissionT rangeT ofT sensingT nodes.T TheT simulationT resultsT
showsT thatT proposedT solutionT minimizingT theT energyT
consumptionsT andT improvementT ofT theT networkT QoST
(QualityT ofT Service)T performances.
Keywords:T AdaptiveT powerT control,T EnergyT consumption,T
NetworkT lifetime,T QoS,T TransmissionT Range,T SensorT nodes.
I. INTRODUCTION
AT wirelessT sensorT networkT (WSN)T containsT ofT littleT andT
smartT sensorT nodesT thatT behavesT collaborativelyT toT
observeT theT targetT settingT [1].T EveryT sensorT nodeT
containsT aT Sensor,T Processor,T communicationT RadioT andT
inbuiltT battery.T TheseT nodesT areT havingT resourceT
constrainedT inT termsT ofT processT powerT andT batteryT
capabilityT [2].T WSNT measuresT theT physicalT andT
environmentalT conditionsT likeT pollutionT levels,T
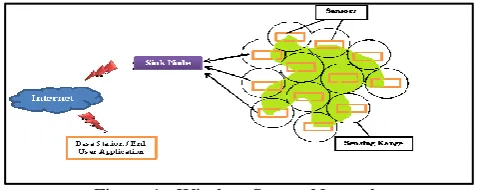
temperature,T sound,T etc.T TheT figureT 1T showsT theT
instanceT ofT WSN.T TheT mainT activityT ofT theT anyT sensingT
nodeT isT toT consumeT minimumT powerT byT theT system.T
RadioT systemT typicallyT needsT greatT amountT ofT powerT
[3].T ThereforeT it'sT theT benefitsT toT sendT dataT usingT theT
network,T weT needed.T TheseT sensorT networksT alsoT
supportT eventT drivenT dataT gatheration.
T
Revised Manuscript Received on May 22, 2019. Vivek Deshpande, Vladimir Poulkov, Dattatray Waghole
Technical University of Sofia, Bulgaria,Vishwakarma Institute of Technology, India,[email protected] College Of Engineering, India.
It needs protocol for data to be forwarded [4]. Sensors should be consumes optimum power its important [5]. WSNs have been deployed in a wide range of civil applications as sensors become more powerful, smaller and cheaper. The major drawback of a sensor is its resource scarcity or constraint. Transmission of packets at a full power capacity may guarantee successful data delivery. But it may cause a rapid decay in battery power level.
DevelopingT genericT powerT preservationT schemesT isT
thereforeT challenging.T ThereT areT severalT studiesT
dedicatedT toT prolongingT sensorT lifetime.T ControllingT
transmissionT rangeT accordingT toT linkT qualityT isT anT
efficientT approachT asT itT providesT theT optimumT powerT
requiredT toT maintainT aT healthyT linkT atT aT specificT linkT
[image:1.595.309.548.364.459.2]quality.
Figure 1: Wireless Sensor Network
Now-a-day’sT wirelessT transmittersT andT receiversT forT
wirelessT nodesT intoT theT marketT thatT areT moreT
cost-effective,T reducedT inT size,T lessT powerT consumptionT andT
alsoT smallerT inT antennaT sizeT [5].T RecentT sensor-nodesT
havingT smartT batteryT backupT andT theseT batteryT backupsT
areT reversibleT fromT system.T ForT theT WSNT observanceT
thereT areT 3T sensorT nodesT theseT areT theT sensorT nodes,T
wearableT dataT acquisitionT andT processT hardwareT andT
remoteT monitorT stationT areT used.T TheT sensorsT areT
responsibleT toT monitorT physicalT atmosphereT andT
generatesT alertT concerningT prohibitedT activitiesT toT theT
customerT [6].T WithinT theT networkT severalT sensorsT areT
placed,T TheseT batteriesT areT rechargeableT automaticallyT
usingT solarT system.T TheseT sensorsT smallT inT sizeT andT
cheapT andT thoseT weT willT simplyT placeT withinT theT
networkT field.T [7]T ItT shouldT causeT entireT networkT failureT
additionally.T ThereforeT minimizeT theT energyT utilizationT
/consumptionT ofT sensorT nodesT isT wideT studiedT analysisT
drawback.T TheT nodesT ofT wireless-sensor-networksT haveT
limitedT energyT andT itT isT difficultT toT replaceT batteryT ofT
sensorT nodeT everyT time.T So,T theT energyT efficiencyT isT aT
veryT importantT andT veryT muchT importantT parameterT inT
wirelessT sensorT network.
InT literature,T theT
researchersT areT takingT
effortsT toT optimizeT
lifeT timeT usingT theT assortedT energyT awareT waysT thatT useT
transmitterT ofT sensorT nodesT inT anT efficientT mannerT
[6]-[14].T EnergyT controlT ofT TransmissionT aimsT toT scaleT backT
theT totalT transmissionT powerT ofT aT wireless-networkT byT
adjustingT theT sendingT powerT atT eachT sensorT node.T TheT
energyT efficiencyT mayT beT achievedT usingT theT dynamicT
assignmentT ofT transmissionT rangeT forT everyT sensorT nodeT
ratherT thanT keptT fixed.T InT thisT paper,T weT plannedT theT
algorithmT toT performT theT adaptiveT computationT ofT
transmissionT powerT levelT forT everyT sensorT nodeT
supportedT theT currentT networkT topologyT knownT asT
ATREM.T InT sectionT III,T theT proposedT algorithmT
presented.T InT sectionT IV,T theT simulationT resultsT areT
explained.T AndT finallyT inT sectionT V,T conclusionT andT
futureT workT isT presented.T
II.RELATED WORKS
There are number of strategies given for energy efficiency in WSNs supported completely different parameters. This section presents the related works based on transmission range parameter for the network life improvement.
InT [6],T authorT introducedT theT adaptiveT TransmissionT
PowerT managementT (ATPC)T methodologyT usesT twoT
phases:T firstT isT initializationT andT secondT isT run-timeT
standardizationT phase.T WithinT theT 1stT phase,T initiallyT
energyT levelsT areT tunedT whereasT theseT powerT levelsT areT
tunedT inT consistentT withT currentT scenarioT ofT theT networkT
withinT theT nextT phase.T HoweverT ATPCT isT intendedT onlyT
forT theT scenariosT whereT collisionT ofT packetsT andT
congestionT willT happenT soT frequently.
InT [7],T realT timeT PowerT AwareT RoutingT (RPAR)T wasT
proposed.T TheT mainT objectiveT ofT thisT methodologyT wasT
toT routeT theT dataT packetsT andT so,T theT mainT focusT isT onT
reducingT end-to-endT delay.T RPART achievesT thisT byT
runtimeT adjustingT energyT andT routingT selectionsT basedT
onT packetT delayT deadlines.T InT addition,T RPART addressesT
necessaryT sensibleT issuesT inT WirelessT sensorT networks,T
includingT scalability,T lossyT links,T severeT memoryT &T
informationT measureT constraints.T ButT authorT assumeT thatT
everyT nodeT willT regulateT itsT transmissionT energyT andT isT
awareT ofT itsT locationT viaT GlobalT PositioningT SystemT orT
differentT localizationT services.
In [8], author proposed dynamic transmission power control methodology to achieve the trade-off between the QoS performance and energy efficiency. The transmission power is dynamically adjusted based on network connectivity.
InT [9],T anotherT methodT proposedT thatT considerT
transmissionT energyT improvementT inT WSNsT whenT
packetsT areT gatheredT byT receiverT whichT isT mobileT inT
nature.T ThisT data-collectorT isT dedicatedT forT collectingT
dataT packetsT byT selectingT theT optimizeT routeT thatT
minimizesT theT overallT transmitT energyT ofT theT nodesT
subjectT toT aT maxT pathT delayT constraint.
In [10], Michele Chincoli et.al investigated how artificial intelligence and machine learning is used to bring nodes to the lowest possible sending power level and, also, to respect the requirements of the overall network standardization. Lowering power has positive advantages in terms of both energy utilization and interference. The recent methodology proposed for transmission power control using a re-enforcement learning that set in a multi agent system. Similar level of works reported in [11]-[15].
In this paper we focused on designing the light weight algorithm together with AODV (Ad hoc On-Demand Distance Vector) in order to adaptively compute the transmission range of each sensor node based on the network connectivity in order to attain the trade-off between QoS and energy efficiency performances for WSNs. [16]-[21]
III.PROPOSED METHODOLOGY
AsT mentionedT earlierT sections,T dynamicalT theT
transmissionT powerT manuallyT couldT leadsT toT variousT
effectsT onT QoST andT energyT performancesT ofT WSNsT likeT
increasingT theT transmissionT powerT resultsT toT interferenceT
inT networkT andT decreasingT couldT resultT toT longerT delay.T
InT thisT paper,T weT focusedT onT adaptivelyT chooseT theT
transmissionT varyT toT regulateT theT transmissionT powerT ofT
everyT deviceT nodesT inT networkT supportedT thisT networkT
topology.T TheT proposedT ATREMT protocolT isT includeT 2T
sectionsT likeT adaptiveT powerT controlT andT transmissionT
phase.T TheT adaptiveT controlT ofT transmissionT powerT helpsT
toT enhanceT theT networkT lifespanT significantlyT asT
comparedT toT state-of-artT methods.T InT adaptiveT powerT
controlT section,T sinceT afterT theT networkT deploymentT weT
exploitT theT connectionT operateT toT computeT theT
transmissionT rangeT forT everyT sensorT nodeT inT network.T
TheT adjustmentT ofT powerT levelT inT 1stT section,T secondT
sectionT isT responsibleT toT findT theT shortestT energyT
efficientT pathT toT performT dataT aggregationT andT
transmissionT fromT sensorT nodesT toT sinkT node.
InT TransmissionT rangeT controlT methodology,T theT
extraT savedT orT harvested-energyT isT utilizedT toT extendT theT
sendingT rangeT andT incurT inT reductionT withinT theT numberT
ofT packetT travelT hops.T AsT aT result,T networkT willT
minimizeT theT overallT energyT utilizedT byT traceT passingT
nodes.T ThisT methodologyT isT speciallyT usefulT inT
preventingT trafficT aggregationT onT theT nodesT nearT theT
sinkT node.T Generally,T theT nodesT closeT toT theT sinkT nodeT
needT toT transmitT aT largerT amountT ofT dataT packetsT thanT
otherT nodes,T soT increasingT theT probabilityT ofT dyingT
earlier.T AsT aT stateT ofT dyingT leadsT toT theT consecutiveT
blackoutT ofT neighboringT nodes,T alsoT asT aT fastT decreaseT
withinT theT knowledgeT rate,T loadT balancingT onT nodesT
mustT beT prevented.T ByT increasingT theT sendingT range,T inT
thisT methodology,T dataT tendsT toT beT directlyT sentT toT theT
sinkT nodeT insteadT ofT traceT passT throughT intermediateT
hoppingT nodes.T However,T TheT algorithmT oneT presentsT
theT workingT ofT proposedT methodology.
Algorithm: Adaptive Power Control
Input:
S: sensor node
Sink: Sink node
step 1. At each interval DO
step 2. S computes all its current neighbor nodes
in nb
step 3. S broadcasts beacon messages nb
step 4. Each
neighbor t upon
receiving beacon
- ACK packet tack
- Number of its neighbor tnb
step 5. S computes the mean of its transmission
power level using all neighbor outcomes tack and tnb
using Eq. [1]
step 6. 𝐌𝐒= 𝐭 𝐢 𝐧𝐛 / 𝐧 𝒏
𝒌=𝟏 ….[1]
step 7. Select the transmission range i.e.
transmission power according to value of MS
step 8. Node S operates accordingly newly assigned transmission power until next interval of TDMA.
step 9. While (STOP)
step 10. Assigning the weight to each node
starting from Sink node increasing order (0 for
sink)
AsT shownT inT aboveT algorithmicT approach,T everyT
sensorT nodeT computeT itsT ownT transmissionT powerT inT
keptT withT theT presentT networkT connectivityT atT eachT
intervalT inT whichT meanT ofT nodesT connectivityT computedT
andT inT keptT withT theT transmissionT powerT allocatedT toT
currentT sensorT node.T Further,T theT weightT isT allottedT toT
eachT sensorT nodeT inT keptT withT itsT distanceT fromT theT
sinkT nodeT inT increasingT order.T InT 2ndT Section,T TheT
transmissionT rangeT initiatedT byT sourceT aT nodeT thatT
forwardsT theT collectedT on-fieldT dataT throughT theT
neighboursT withT leastT costT toT enhanceT theT QoST
performance.
IV.PERFORMANCE ANALYSIS
WeT designedT WirelessT SensorT NetworkT (WSN)T withT
thirtyT nodesT randomlyT distributedT inT areaT ofT 1000T *T
1000T meter.T OneT ofT themT isT sinkT (collector)T node,T andT
lastT fiveT nodesT areT tiedT upT withT UDPT agent,T whichT
generatesT traffic.T OtherT restT ofT nodesT isT onlyT forwardingT
nodes.T KeepingT packetT sizeT isT 50T BytesT andT reportingT
rateT 10T packet/sec.T assumingT thatT theT WSNT isT static.T ItT
usesT routingT Ad-hocT OnT DemandT Vector(AODV)T
protocolT andT 802.11(MAC)T asT layerT twoT protocols.T TheT
performanceT analysisT ofT proposedT methodologyT isT
performedT againstT theT existingT fixedT transmissionT rangesT
methodT usingT theT NS2.T WeT varyT theT transmissionT rangeT
fromT 100T toT 350T meterT inT orderT toT seeT theT proposedT
methodologyT performanceT inT whichT 5T sensorT nodesT
sendsT theT dataT toT 1T sinkT node.T WeT measuredT
performanceT inT termsT ofT 4T metricsT likeT averageT
throughput,T packetT deliveryT rate,T andT delayT andT energyT
[image:3.595.319.551.103.209.2]consumption.T
Figure 2: Packet Delivery Ratio as perform of Transmission Range
PacketT DeliveryT RatioT (PDR)T performanceT
againstT transmissionT rangeT isT shownT inT figureT 2.T AsT theT
sendingT rangeT atT theT sensorT nodeT willT increaseT
interferenceT withinT theT network.
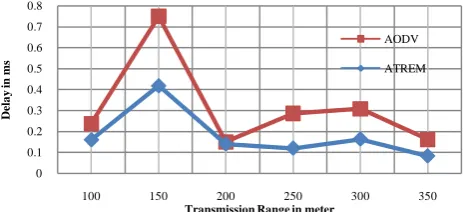
Figure 3: E-E Delay as perform of Transmission Range
AsT shownT inT figureT 3,T DelayT asT performT ofT
sendingT rangeT byT node,T theT delayT increasesT
exponentiallyT dueT toT increaseT inT interferenceT resultsT intoT
congestion.T HenceT congestionT increasesT numberT ofT
retransmission.T DueT toT congestionT andT retransmissionT
[image:3.595.313.552.318.419.2]theT delayT inT theT networkT increases.
Figure 4: Node Throughput as perform of Transmission Range
FigureT 4T showsT ThroughputT asT performT ofT
sendingT range.T TheseT threeT figuresT areT representingT QoST
performanceT evaluation.T InT bothT cases,T theT transmissionT
rangeT initiallyT setT toT 100T toT 350T meter.T InT existingT case,T
[image:3.595.311.552.522.632.2]theT valuesT areT fixedT throughoutT theT completeT simulation.
Figure 5: Average Energy Consumption as perform of Transmission Range
AverageT EnergyT ConsumptionT asT aT performT ofT
sendingT rangeT isT depictedT inT figureT 5.T ThisT figureT showsT
theT energyT efficiencyT performanceT analysisT withT
transmissionT range.T TheT energyT consumptionT isT constantT
forT variousT transmissionT ranges.T AsT theT nodeT densityT ofT
theT networkT isT dense,T thereforeT theT averageT energyT
consumptionT isT alsoT less.T DueT toT adaptiveT transmissionT
powerT control,T theT
proposedT methodologyT
achievedT theT stableT andT
improvedT resultsT inT allT
0 20 40 60 80 100 120
100 150 200 250 300 350
P
a
ck
et
De
li
v
er
y
Ra
tio
in
P
er
ce
n
ta
eg
e
(%)
Transmission Range in meter
AODV
ATREM
0 0.1 0.2 0.3 0.4 0.5 0.6 0.7 0.8
100 150 200 250 300 350
De
la
y
in
m
s
Transmission Range in meter
AODV
ATREM
0 50 100 150 200 250 300 350 400
100 150 200 250 300 350
T
h
ro
u
g
h
p
u
t
in
K
b
p
s
Transmission Range in meter
AODV ATREM
0 0.02 0.04 0.06 0.08 0.1 0.12 0.14 0.16 0.18
100 150 200 250 300 350
E
n
er
g
y
Co
n
su
m
p
tio
n
in
m
jo
ule
Transmission Range in meter
[image:3.595.52.291.636.737.2]casesT asT comparedT toT existingT fixedT transmissionT rangeT
approach.T
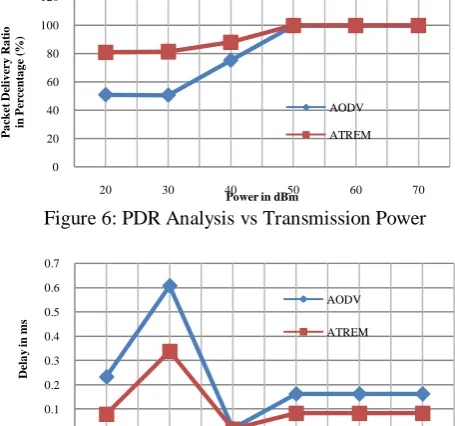
Similarly,T weT haveT designedT theT networksT withT
varyingT transmissionT powerT fromT 20T dBmT toT 70T dBmT
forT bothT fixedT andT dynamicT scenarios.T FigureT 6,T 7,T andT
8T representsT QoST performanceT evaluationT withT respectT
toT transmissionT powerT andT figureT 9T representT theT energyT
efficiencyT performanceT analysisT withT respectT toT
transmissionT power.T TheT outcomesT areT discussedT graphs.T
TheT AdaptiveT PowerT ControlT AlgorithmT proposedT toT
increaseT theT QoST parameterT andT consumeT lessT energyT inT
theT WSN.T WhereasT inT proposedT case,T theT transmissionT
powerT isT dynamicallyT allottedT toT eachT sensorT nodesT thisT
notT onlyT helpsT toT enhanceT theT energyT efficiencyT butT
[image:4.595.53.278.235.339.2]alsoT improvesT theT QoST performance.T
[image:4.595.50.278.239.452.2]Figure 6: PDR Analysis vs Transmission Power
Figure 7: Average Delay Analysis vs Transmission Power
Figure 8: Average Throughput Analysis vs Transmission Power
Figure 9: Average Energy utilization verses Transmission Power
FigureT 9T showsT AverageT EnergyT ConsumptionT withT
respectT toT TransmissionT Power.T TheT totalT ofT energyT
utilizedT forT dataT transmissionT inT normalT power-controlT
schemesT areT comparedT toT seeT theT resultT ofT sendingT
power-controlT onT energyT consumption.
TheT resultT showsT thatT afterT 50T dBmT transmissionT
power,T theT resultsT areT constantT forT bothT existingT andT
proposedT methods.T TheT resultsT satisfyT theT objectiveT ofT
proposedT ATREMT techniqueT forT WSNs.T
V.CONCLUSION &FUTURE SCOPE
This paper, first outlined the problems of fixed transmission power for WSNs, and then discussed the recent solutions to mitigate the dynamic transmission-power-control. We proposed the adaptive transmission range power control for WSNs in order to improve the QoS and energy efficiency performance. The transmission power is extremely crucial part of wireless sensor network. It affects all the quality of service parameter. At first it favors the sensor network and once certain threshold it affects the sensor network negatively. Therefore it's important to set appropriate transmission power. PDR as a perform of sending range and control overheads as a perform of sending range we'll conclude that the performance of the sensor network at the initial part is good. However as transmission range will increase once 100m performance of the network goes down with respect to packet delivery ratio, delay, jitter, and throughput. The algorithm is based on computation of neighbor nodes connectivity. The mean value is computed to perform the adaptive power control for each sensor node in network. The simulation result reveals the efficiency of proposed algorithm. So, controlling sending range & transmission power is a crucial parameter in sensor network.
For future work, we suggest working on various network scenarios and conditions. We’ll extend the lifespan analysis into energy harvest WSNs. Since sensor nodes are provided by random renewable energy, it's very difficult to analyze and optimize the network lifespan under the continuous and unstable energy offer. The QoS factors will allow us to analyze the healthiness of networks, optimize their tunings, and to design more energy efficient applications.
REFERENCES
[1] N.T M.T Khan,T Z.T Khalid,T G.T Ahmed,T andT M.T Yasin,T “AT robustT routingT strategyT forT wirelessT sensorT networks,”T inT Proc.T IEEET InternationalT ConferenceT onT ElectricalT Engg.T (ICEE),T Lahore,T Pakistan,T AprilT 2007,T pp.T 1–5.
[2] M.T D.T F.T C.T Alippi,T G.T AnastasiT andT M.T Roveri,T “EnergyT managementT inT wirelessT sensorT networksT withT energy-hungryT sensors,”T IEEET Instru-T mentationT andT MeasurementT Magazine,T 2009.
[3] Cagalj,T M.,T Hubaux,T J.-P.,T &T Enz,T C.T C.T (2005).T “Energy-efficientT broadcastingT inT all-wirelessT networks”.T WirelessT Networks,T 11(1/2),T 177–188.
[4] Polastre,T J.,T Szewczyk,T R.,T &T Culler,T D.T (2005).T Telos:T EnablingT ultra-lowT powerT wirelessT research.T InT ProceedingsT ofT internationalT symposiumT onT informationT processingT inT sensorT networksT (pp.T 364–369).
[5] Chen,T Y.T P.,T Wang,T D.,&T Zhang,T J.T (2006).T Variable-baseT tacitcommunication:T aT newT energyT efficientT communicationT schemeT forT sensorT networks.T IEEE.
[6] S.T Lin,T J.T Zhang,T G.T Zhou,T L.T Gu,T J.T A.T Stankovic,T andT T.T He,T “Atpc:T adaptiveT transmissionT powerT controlT
0 20 40 60 80 100 120
20 30 40 50 60 70
P
a
ck
et
De
li
v
er
y
Ra
tio
in
P
er
ce
n
ta
g
e
(%)
Power in dBm AODV
ATREM
0 0.1 0.2 0.3 0.4 0.5 0.6 0.7
20 30 40 50 60 70
De
la
y
in
m
s
Power in dBm AODV
ATREM
0 50 100 150 200 250 300 350 400
20 30 40 50 60 70
T
h
ro
u
g
h
p
u
t
in
K
b
p
s
Power in dBm AODV
ATREM
0 0.02 0.04 0.06 0.08 0.1 0.12 0.14 0.16 0.18
20 30 40 50 60 70
E
n
er
g
y
Co
n
su
m
p
tio
n
in
m
jo
u
le
Power in dBm
AODV
[image:4.595.283.545.577.831.2]forT wirelessT sensorT networks,”T inT Proc.T ACMT Sensys.T Boulder,T Colorado:T ACM,T NovemberT 2006.
[7] O.T Chipara,T Z.T He,T G.T Xing,T Q.T Chen,T X.T Wang,T C.T Lu,T J.T Stankovic,T andT T.T Abdelzaher,T “Real-timeT powerT awareT routingT inT wirelessT sensorT networks,”T Tech.T Rep.T WUSEAS-2005-31,T JulyT 2005.
[8] GhufranT AhmedT ,T NoorT MT KhanT ,T MirzaT MT YasirT Masood,T “AT DynamicT TransmissionT PowerT ControlT RoutingT ProtocolT toT AvoidT NetworkT PartitioningT inT WirelessT SensorT Networks”,T 2011T InternationalT ConferenceT onT InformationT andT CommunicationT Technologies.
[9] DeliaT Ciullo;T GunerT D.T Celik;T EytanT Modiano,T “MinimizingT TransmissionT EnergyT inT SensorT NetworksT viaT TrajectoryT Control”,T 8thT InternationalT SymposiumT onT ModelingT andT OptimizationT inT Mobile,T AdT Hoc,T andT WirelessT Networks [10] MicheleT Chincoli,*T IDT andT AntonioT Liotta,T “Self-LearningT
PowerT ControlT inT WirelessT SensorT Networks”,T Sensors,T MDPI,T 2018.
[11] Le,T T.T.T.;T Moh,T S.T AnT Energy-EfficientT TopologyT ControlT AlgorithmT BasedT onT ReinforcementT LearningT forT WirelessT SensorT Networks.T Int.T J.T ControlT Autom.T 2017,T 10,T 233–244. [12] Yau,T K.L.A.;T Goh,T H.G.;T Chieng,T D.;T Kwong,T K.H.T ApplicationT
ofT reinforcementT learningT toT wirelessT sensorT networks:T ModelsT andT algorithms.T ComputingT 2015,T 97,T 1045–1075.
[13] Chincoli,T M.;T Syed,T A.A.;T Exarchakos,T G.;T Liotta,T A.T PowerT ControlT inWirelessT SensorT NetworksT withT VariableT Interference.T Mob.T Inf.T Syst.T 2016,T 2016,T 1–10.
[14] XiaopingT Yang,T XueyingT Chen,T RitingT XiaT andT ZhihongT Qian,T “WirelessT SensorT NetworkT CongestionT ControlT BasedT onT StandardT ParticleT SwarmT OptimizationT andT SingleT NeuronT PID”,T Sensors,T MDPI,T 2018.
[15] Yau,T K.L.A.;T Goh,T H.G.;T Chieng,T D.;T Kwong,T K.H.T ApplicationT ofT reinforcementT learningT toT wirelessT sensorT networks:T ModelsT andT algorithms.T ComputingT 2015,T 97,T 1045–1075.
[16] Chincoli,T M.;T Syed,T A.A.;T Exarchakos,T G.;T Liotta,T A.T PowerT ControlT inWirelessT SensorT NetworksT withT VariableT Interference.T Mob.T Inf.T Syst.T 2016,T 2016,T 1–10.s
[17] ZahraT RezaeiT ,T ShimaT MobininejadT ,”T EnergyT SavingT inT WirelessT SensorT NetworksT ”,T InternationalT JournalT ofT ComputerT ScienceT &T EngineeringT SurveyT (IJCSES)T Vol.3,T No.1,T FebruaryT 2012.T
[18] M.T A.T Ameen,T S.M.R.T Islam,T andT K.T Kwak.T EnergyT SavingT mechanismsT forT macT protocolsT inT wirelessT SensorT networks.T InternationalT JournalT ofT DistributedT SensorT Networks,T 2010,T 2010. [19] J.SinhaT andT S.Barman,T “EnergyT efficientT routingT mechanismT inT wirelessT sensorT network”,T InT RecentT AdvancesT inT InformationT TechnologyT (RAIT),T 2012T 1stT InternationalT ConferenceT on,T pagesT 300T –305,T marchT 2012.T
[20] R.SouaT andT P.Minet,T “AT surveyT onT energyT efficientT techniquesT inT wirelessT sensorT networks”,T InT WirelessT andT MobileT NetworkingT ConferenceT (WMNC),T 2011T 4thT JointT IFIP,T pagesT 1T –9,T oct.T 2011.