Abstract: Location based services are essential for the mobile user for obtaining the information based on the specific location. Initially, the location information is obtained using the GIS system for getting accurate information about the location. Then relevant information is extracted based on the location then the features are extracted from the dataset. Extracted features are segmented in order to simplify the process of location based advertising. The segmented features are used for simplifying the processing of retrieved data. The random forest algorithm is utilized to effectively retrieve the user data. It is one of the Meta heuristic algorithms which provide best result for the retrieval process. The optimal solution is needed for the designed algorithm for the purpose of avoiding local optimization, thus it improves the performance with respect to accuracy. The optimization algorithm Harmony search is used for getting optimal result based on the location. The exact information for the query is obtained for the proposed approach based on the location.
Index Terms: Location based services, data retrieval, random forest, harmony search.
I. INTRODUCTION
Mobile advertisement evolved short message service for interactive advertisements. One of the specific methods of mobile advertisement is location-based advertising (LBA) and it received more scholar attention [1]. The academic and industry researchers are doing research to provide location based services to mobile advertising with the help of different algorithms [2]. Nowadays the usage of mobile devices such as cellular telephones, personal digital assistants, handled computers, etc., is commonly increasing and for future preliminary research results the two stage process of refining and testing the scale are reported along with implications and growth of using mobile devices [3]. Such mobile devices are used to access the different type of software applications like games, calendars, address books, etc. Many mobile devices with a web browser accessing the internet and some networks are providing different information [4].
It is possible for a mobile device user while they trying to access a wide variety of content, including information from directories, restaurant guides, travel guides and this obtained search results are responsive to a user’s request [5]. These type of search results are useful for one who seeking the information about the location [6]. For example, a user want
Revised Manuscript Received on July 05, 2019.
Vinita Rohilla, Department of Computer Science and Engineering, School of Engineering and Technology, Sharda University, Greater Noida, Uttar Pradesh - 201306.
Dr. Sudeshna Chakraborty, Department of Computer Science and Engineering, School of Engineering and Technology, Sharda University, Greater Noida, Uttar Pradesh - 201306.
Dr. Rajiv kumar, L. Bajaj Institute of Technology and Management, Department of Computer Science and Engineering, Greater Noida.
to obtain the information related to nearby stores, restaurants, bus stops, etc., while the user standing on a street corner of the particular City. User accessing the computer in a coffee shop, hotel or even in home or office wish to provide the information about nearby establishments, geographical items, landmarks, etc., [7]. Displaying the advertisement to users is possible by computing devices including mobile devices. The information provided by the service provider to the users is free of charge and get profit by displaying the advertisement to the users [8].
However the user and the accessing the internet in general can be located in anywhere of the world [9]. The purchasing advertisements cannot justify at present in many advertisers particularly local advertisers because the advertisers may far beyond the advertiser’s area [10]. These type of advertisements are may reflect their potential of global reach and also they have no guarantee. Viewing these advertisements by users probably degrades to the local adviser [11]. The information providers cannot provide the advertisements presently on the basis of location of the mobile tool users while the user requesting the information [12]. Now-a-days, the web services technology field obtains immense potential for the objective and performance of the service oriented architecture [13]. The steering clear of entire extraneous is used to short list the subset of most leading features and increase the precision and also speed up the model training duration, are the application of classifier [14]. Data mining is the most significant method for inspiring data from the vast amount of data packet in data warehouses, parallel data storehouses and other databases [15-16]. Knowledge discovery, preprocessing, data selection, transformation in data mining and cleaning are the steps which are used and also it is said to be an iterative process [16]. Interpretation, visual approaches, or computational algorithms are used to analysis the incorporation of prior knowledge and gives the evaluation of results [17] [18]. Knowledge discovery and data mining are explanatory in nature, more inductive when compared to other methods like traditional statistical method [19]. The researchers modified and developed models based on the statement of data but basically it fits in the starting stage of deductive discover process [20].
The location based services are challenging due to the requirement of processing large amount of data. The proposed RFA-HS eliminate the need of processing entire data. Because by using random forest algorithm the documents are grouped and
the specific set based on the word frequency is selected with the bagging classifier.
Random Forest with Harmony Search
Optimization For Location Based Advertising
Then the optimization algorithm harmony search is utilized in which the required groups of documents are chosen based on the location information and user query.
II. RELATEDWORK
Amit Poddar et al. demonstrated way to measure online rating bias and also give reasons for the online rating bias. The examination of the validity is very important because of the prevalence of the significant and comments provided by capable customers. The user comments in online also unidentified, there are some cases of two false slander and advertising which can made struggle in business. ANEW (Affective norms for English words) were used to remove an emotion score from the location, which were mined by Twitter and Foursquare [21].
Xiaopeng Chenet al. proposed some algorithms and approaches for remove reference spot set from fresh trajectories. Instead of solving the problems in value of involvement as period constraints by spatiotemporal outliers and noises, human input, data sampling frequency uncertainty, a framework is proposed to adaptively discover the periodic variables of mine individual mobility patters and GPS trajectories. The framework is called as PMPM (Periodic Mobility Pattern Mining). Using the algorithm of frequency pattern mining individual mobility patterns are mined [22].
The possibility to discover us the user preferences, daily mobility patterns and profiles by analyzing the flourish data. The results are analyzed and emerge new types of location based service. The current developments in location-based user preferences are introduced by Jie Bao et al. The discovering of users shopping impulsiveness and characteristics of inferring user demographics were included in those preferences. Location-based recommendations and Location-based predictions are efficiently provided with this mechanism [23].
The online location based services facing a challenge of finding a suitable. This challenge is addressed by MdKhaledur Rahman et al. live campaign is arranged in accordance with the recent schedule between a groups of user’s locations and various spatio-temporal mining features in predictive powers were also be analyzed. The expected audiences were predicted at a location on the basis of those features. The individual features are achieved based accuracy as 50.46% and 72.6% accuracy in the regression model of Support Vector Machine (SVM) [24].
Since that time, the GPS knowledge have more precise and the tablets and smart phones were most pervasive. Therefore, the location based advertising (LBA) also become pervasive. Ranjan B Kini et al. exposed new method for evaluating the supposed values of the LBA also their secrecy observations. Thus, the advertisements are related to the significance of user requirement and the differences in the outcomes and the situations where the permission is granted [25].
III. PROPOSEDMETHODFORLOCATIONBASED
ADVERTISING
The proposed location based services uses the location specific information based on GIS information. When the
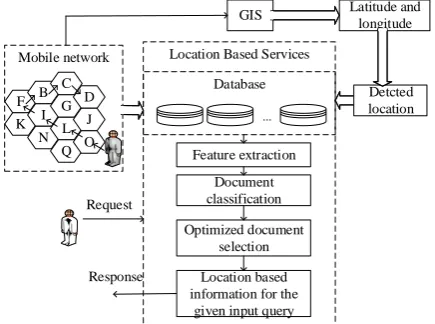
mobile user is moving from one access point to other access point the information regarding the location is varied and it is essential for providing location specific information based on user requirement in order to utilize the services efficiently. The concept of our proposed work is shown is figure 1. It consists of the data base which contains all location specific information. Initially when the user enters into the new region, the location details are obtained using GIS. The user query is processed based on the location determined.
F K
B I N
C G L Q
D J O Mobile network
GIS
...
Database Location Based Services
Response Request
Latitude and longitude
Detcted location
Feature extraction Document classification
Optimized document selection
Location based information for the
[image:2.595.319.537.163.325.2]given input query
Figure 1. Block diagram of the overall architecture
The GIS used in the application shows the location maps in various formats with the coordinates of latitude and longitude as
(
x
,
y
)
. For the collection of locations this coordinates aredenoted as
{(
x
1,
y
1),
(
x
2,
y
2),...(
x
n,
y
n)}
.The mapcoordinates
(
x
,
y
)
are converted into town, streets andlocation with the help of Geo coding. It provides major landmark in the particular coverage area. The repository contains the personal preferences and information of the mobile subscriber. It allows the applications to provide services based on the need and preferences of mobile subscribers. It includes the usage of pattern information, proactive services and profiling functionality.
Feature Extraction and Segmentation
The landmark details of particular coverage area contain vast amount of information. This information is segmented into several small amount of data base don the location. Each location is associated with the location specific information based on nearest major landmark or important places. In the repository, the location specific information is segmented based on the geographical area which is obtained through GIS. Each segmentation, the location specific features are extracted from the geographical data stored in the repository. Based on the removed features, the location of the user can be identified when the user enters into the new location.
Document classification based on location information After extracting the location specific features, large collection of documents are extracted based on the location specific information. In order to extract the required documents based on the given user query, the extracted documents are classified. For
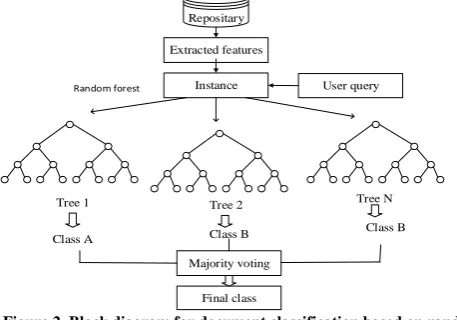
precious techniques for classification and prediction problem. It is based on splitting the attribute space with iterative method. It is a highly interpretable approach due to its binary partitioning capability. The block diagram for document selection is shown in figure 2.
Extracted features
User query Instance
Repositary
Random forest
Tree 1 Tree 2 Tree N
Class A Class B
Class B
Majority voting
[image:3.595.47.276.117.277.2]Final class
Figure 2. Block diagram for document classification based on random forest algorithm
Each location is considered with
n
documents of samplesand couples of them are represented
with
(
y
i,
z
i),
i
1
,
2
,...
n
. Here,y
irepresent the vector ofp
attributes,z
idenotes the logistic classification variableand
y
i
(
y
i1,
y
i2,...
y
in)
. The classD
is indicated as anidentifier and
z
i
D
denotes the attribute vector, theassociated class of
D
is represented asy
i . The greedyprocedure is utilized for partitioning and selecting the attributes. From the large collection of documents, the partition point
t
and an attributej
with the couple of semiplanes
R
1andR
2are described as follows.}
|
{
)
,
(
},
|
{
)
,
(
21
j
t
Y
Y
t
S
j
t
Y
Y
t
S
i
i
(1)In the region
S
k, the proportion for the observation classD
is represented asq
ˆ
kc based on the collection ofk
Q
observations. In order to solve the maximization issue,the selection
(
j
,
t
)
is denoted as following.kc
D
q
ˆ
max
arg
(2)Where,
q
ˆ
kc
(
1
/
Q
k)
y
i
S
kJ
(
z
i
D
)
,J
represents the indicator of attribute vector for that region. The
homogeneity measure
q
ˆ
kcrepresents the child node which isalso termed as impurity function. The misclassification error, deviation or cross entropy and Gini index indicates the impurity functions.
The attribute space is divided into
u
region until thestopping criterion is reached. For the tree of node
k
, the classD
is assigned and it represents the regionS
k thatis
D
(
k
)
arg
max
Dq
ˆ
kc . It searches throughout allpossible values of attributes from all samples.
The binary tree is used as a classification model in which the initial partition of the domain is the mother node for the selected attribute. From the remaining attributes, the
successive partitions in each region are called as a child node. The region is denoted by the leaf which represents the classification model. The issue of high variance can be resolved using bagging techniques. It contains a classifier which comprise of collection of decision trees. T is constructed from random subset of samples. For the given
input
y
i , the class and the classifier for the class isrepresented as
D
andf
bag(
y
i)
. The classes with largestnumber of votes are selected with the classifier
f
bag(
y
i)
asdescribed below.
) ( ˆ max arg ) ( ˆ
i y bag f D i y bag
D (3)
Where, the estimated class D for the input
y
i isrepresented as Dˆbag(yi) , the vector qc(yi) is denoted
as fˆbag(yi)which denotes the portion of the estimator for the
classD.
The concept of random forest is based on trees in addition with the bagging approaches. It contains the collection of correlated trees Vb,b1,...Bwith low variance and bias for
averaging the prediction result. The correlations between trees are reduced by deducting the variance which can be accomplished by randomly selecting the input variables with samples replacement from the data size of sizen.
Every tree in the forest can be grown up based on the selected samples and variables. The random selection shows that two third of collected data, training nbof each classifier
that isnbn. The complement set for each tree is used for
cross validating the trees. The average classification error is considered as a performance metric. After obtaining the random forest, the decision for classifying the sample is based on harmony search optimization algorithm.
A.Document selection based on user query
From the classification tree, the required documents are selected from the group based on harmony search optimization algorithm. In order to get the good harmony the pitches of the gadgets are enhanced by music players. The step by step technique of harmony search is described in below.
Step 1: Initialization
The optimization issue for the algorithm is described as;
M Y
y undergo y
f( ) i i 1,2,...,
min (4)
where, f(y)denotes the objective value, yindicates the decision variables group yi, number of decision variables
used can be represented as Mand Yiindicates the collection
of possible ranges for the decision variables.
The lower bound and upper bound for the variables
i i i Y Uy
Ly are denoted asLyiandUyi. The parameters used
for the HS algorithm is indicated here which includes HMCR (harmony memory considering rate), HMS (harmony memory size), stopping criterion or various improvisations (NI), PAR (pitch adjusting rate) and the
harmony memory solution
vectors. The memory
Harmony memory. The parameters such as HMCR and PAR can be utilized for enhancing the solution vector explained in Step 3.
Step 2: Initialization Harmony memory
The randomly created solution vectors are utilized HMS by filling the HM matrix. The HM matrix can be described as follows. HMS N HMS N HMS HMS HMS N HMS N HMS HMS N N N N y y y y y y y y y y y y y y y y HM 1 2 1 1 1 1 1 2 1 1 2 2 1 2 2 2 1 1 1 1 1 2 1 1 ... ... ... ... ... ... ... ... ... (5)
Step 3: New harmony Improvisation
The y'(y'1,y'2,...,y'N)can be created on the basis of three
rules namely pitch adjustment, memory deliberation and random assortment. For the new vector, the value for the first decision variable is selected from the HM extent( ' '1 )
1 1
HMS
y
y .
For the others y'(y'1,y'2,...,y'N) also, the values are
designated in the similar way.
y probabilit HMCR by Y y y probabilit HMCR by y y y y y i i HMS i i i i i ) 1 ( ' } ,.., , { ' ' 2 1 (6)
The rate of pitch adjustment decision for the proposed algorithm is described as,
bw rand y
y'i 'i ()* (7)
where, the bw of arbitrary distance is denoted as bw, ()
rand generates the random values among 0 and 1. For HM
attention, pitch adjustment and random selection is chosen for each variables.
Step 4: Update harmony memory
New Harmony vector on the basis of objective function value, y'(y'1,y'2,...,y'N) is efficient than bad harmony. It
includes the New Harmony and the old harmony is left out.
Step 5: Stopping criterion
For terminating the computation largest number of improvisations are delighted in this section else, steps 3 and 4 are remade. The proposed algorithm for document selection improves the accuracy of the system and it efficiently provides location based services.
IV. EXPERIMENTALANALYSIS
The proposed LBA is carried out based on RFA-HS in JAVA environment. The parameters like f-measure, precision, and recall are evaluated.
A.Dataset
The information for the dataset is collected based on New York City. The locations such as Albany, Bronx, Cattaraugus, Delaware and Erie are taken into account. For each location 50 documents are collected with the average length of 100 words. Each contains the location information like framework, habitation, hydrography, infrastructure, transport, utility and vegetation.
B.Testing parameters
The precision measures the rejection rate of non-relevant data and recall measures the retrieval rate of relevant data. For evaluating these parameters there are two different set of
parameters are considered they are relevant and non-relevant.
Q Q P P
ecision
Pr (8)
P Q P R
call
Re (9)
Where, for the given query the relevant set of data id represented byPand corresponding set of retrieved data is represented asQ. The operator represents intersection between two sets. The collection of relevant data which are both retrieved and relevant id represented asP Q. The recall denotes the ratio of retrieved meaningful data likewise, the precision represents the ratio of retrieved relevant information. The classification performance can be evaluated with the parameter f-measure which is based on precision and recall. Summarizing efficiency in single number is the advantage of f-measure and it is described the recall and precision harmonic mean. ) ( 2 R P PR F measure F
[image:4.595.320.545.282.445.2] (10)
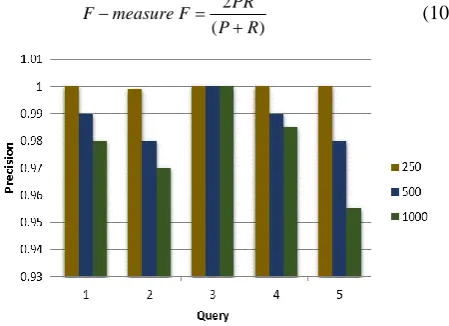
Figure 3. Precision comparisons for varying number of documents
[image:4.595.323.536.567.708.2]The precision value obtained is one for the third query for several documents in the set and this value is reduced for varying the numerous documents as well as different queries. When the number of documents is 250, the precision value is one for all queries. When the number of documents is increased to 500 and 1000, then the precision value is decreased up to 0.97.
For recall comparison shown in figure 4, the recall value is increased to 0.85 for the fourth location query and this value is low for all other queries. The f-measure comparison is displayed in fig 5. Fig 6exhibits the average value of precision recall and f- measure for different user requirement.
[image:5.595.59.281.116.225.2]Figure 5. F-measure comparisons for varying number of documents
Figure 6. Averaging the number of documents for precision, recall and F-measure
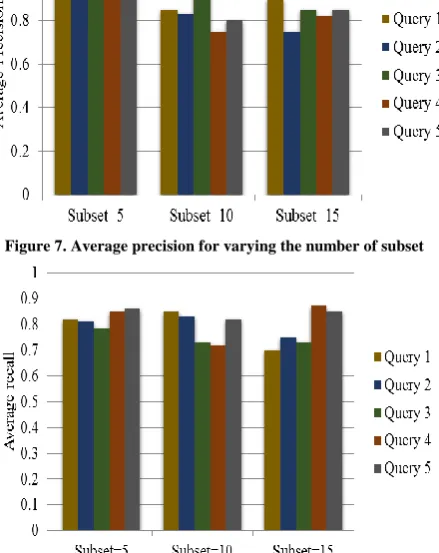
Figure 7. Average precision for varying the number of subset
Figure 8. Average recall for varying the number of subset The average recall, f-measure and precision for changing the number of subset is shown in fig 7, fig 8 and fig 9. The values are reduced for increasing the number of subset to 10 and 15. When 5 subsets are used, the precision value is nearly
[image:5.595.55.282.258.369.2]one. When increasing the number of subset, the precision is between0.6 to0.8.
Figure 9. Average F-measure for varying the number of subset
The recall value is between 0.7 to 0.9 with number of subset is 10 and this value is reduced with increasing the number of subset. The F-measure value also reduced with increase in subset. The efficient location based advertising can be obtained with short time duration with the range of 31- 47ms. Thus the proposed RFA-HS provides accurate classification and efficiency to improve the performance of the location based advertising with the given user query.
V. CONCLUSION
In this paper location based services are provided with data mining based techniques. Initially, when the user enters the new query, the location specific information is extracted based on the latitude and longitude of the current user location. There is a large collection of data for each location from that our location specific information based on user query is retrieved using our proposed RFA-HS algorithm. After extracting the location specific information, the location specific features are extracted and they are segmented to simplify the process. Then the random forest algorithm is utilized in which it classifies the data into several groups. The subset is formed for each group and it becomes the decision tree classifier. The required subset is selected from the group using Harmony search optimization algorithm. It provides global solution for the optimization problem and thus it improves the accuracy of the location based services system. The act of our proposed system is assessed with the performance metrics named f-measure, recall and precision. The improved performance outputs show the efficiency of our proposed approach.
REFERENCES
1. Ketelaar, E. Paul, S.F. Bernritter, T.J. van Woudenberg, E. Rozendaal, R.P. Konig, A. E.Hühn, M.S. Van Gisbergen and L. Janssen. Opening location-based mobile ads: How openness and location congruency of location-based ads weaken negative effects of intrusiveness on brand choice. Journal of Business Research, vol. 91, 2018, pp. 277-285. 2. Bao, Jie, Y. Zheng, D. Wilkie and M. Mokbel. Recommendations in
[image:5.595.55.287.401.552.2] [image:5.595.61.281.438.715.2]3. Gao, Huiji and H. Liu. Data analysis on location-based social networks. In Mobile social networking, Springer New York, (2014) 165-194.
4. Conti, Mauro, Q.Q. Li, A. Maragno and R. Spolaor. The dark side (-channel) of mobile devices: A survey on network traffic analysis. IEEE Communications Surveys & Tutorials 20 (4) (2018) 2658-2713. 5. Turban, Efraim, J. Outland, D. King, J.K. Lee, T.-P. Liang and D.C. Turban. Mobile Commerce and the Internet of Things. In Electronic Commerce Springer, Cham, (2018) 205-248.
6. Taylor, N. Greene. Youth information-seeking behavior and online government information: Tweens’ perceptions of US federal government websites. Journal of Documentation 74 (3) (2018) 509-525.
7. D'Andrea, Eleonora, P. Ducange, D. Loffreno, F. Marcelloni and T. Zaccone. Smart Profiling of City Areas Based on Web Data. In 2018 IEEE International Conference on Smart Computing (SMARTCOMP) IEEE, (2018) 226-233.
8. Limpf, Nina and H.A.M. Voorveld. Mobile location-based advertising: how information privacy concerns influence consumers' attitude and acceptance. Journal of Interactive Advertising 15 (2) (2015) 111-123. 9. Karthick, S. Semi Supervised Hierarchy Forest Clustering and KNN Based Metric Learning Technique for Machine Learning System. Journal of Advanced Research in Dynamical and Control Systems 9 (1) (2017): 2679-2690.
10. Tuchman, E. Anna, H.S. Nair and P.M. Gardete. Television ad-skipping, consumption complementarities and the consumer demand for advertising. Quantitative Marketing and Economics (2018) 1-64.
11. Karthick, S. TDP: A Novel Secure and Energy Aware Routing Protocol for Wireless Sensor Networks. International Journal of Intelligent Engineering and Systems 11 (2) (2018) 76-84.
12. Yus, Roberto, E. Mena, S. Ilarri and A. Illarramendi. SHERLOCK: Semantic management of location-based services in wireless environments. Pervasive and Mobile Computing 15 (2014) 87-99. 13. Zhang, Weinan and J. Wang. Statistical arbitrage mining for display
advertising. In Proceedings of the 21th ACM SIGKDD International Conference on Knowledge Discovery and Data Mining, ACM, (2015) 1465-1474.
14. Wang, Jyun-Guo, S.-C. Tai and C.-J. Lin. The application of an interactively recurrent self-evolving fuzzy CMAC classifier on face detection in color images. Neural Computing and Applications 29 (6) (2018) 201-213.
15. Wen, Yu-Ting, Y.Y. Fan and W.-C. Peng. Mining of Location-Based Social Networks for Spatio-Temporal Social Influence.In Pacific-Asia Conference on Knowledge Discovery and Data Mining, Springer, Cham, (2017) 799-810.
16. Bauer, Christine and C. Strauss. Location-based advertising on mobile devices. Management Review Quarterly 66 (3) (2016) 159-194. 17. Rathore, Punit, A.S. Rao, S. Rajasegarar, E. Vanz, J. Gubbi and M.
Palaniswami. Real-time urban microclimate analysis using internet of things. IEEE Internet of Things Journal 5 (2) (2018) 500-511. 18. Hohman, F. Matthew, M. Kahng, R. Pienta and D.H. Chau. Visual
analytics in deep learning: An interrogative survey for the next frontiers. IEEE transactions on visualization and computer graphics (2018).
19. S. Saha, S. Basak, M. Safonova, K. Bora, S. Agrawal, P. Sarkar and J. Murthy. Theoretical validation of potential habitability via analytical and boosted tree methods: An optimistic study on recently discovered exoplanets. Astronomy and computing 23 (2018) 141-150.
20. O. H. Hun-Young, and N.G. Lederman. Using an Explicit NOS Flow Map in Instruction of Nature of Science Based on the Science of Philosophy. Journal of Turkish Science Education (TUSED) 15 (3) (2018).
21. A. Poddar, S. Banerjee and K. Sridhar.False advertising or slander? Using location based tweets to assess online rating-reliability. Journal of Business Research (2017).
22. X. Chen, D. Shi, B. Zhao and F. Liu. Mining Individual Mobility Patterns Based on Location History. In Data Science in Cyberspace (DSC), IEEE International Conference on, IEEE, (2016) 252-259. 23. J. Bao, D. Lian, F. Zhang and N.J. Yuan.Geo-social media data
analytic for user modeling and location-based services. SIGSPATIAL Special 7(3) (2016) 11-18.
24. M. Rahman and M.A. Nayeem. Finding suitable places for live campaigns using location-based services. In Proceedings of the Fourth International ACM Workshop on Managing and Mining Enriched Geo-Spatial Data, ACM, (2017) 7.