InTrans Project Reports Institute for Transportation
7-2009
Implementation of Intelligent Compaction
Performance Based Specifications in Minnesota
David J. White
Iowa State University, [email protected] Pavana Vennapusa
Iowa State University, [email protected] Jiake Zhang
Iowa State University
Heath Gieselman Iowa State University
Max D. Morris
Iowa State University, [email protected]
Follow this and additional works at:http://lib.dr.iastate.edu/intrans_reports
Part of theCivil Engineering Commons, and theStatistics and Probability Commons
This Report is brought to you for free and open access by the Institute for Transportation at Iowa State University Digital Repository. It has been accepted for inclusion in InTrans Project Reports by an authorized administrator of Iowa State University Digital Repository. For more information, please [email protected].
Recommended Citation
White, David J.; Vennapusa, Pavana; Zhang, Jiake; Gieselman, Heath; and Morris, Max D., "Implementation of Intelligent Compaction Performance Based Specifications in Minnesota" (2009).InTrans Project Reports. 9.
Implementation of Intelligent Compaction Performance Based
Specifications in Minnesota
Abstract
This study documents relationships between intelligent compaction measurement values (IC-MVs) and various insitu point measurement techniques for monitoring compaction of non-granular and granular materials. Factors affecting correlations are discussed (e.g., soil type, moisture contents, stress level, etc.). Measurements from earth pressure cells document the relationship between in-ground stresses for rollers and various in-situ test methods.
Comparisons were made between test roller rut depth measurements and IC-MVs and various point measurements as a quality assurance (QA) check for the subgrade pavement foundation layer. It was concluded that IC-MVs and in-situ point measurements can serve as reliable alternatives to test rolling. Site specific target values were calculated for IC-MVs, dynamic cone penetrometer (DCP), light weight deflectometer, (LWD), and shear strength.
Measurement error and protocols for field testing were evaluated for LWDs. Laboratory compacted samples were used to assess an approach for determining LWD field target values. Future research is recommended to evaluate this approach for materials on a state-wide basis.
Results from field studies were used to develop four IC specification options. Three specifications do not require on-site roller calibration. One specification option requires on-site calibration of IC-MVs and in-situ point measurements. This specification option has the advantages of quantifying risk, establishing a
framework for a performance specification, providing information for incentive-based pay, and better linking as-built quality to long-term performance. An IC training/certification program, new IC field data analysis tools, and additional pilot projects will assist with greater implementation of these technologies.
Keywords
Civil Construction and Environmental Engineering, Statistics, EERC, Earthwork quality, intelligent compaction, geostatistics, in-situ testing, laboratory compaction testing, resilient modulus
Disciplines
Civil Engineering | Statistics and Probability
Take the steps...
Transportation Research Research...Knowledge...In
novative Solutions!
2009-14
Technical Report Documentation Page
1. Report No. 2. 3. Recipients Accession No.
MN/RC 2009-14
4. Title and Subtitle 5. Report Date
July 2009 6.
Implementation of Intelligent Compaction Performance Based Specifications in Minnesota
7. Author(s) 8. Performing Organization Report No.
David White, Pavana Vennapusa, Jiake Zhang, Heath Gieselman, Max Morris
EERC 09-02
9. Performing Organization Name and Address 10. Project/Task/Work Unit No.
11. Contract (C) or Grant (G) No. Earthworks Engineering Research Center
Dept. of Civil, Construction and Environmental Engineering Iowa State University
2711 South Loop Drive, Suite 4700 Ames, Iowa 50010-8664
(c) 89256 (wo) 2
12. Sponsoring Organization Name and Address 13. Type of Report and Period Covered
Final Report
14. Sponsoring Agency Code Minnesota Department of Transportation
395 John Ireland Boulevard Mail Stop 330
St. Paul, Minnesota 55155
15. Supplementary Notes
http://www.lrrb.org/PDF/200914.pdf 16. Abstract (Limit: 250 words)
This study documents relationships between intelligent compaction measurement values (IC-MVs) and various in-situ point measurement techniques for monitoring compaction of non-granular and granular materials. Factors affecting correlations are discussed (e.g., soil type, moisture contents, stress level, etc.). Measurements from earth pressure cells document the relationship between in-ground stresses for rollers and various in-situ test methods.
Comparisons were made between test roller rut depth measurements and IC-MVs and various point measurements as a quality assurance (QA) check for the subgrade pavement foundation layer. It was concluded that IC-MVs and in-situ point measurements can serve as reliable alternatives to test rolling. Site specific target values were
calculated for IC-MVs, dynamic cone penetrometer (DCP), light weight deflectometer, (LWD), and shear strength.
Measurement error and protocols for field testing were evaluated for LWDs. Laboratory compacted samples were used to assess an approach for determining LWD field target values. Future research is recommended to evaluate this approach for materials on a state-wide basis.
Results from field studies were used to develop four IC specification options. Three specifications do not require on-site roller calibration. One specification option requires on-site calibration of IC-MVs and in-situ point measurements. This specification option has the advantages of quantifying risk, establishing a framework for a performance specification, providing information for incentive-based pay, and better linking as-built quality to long-term performance. An IC training/certification program, new IC field data analysis tools, and additional pilot projects will assist with greater implementation of these technologies.
17. Document Analysis/Descriptors 18. Availability Statement
Earthwork quality, intelligent compaction, geostatistics, in-situ testing, laboratory compaction testing, resilient modulus
No restrictions. Document available from: National Technical Information Services, Springfield, Virginia 22161
19. Security Class (this report) 20. Security Class (this page) 21. No. of Pages 22. Price
Implementation of Intelligent Compaction Performance
Based Specifications in Minnesota
Final Report
Prepared by
David J. White Pavana KR. Vennapusa
Jiake Zhang Heath Gieselman
Max Morris
Earthworks Engineering Research Center
Department of Civil, Construction and Environmental Engineering Iowa State University
July 2009
Published by
Minnesota Department of Transportation Research Services Section
Transportation Bldg.
395 John Ireland Boulevard, Mail Stop 330 St. Paul, Minnesota 55155-1899
This report represents the results of research conducted by the authors and does not necessarily represent the views or policies of the Minnesota Department of Transportation or the Iowa State University Department of Civil, Construction and Environmental Engineering. This report does not contain a standard or specified technique.
Acknowledgements
The Minnesota Department of Transportation (Mn/DOT) and the Federal Highway Administration (FHWA) sponsored this study. Numerous people assisted the authors in
identifying and providing access to grading projects for testing, refining research tasks, providing review comments and targeting concepts to improve implementation of intelligent compaction technologies. Some of the contributors are listed in the following. Their support is greatly appreciated.
Input and review comments were provided from the Technical Advisory Panel members: John Siekmeier, Rebecca Embacher, Glenn Engstrom, Erland Lukanen, Clark Moe, Art Bolland, Tim Andersen, Perry Collins, Dan Ross, George Begelman, Kevin Kliethermes, Matt Oman, George Cochran, Curt Turgeon, and Jay Hietpas. These members were very helpful in directing the research tasks for this project.
Darren Nelson, Tom Ravn, Todd Davidson, Ted Sexton, Shiloh Wahl, Gary Troge, Bob Williams, Lonny White, Keith Bloomgren, David Rettner, Kaye Bieniek, Clint Larsen, Mike Sheehan, John Hager, Curt Bolles, and Steven Adamsky assisted with project coordination and field testing. Their timely response in identifying areas for testing, coordination with contractors and roller manufacturers, and supplying project information is greatly appreciated.
The roller manufacturers provided assistance with machine operations and data analysis. The authors acknowledge Dean Potts, Nick Oetken, Mario Souraty, Bryan Brady, Terry Rasmussen, Blake Aldrich, Mark Rinehart, and Allen DeClerk of Caterpillar and their dealer Ziegler Inc.
Mathiowetz Construction and Road Constructors provided support during field testing.
Table of Contents
Chapter 1 Introduction ... 1
1.1 Overview... 1
1.2 Project Goals/Tasks ... 1
1.3 Research Methodology ... 2
1.4 Report Organization... 3
1.5 Units Conversion ... 3
Chapter 2 Experimental Testing Methods ... 5
2.1 Roller-Integrated Compaction Measurements ... 5
2.1.1 Compaction Meter Value (CMV) and Resonant Meter Value (RMV)... 5
2.1.2 Machine Drive Power (MDP)... 7
2.2 In-Situ Testing Methods ... 8
2.2.1 Heavy Test Rolling ... 8
2.2.2 Light Weight Deflectometers... 8
2.2.3 Falling Weight Deflectometer... 9
2.2.4 Dynamic Cone Penetrometer ... 9
2.2.5 Piezocone Cone Penetration Test... 10
2.2.6 Nuclear Gauge ... 10
2.2.7 Shelby Tube Sampling... 10
2.2.8 Static Plate Load Test ... 10
2.2.9 Clegg Hammer ... 10
2.2.10 Soil Stiffness Gauge... 11
2.2.11 Earth Pressure Cells ... 11
Chapter 3 Field Project Case Histories ... 15
3.2 Overview of IC Pilot Specifications ... 16
3.3 Metro District TH 36, North St. Paul... 18
3.3.1 Project Overview ... 18
3.3.2 Experimental Testing ... 19
3.3.3 Comparison of IC-MVs and In-Situ Point Measurements... 20
3.3.4 Stresses in Pavement Foundation Layers... 36
3.3.5 Project Level In-Situ QA/QC Test Results... 46
3.3.6 Key Observations and Conclusions ... 52
3.4 District 2 US 10, Staples... 54
3.4.1 Project Overview ... 54
3.4.2 Experimental Testing ... 54
3.4.3 Comparison between IC-MVs and in-situ point measurements ... 56
3.4.4 Stresses in Granular Subgrade Layers ... 81
3.4.5 Key Observations and Conclusions ... 89
3.5 District 7 TH 60, Bigelow... 90
3.5.1 Project Overview ... 90
3.5.2 Experimental Testing ... 90
3.5.3 Field Observations and In-Situ QA Test Results from Mn/DOT ... 95
3.5.4 Comparison between IC and In-situ Point Measurements... 104
3.5.5 Stresses in Non-granular Subgrade Layer... 137
3.5.6 Discussion... 140
3.5.7 Key Observations and Conclusions ... 141
3.6 CSAH 2, Olmsted County... 142
3.6.1 Introduction... 142
3.6.3 Key Observations and Conclusions ... 152
3.7 Repeatability and Reproducibility of IC-MVs... 153
3.7.1 Analysis Approach... 153
3.7.2 Analysis Results and Discussion ... 154
3.8 Key Findings from Field Studies ... 162
3.8.1 Granular Soils ... 162
3.8.2 Non-Granular Soils ... 164
Chapter 4 Guidance for Test Roller Specification Modification ... 166
4.1 Background... 166
4.2 Experimental Testing... 168
4.3 Correlations between Rut Depths and Different In-situ Measurements ... 169
4.4 Bearing Capacity Analysis on a Layered Non-granular Soil Stratum ... 172
4.5 Implementation Aspects... 176
4.6 Conclusions and Recommendations ... 176
Chapter 5 LWD Evaluation and Target Value Determination... 178
5.1 Introduction... 178
5.2 Background... 178
5.3 Experimental Comparison of LWD Devices ... 180
5.3.1 ELWD Comparison between Different LWD devices ... 184
5.3.2 Influence of Plate Diameter on ELWD... 187
5.3.3 Influence of Applied Contact Stress on ELWD... 189
5.3.4 Influence of Buffer Stiffness on ELWD... 190
5.3.5 Influence of Confinement on In-Situ ELWD Measurements ... 191
5.4 Variability of ELWD Measurements ... 193
5.6 Guidance for LWD Testing Standard Protocol for Granular and Non-Granular Soils... 201
5.7 Comparison between ELWD and CIV measurements... 204
5.8 Target Value Determination Study ... 207
5.8.1 Background and Test Methods ... 208
5.8.2 Laboratory Approach ... 209
5.8.3 Experimental Test Results and Discussion... 224
5.8.4 Field Approach to Target Value Determination ... 240
5.8.5 Linking Laboratory LWD-TVs to In-Situ LWD Measurements ... 241
5.8.6 Summary of Laboratory Target Value Determination Study ... 251
Chapter 6 IC Verification and Specification Options ... 253
6.1 Verification Procedures for IC Equipment ... 253
6.1.1 Determining IC-MV Measurement Error ... 253
6.1.2 Dedicated IC Verification Test Facility at MnROAD ... 256
6.1.3 Mechanical System to Simulate Ground Conditions... 256
6.2 Recommendations for Future IC Specifications and Implementation Strategies ... 257
6.2.1 Option 1 – Use of IC-MV Map to Target In-situ QA Measurements... 258
6.2.2 Option 2 – Assessment of IC-MV Change to Target In-situ QA Testing ... 259
6.2.3 Option 3 – Pre-selected IC-TVs and Mechanistic-Related QA-TVs... 261
6.2.4 Option 4 – Concept for Statistically-Framed QA/QC Assessment Approach... 261
6.3 Summary... 270
Chapter 7 Summary and Conclusions... 273
7.1 Summary... 273
7.2 Key Findings from Field Projects ... 273
7.2.1 Granular Soils ... 273
7.3 Guidance for Test Roller Specification Modification... 276
7.4 LWD Evaluation and Target Value Determination ... 276
7.4.1 Experimental Comparison of LWD Devices and Influencing Factors ... 276
7.4.2 Variability of ELWD Measurements and Measurement Error ... 277
7.4.3 Guidance for a Standard Test Protocol ... 278
7.4.4 Comparison between ELWD and CIV Measurements ... 280
7.4.5 Laboratory Target Value Determination Study ... 280
7.5 IC Verification and Specification Options... 281
7.5.1 Verification ... 281
7.5.2 Specifications... 282
Chapter 8 Recommendations for Implementation ... 284
8.1 Recommendations for Specification Development ... 284
8.2 Development of Training/Certification Program... 284
8.3 Data Analysis/Report/Archiving... 284
References... 285
List of Tables
Table 1.1. Summary of unit conversions from Metric to English ... 4
Table 2.1. Summary of measurement values and settings on the machines used... 6
Table 2.2. Observed modes of vibratory roller drum (Adam 1997) ... 7
Table 2.3. In-situ test methods and procedures employed in this study ... 12
Table 2.4. Resilient modulus (Mr) test loading sequences for subgrade materials (AASHTO T-307 test procedure)... 14
Table 3.1. Field testing summary (TH36)... 19
Table 3.2. Summary of soil index properties (TH36)... 20
Table 3.3. Summary of regression relationships (TH36 strip 1 – lift 1)... 23
Table 3.4. Summary statistics of IC-MVs and in-situ point measurements at surface (TH36 strip 1 – lift 1)... 23
Table 3.5. Summary of regression relationships for measurements at surface (TH36 strip 2)... 27
Table 3.6. Summary statistics of IC-MVs and in-situ point measurements (TH36 strip 2) ... 27
Table 3.7. Summary of roller passes (TH36 strip 4)... 30
Table 3.8. Summary of regression relationships (TH36 strip 4)... 34
Table 3.9. Summary statistics of IC-MVs and in-situ point measurements at surface (TH36 strip 4) ... 34
Table 3.10. Summary of Mn/DOT QA/QC test results for GN = 3.9 material ... 47
Table 3.11. Summary of Mn/DOT QA/QC test results for GN = 5.2 material ... 48
Table 3.12. Summary of Mn/DOT QA/QC test results for GN = 5.3 material ... 49
Table 3.13. Summary of Mn/DOT QA/QC test results for GN = 5.6 material ... 49
Table 3.14. Summary of measurement influence depth of different measurements – TH36 project ... 54
Table 3.15. Field testing summary (US10)... 55
Table 3.16. Summary of soil index properties from US 10 project... 55
Table 3.18. Summary statistics of IC-MVs and in-situ point measurements from test strip 1... 60
Table 3.19. Summary statistics of IC-MVs and in-situ point measurements on test strip 2... 70
Table 3.20. Summary statistics of CMV and in-situ point measurements from test strip 3 ... 71
Table 3.21. Summary of regression relationships between IC-MVs and in-situ point measurements – US10 project test strips 1, 2, and 3 ... 75
Table 3.22. Summary of regression relationships between different in-situ point measurements – US10 project ... 76
Table 3.23. Summary of measurement influence depth of different measurements – US10 project ... 90
Table 3.24. Field testing summary (TH60)... 93
Table 3.25. Summary of soil index properties from US 60 project subgrade material ... 93
Table 3.26. ELWD test measurements by Mn/DOT during field survey by ISU ... 97
Table 3.27. QA test results from TH60 project by Mn/DOT field personnel... 98
Table 3.28. Summary statistics of CCV and in-situ point measurements from test strip 1 ... 109
Table 3.29. Summary statistics of IC-MVs and in-situ point measurements after passes 8 and 15 – test strip 2... 115
Table 3.30. Test Strips 3a, 3b, and 3c roller pass summary ... 119
Table 3.31. Summary statistics of in MDP* and in-situ point measurements – test strip 3 ... 124
Table 3.32. Summary of regression relationships – TH60 project ... 129
Table 3.33. Summary of roller passes – Olmsted County project ... 143
Table 3.34. Summary of regression relationships – Olmsted County project ... 151
Table 3.35. Summary of multiple regression analysis – Olmsted County data... 152
Table 3.36. Summary of repeatability analysis results on MDP*, CMV, and RMV... 160
Table 3.37. Summary of R&R analysis results on MDP* ... 161
Table 3.38. Summary of measurement influence depth of different measurements – granular soils ... 163
Table 4.2. Summary of QA target values alternative to heavy test rolling rut depth of 50 mm. 176
Table 5.1. Comparison between different LWD devices... 179
Table 5.2. Summary of field studies and index properties of materials ... 183
Table 5.3. Summary of Zorn and Keros/Dynatest 3031 LWD test conditions... 184
Table 5.4. Summary of modulus measurements from different field studies... 195
Table 5.5. Summary of testing for repeatability and reproducibility evaluation on LWD measurements... 198
Table 5.6. Summary of repeatability analysis results on LWD measurements ... 200
Table 5.7. Summary of R&R analysis on LWD measurements for change in device... 201
Table 5.8 Summary of soil index properties – LWD-Clegg comparison studies ... 205
Table 5.9. Comparison of summary statistics for ELWD-Z2 and CIV20-kg measurements ... 206
Table 5.10. Summary of experimental testing – laboratory target value determination study... 211
Table 5.11. Summary of index properties of granular materials used in laboratory target value determination study and tests performed ... 212
Table 5.12. Summary of index properties of non-granular soils used in laboratory target value determination study... 212
Table 5.13. Summary of laboratory determined w-γd-DPI/su/ELWD relationships ... 228
Table 5.14. Comparison of Mr for 2:1 and 1:1 height to diameter ratio specimens – TH-60 soil 306 (USCS: CL)... 237
Table 5.15. In-situ dLWD measurements (TH60 project test strips 1 to 5) for Mn/DOT moisture content target limits... 247
Table 5.16. In-situ ELWD measurements (TH60 project test strips 1 to 5) for Mn/DOT moisture content target limits... 248
Table 5.17. Comparison between Mn/DOT and laboratory-determined dLWD and ELWD target values for different moisture ranges for materials from TH60 project test strips 1 to 5... 249
Table 5.18. In-situ Mn/DOT QA dLWD and ELWD measurements at different moisture contents from the TH60 project ... 250
Table 6.1 Suggested pass sequence to assess measurement error ... 254
List of Figures
Figure 2.1. 12-ton CS-563 smooth drum (left) and 19-ton CS-683 smooth drum rollers equipped with CMV/RMV systems and GPS ... 6
Figure 2.2. 12-ton CP-563 padfoot roller equipped with MDP* system and GPS... 8
Figure 2.3. In-situ testing methods employed in this study: (a), (b) towed pneumatic dual-wheel test rollers with 650 kPa contact tire pressure, (c) Keros, Dynatest, and Zorn LWDs, (d)
Mn/DOT Dynatest FWD, (e) DCP, (f) Mn/DOT CPT, (g) nuclear moisture-density gauge, (h) shelby tube sampler, (i) static plate load test, (j) 20-kg Clegg Hammer, (k), Humboldt SSG, and (l) Piezoelectric EPCs ... 13
Figure 2.4. Static plate load test data modulus scheme for subgrade, subbase, and base materials ... 14
Figure 3.1. Illustration of differences in measurement influence depths of different testing
devices... 16
Figure 3.2. Construction operations on test strip 1 ... 21
Figure 3.3. CMV map of test strip 1 (lift 1) and DPI profiles at spot test locations TH 36 ... 22
Figure 3.4. Comparison between CMV and in-situ point measurements (TH 36 strip 1 – lift 1; roller operation parameters (nominal): a = 0.85 mm, f = 33 Hz, v = 4.0 km/h) ... 22
Figure 3.5. Simple linear regression relationships between in-situ point measurements and CMV (TH 36 strip 1 – lift 1)... 23
Figure 3.6. Photographs showing LWD and Clegg hammer tests conducted in the 0.15 m deep excavation and plots showing comparison of in-situ point measurements obtained at the surface and at 0.15 m below the surface (TH 36 strip 1 – lift 2)... 24
Figure 3.7. CMV map of test strip 2 and DPI profiles at select spot test locations ... 25
Figure 3.8. Comparison between CMV and in-situ point measurements (TH 36 strip 2; roller operation parameters (nominal): a = 0.85 mm, f = 33 Hz, v = 4.0 km/h)... 26
Figure 3.9. Simple linear regression relationships between in-situ point measurements and CMV (TH 36 strip 2) ... 28
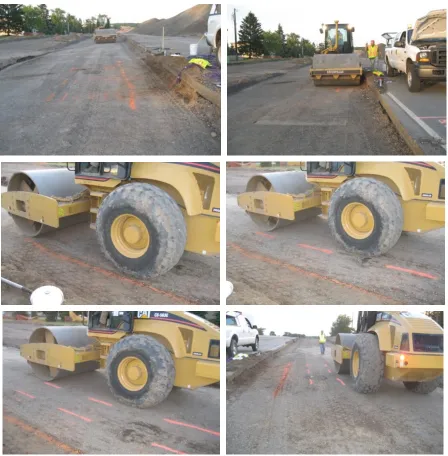
Figure 3.10. Plan view of TH36 strip 4 and photographs during rolling and testing operations.. 30
Figure 3.12. CMV and RMV from test strip 4 with nominal v = 3.2 km/h and f = 33 Hz settings: (a) repeatability of CMV at two amplitude settings, (b) influence of RMV on CMV
measurements... 31
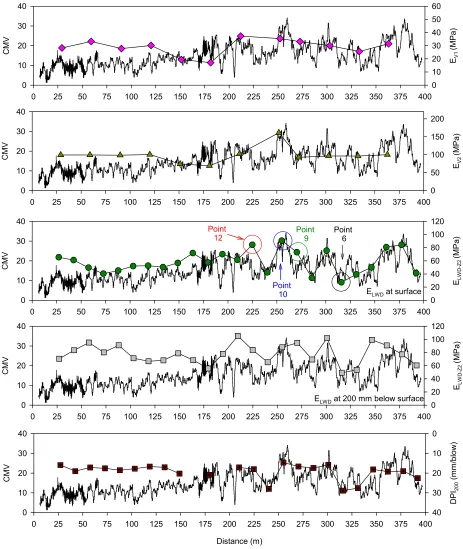
Figure 3.13. Comparison of CMV with in-situ mechanistic point measurements – DCP index, qt,
and EFWD profiles at two select points (test strip 4). ... 32
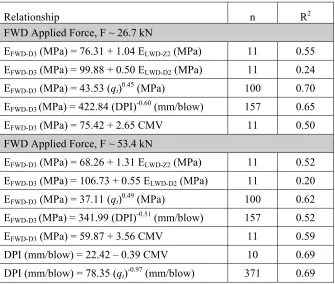
Figure 3.14. Relationships between different in-situ point measurements (EFWD-D3 at F ~ 26.7
kN). ... 33
Figure 3.15. Relationships between CMV and point measurements (EFWD-D3 at F ~ 53.4 kN).... 35
Figure 3.16. Results of multiple regression analysis illustrating the effect of RMV... 36
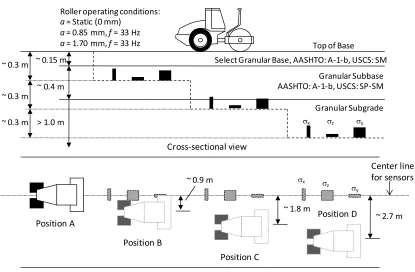
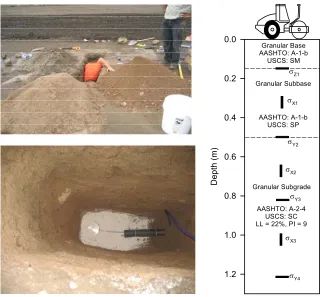
Figure 3.17. Plan and cross-sectional views of location of EPCs in the pavement foundation layers – test strip 3 ... 37
Figure 3.18. Pictures showing rolling pattern on test strip 3 ... 38
Figure 3.19. Installation of EPCs in a layer of silica sand at different depths on test strip 4 ... 39
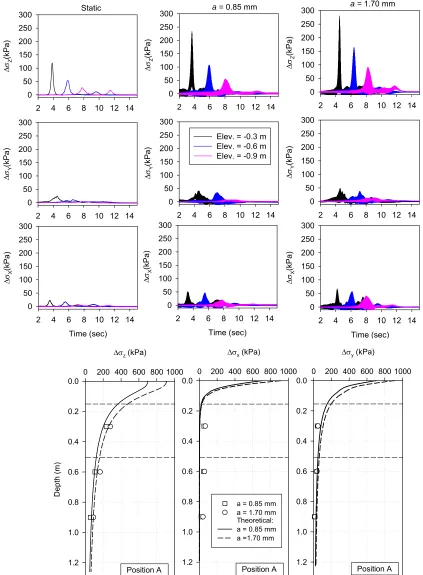
Figure 3.20. Triaxial stresses developed under the roller at position A at different amplitude settings (top) and profile of peak stresses (bottom) (test strip 3)... 40
Figure 3.21. Triaxial stresses developed under the roller at position B at different amplitude settings (top) and profile of peak stresses (bottom) (test strip 3)... 41
Figure 3.22. Triaxial stresses developed under the roller at position C at different amplitude settings (top) and profile of peak stresses (bottom) (test strip 3)... 42
Figure 3.23. Total vertical and lateral stress measurements from test strip 4 under roller vibratory loading at a = 0.85 and 1.70 mm nominal settings (note drum jumping at a = 1.70 mm) (test strip 4) ... 43
Figure 3.24. Peak vertical and lateral stress increase profiles (measured and theoretical
Boussinesq curves) for roller induced vibratory loads, and FWD and LWD dynamic loads, and estimated residual stresses to calculate K from Duncan and Seed (1986) (test strip 4) ... 44
Figure 3.25. Comparison of total stress paths under roller vibratory load (Positions A to B loading and Positions B to C unloading), FWD and LWD dynamic loads, and stresses applied during laboratory Mr tests on base/subbase materials (test strip 3) ... 45
Figure 3.26. Histograms of Mn/DOT QA/QC moisture content measurements from TH36 project (data includes both pass and fail measurements)... 50
Figure 3.27. Histograms of Mn/DOT QA/QC DPImeasurements from TH36 project (data
Figure 3.28. Histograms of Mn/DOT QA/QC ELWD-Z2 and dLWD-Z2 measurements from TH36
project (data includes both pass and fail measurements)... 51
Figure 3.29. Histograms of Mn/DOT QA/QC ELWD-D2 and dLWD-D2 measurements from TH36 project (data includes both pass and fail measurements)... 52
Figure 3.30. Test strip 1 area with spot test locations... 57
Figure 3.31. Construction operations on test strip 1 ... 57
Figure 3.32. LWD testing performed by excavating loose material at the surface to a depth of about 0.15 m... 58
Figure 3.33. Compaction growth curves of in-situ point measurements (no measurements at points A, B, 11 and 12 at pass 0) ... 59
Figure 3.34. CMV data from mapping passes 1 to 5 ... 59
Figure 3.35. Frequency distribution of CMV data (pass 2, a = 0.85 mm)... 60
Figure 3.36. Comparison between CMV and in-situ point measurements from test strip 1... 61
Figure 3.37. Comparison of ELWD-Z3 point measurements at surface and at different depths with DPI profiles... 62
Figure 3.38. Photographs of test strip 2 after final pass (left) and in-situ testing (right)... 63
Figure 3.39. Plan view CMV map at two different amplitude (a = 0.85 and 1.70 mm) settings of test strip 2 compacted in six roller lanes... 64
Figure 3.40. Frequency distribution of CMV data from test strip 2 (a = 0.85 and 1.70 mm) ... 64
Figure 3.41. Comparison of CMV (a = 0.85 and 1.70 mm) and ELWD-D2 measurements from test strip 2 lanes 1 to 6 ... 65
Figure 3.42. Comparison of CMV (a = 0.85 mm) and NG measurements from test strip 2 lanes 1 to 6 ... 66
Figure 3.43. Comparison of CMV (a = 1.70 mm) and NG measurements from test strip 2 lanes 1 to 6 ... 67
Figure 3.44. Comparison of CMV (a = 0.85 and 1.70 mm) and DPI300 measurements from test strip 2 lanes 1 to 6 ... 68
Figure 3.45. Comparison of CMV (a = 0.85 and 1.70 mm) and DPIS-300 measurements from test strip 2 lanes 1 to 6 ... 69
Figure 3.47. Comparison of CMV (a = 0.85 and 1.70 mm) and in-situ point measurements from
test strip 3... 71
Figure 3.48. Compaction operations on test strip 4 with soft and uncompacted material... 72
Figure 3.49. Compaction operations on test strip 5 with relatively uniform conditions across the test strip... 72
Figure 3.50. Regression relationships between CMV (a = 0.85 mm) and different in-situ point measurements... 73
Figure 3.51. Regression relationships between CMV (a = 1.70 mm) and different in-situ point measurements... 74
Figure 3.52. Regression relationships between different in-situ point measurements ... 77
Figure 3.53. Semivariograms of IC-MVs and in-situ point measurements from test strip 2... 79
Figure 3.54. Spatial comparison of IC-MVs and in-situ point measurement Kriged spatial maps from test strip 2 ... 80
Figure 3.55. EPC installation setup on test strips 1 and 5... 82
Figure 3.56. Picture of EPC installed in orthogonal directions on test strip 1 (top view) ... 83
Figure 3.57. Plan view on roller and scraper passes on test strips 1 and 5 ... 83
Figure 3.58. Triaxial stress increase time histories at different depths under a = 0.85 mm (left) and 1.70 mm (right) vibratory rolling operation – Test strip 1... 84
Figure 3.59. Triaxial stress increase time histories at different depths under scraper tire position A passes without load (left) and fully loaded (right) – Test strip 1 ... 85
Figure 3.60. Triaxial stress increase time histories at different depths under scraper tire position B passes without load (left) and fully loaded (right) – Test strip 1 ... 86
Figure 3.61. Triaxial stress increase time histories at different depths under scraper tire position C passes without load (left) and fully loaded (right) – Test strip 1 ... 87
Figure 3.62. Triaxial stress increase time histories for different passes at a = 0.85 mm (left) and 1.70 mm (right) vibratory rolling operation – Test strip 5... 88
Figure 3.63. Peak vertical and horizontal stress increase profiles (measured and theoretical Boussinesq curves) for roller induced vibratory loading and under scraper tire ... 89
Figure 3.64. Laboratory compaction test results for sample A... 94
Figure 3.66. Laboratory compaction test results for test strip 2 sample ... 95
Figure 3.67. Scraper traffic contributing to compaction of fill materials ... 97
Figure 3.68. Histogram of moisture content, LWD, and MDP* test measurements ... 102
Figure 3.69. Simple linear regression relationships between QA measurements obtained by Mn/DOT field personnel... 103
Figure 3.70. Plan view MDP* map of the test strip 1 area with selected lanes for compaction testing (production area mapped a few hours prior to testing) ... 105
Figure 3.71. Screen shots from the on-board AccuGrade compaction monitoring system showing number of passes and MDP* – Test strip 1 ... 106
Figure 3.72. Comparison between CCV (a = 1.87 mm) and in-situ point measurements (ELWD and DPI) from test strip 1... 107
Figure 3.73. Comparison between CCV (a = 1.87 mm) and in-situ point measurements (NG and DC) from test strip 1 ... 108
Figure 3.74. DCP profiles from test strip 1 (depth to the dashed line indicates the compacted compaction layer thickness) and histogram of estimated lift thickness – test strip1... 111
Figure 3.75. Laboratory moisture-density relationships and in-situ moisture density measurements from test strip 1 ... 112
Figure 3.76.Pictures from test strip 2 construction: fill placement, compaction, in-situ spot testing, and final compacted surface (top left to bottom right)... 113
Figure 3.77. IC-MVs and in-situ point measurements at several passes – test strip 2... 114
Figure 3.78. Frequency distribution plot of IC-MVs for pass 8 – test strip 2... 114
Figure 3.79. Laboratory and in-situ moisture-density measurements – test strip 2... 115
Figure 3.80. Compaction growth curves for IC-MVs and in-situ point measurement values .... 116
Figure 3.81. Bar chart comparisons of average IC-MVs and in-situ point measurement values at different passes... 116
Figure 3.82. DPI profiles and su form UC testing on Shelby tube samples from test strip 2 subgrade after pass 15... 117
Figure 3.84. Screen shots from AccuGrade showing change in elevation from pass 1 to final pass – test strip 3... 119
Figure 3.85. Screen shots from AccuGrade showing change in MDP*from pass 1 to pass 2 – test strip 3 ... 120
Figure 3.86. Screen shots from AccuGrade showing change in MDP*from pass 4 to pass 8 – test strip 3 ... 120
Figure 3.87. CCV and ELWD comparisons for test strip 3 ... 121
Figure 3.88. CCV and NG test measurements after final pass for test strip 3 ... 122
Figure 3.89. Bar charts comparing CCV and ELWD measurement values from strip 3a, 3b, and 3c
... 122
Figure 3.90. Laboratory Proctor and in-situ moisture-density measurements... 123
Figure 3.91. Influence of amplitude on MDP*compaction curves on lanes 3a, 3b, and 3c – test strip 3 ... 123
Figure 3.92. Linear regression relationships between MDP* and ELWD measurements... 126
Figure 3.93. Linear regression relationships between MDP* and dLWD measurements ... 127
Figure 3.94. Linear regression relationships between MDP* and in-situ point measurements.. 128
Figure 3.95. Multiple linear regression relationships incorporating moisture content in predicting MDP* values... 130
Figure 3.96. Screen shots from AccuGrade showing test strips 4 and 5 CMV and RMV maps 132
Figure 3.97. CMV map of test strip 4 (a = 0.85 mm), photograph of the test area, and frequency
distribution histograms of CMV and in-situ point measurements... 133
Figure 3.98. CMV map of test strip 5 (a = 0.85 mm) and photograph of the test area highlighting soft and stiff spot test locations... 134
Figure 3.99. Frequency distribution histograms of CMV and in-situ point measurements from test strip 5... 135
Figure 3.100. Linear regression relationships between CMV and in-situ point measurements . 136
Figure 3.101. Relationships between DPI, su, ELWD-Z2, and dLWD-Z2... 137
Figure 3.103. Vertical stress increase under roller at multiple passes ... 139
Figure 3.104. IC padfoot roller (left) and LWD test preparation (right) by excavating to bottom of padfoot penetrations ... 143
Figure 3.105. AccuGrade screenshots from Olmsted County test strips 1 and 2 showing number of passes, elevation, MDP*, and average MDP* (shown as CCV) with pass ... 144
Figure 3.106. Influence of roller operation direction, amplitude and speed settings on average MDP*... 145
Figure 3.107. Elevation change across the test strip – Olmsted County... 146
Figure 3.108. Comparison of MDP* with ELWD-Z2 measurements (one point measurement at the
center of the drum) – Test strip 1 (a = static and v = 3.2 km/h and 6.4 km/h)... 146
Figure 3.109. Comparison of MDP* with ELWD-Z2 measurements (one point measurement at the
center of the drum) – Test strip 2 (a = 0.90 mm and v = 3.2 km/h and 6.4 km/h) ... 147
Figure 3.110. Comparison of MDP* with ELWD-Z2 measurements (one point measurement at the
center of the drum) – Test strip 2 (a = 1.80 mm and v = 3.2 km/h and 6.4 km/h) ... 147
Figure 3.111. Effect of change in elevation on MDP* values ... 148
Figure 3.112. Simple linear regression relationships (ELWD-Z2 and MDP*) – Olmsted County data
... 149
Figure 3.113. Simple linear regression relationships (dLWD-Z2 and MDP*) – Olmsted County data
... 150
Figure 3.114. Results of multiple regression analysis incorporating speed, direction, amplitude, and ELWD-Z2 as prediction parameters... 152
Figure 3.115. Comparison of averaged MDP* data from Iowa State University VB IC
repeatability algorithm (spacing 0.3 m) and actual MDP* data – TH60 test strip 2 ... 153
Figure 3.116. Repeatability of MDP* measurements at a = 0.85 mm – TH60 test strip 2 ... 156
Figure 3.117. Repeatability of MDP* measurements in static mode – Olmsted County test strip 1 ... 157
Figure 3.118. Repeatability of MDP* measurements at a = 0.90 mm setting – Olmsted County
test strip 2... 158
Figure 3.119. Repeatability of MDP* measurements at a = 1.80 mm setting – Olmsted County
test strip 2... 159
Figure 4.1. Towed pneumatic dual-wheel test rollers with 650 kPa contact tire pressure used on TH14 (left), TH60 (left) and TH36 (right) project ... 167
Figure 4.2. DCP-su profiles from compacted glacial till subgrade at US14 (from White et al.
2007a) ... 167
Figure 4.3. Regression relationships between rut depth, roller-integrated ks, and in-situ point
measurements from US14 project... 170
Figure 4.4. Relationship between rut depth and LWD measurements from TH36 project ... 171
Figure 4.5. Regression relationships between rut depth, roller-integrated CMV, and in-situ point measurements from TH60 project ... 171
Figure 4.6. Bearing capacity of a test roller wheel on a layered non-granular stratum ... 172
Figure 4.7. Comparison of DCP-suprofiles with rut depth measurements... 174
Figure 4.8. (a) Relationship between calculated qult and measured rut depth, and (b) influence of
su properties of top and bottom layers at different H to achieve a minimum qult = 1050 kPa... 175
Figure 4.9. Comparison of estimated qult from layered bearing capacity analysis and static plate
load test ... 175
Figure 5.1. Relationship between deflection measurements and calculated ELWD... 180
Figure 5.2. Dynatest 3031, Keros, and ZFG Zorn LWD devices (left to right) ... 180
Figure 5.3. Schematic with example output of LWD devices used in this study (a) Zorn ZFG 2000 (b) Keros (c) Dynatest 3031... 181
Figure 5.4. Zorn LWD device with 300, 200, 150, and 100 mm plate diameters ... 184
Figure 5.5. Relationships between ELWD values from different devices: (a) 200-mm Keros and
Zorn, (b) 300-mm Keros and Zorn, (c) 200-mm Dynatest and Zorn, and (d) 200-mm Dynatest and Keros ... 185
Figure 5.6. Relationships between dLWD values from different devices: (a) 200-mm Keros and
Zorn, (b) 200-mm Dynatest and Zorn, and (c) 200-mm Dynatest and Keros ... 186
Figure 5.7. Frequency distribution of impact force at drop height 50 cm by Keros and Dynatest LWD devices and comparison to Zorn assumed impact force (Field Study No. 4) ... 186
Figure 5.8. Influence of plate diameter and applied stress on Zorn ELWD from field studies 3 and 4... 188
Figure 5.9. Influence of applied stress and effect of buffer stiffness on ELWD with different plate
Figure 5.10. Relationship between material stiffness and diameter of bearing plate ... 189
Figure 5.11. Effect of buffer type and stiffness on applied force for different LWD devices.... 190
Figure 5.12. Pictures of LWD testing performed in the excavation – US10 project... 191
Figure 5.13. DPI profiles and LWD tests at different depths from US10, Staples, MN ... 192
Figure 5.14. Normalized ELWD versus depth with best fit power model to show general trend. 193
Figure 5.15. Comparison of 90% confidence limits for target value based on eleven ELWD-Z2 and
ELWD-D2 measurement points with mean values calculated from random selection of three points
(Field Study 3a granular subbase layer)... 194
Figure 5.16. Schematic and pictures of soft and stiff pad setups... 197
Figure 5.17. Static plate load test applied stress-displacement curves for soft and stiff pads .... 198
Figure 5.18. Box plots of dLWD-Z2, ELWD-Z2, dLWD-D2 and ELWD-D2 measurements for different
models from 33 repeated drops... 199
Figure 5.19. LWD test in an excavation by removing loose material at the surface to a depth of about 100 to 200 mm for cohesionless materials... 203
Figure 5.20. Level surface at the bottom of the padfoot impression for non-granular materials 203
Figure 5.21. Simple linear regression relationships between ELWD-Z2 and CIV20-kg... 207
Figure 5.22. AFGB1A gyratory compactor (left) and pressure distribution analyzer (PDA) .... 209
Figure 5.23. Approach for laboratory mechanistic target value determination using gyratory compacted specimens... 210
Figure 5.24. Dry unit weight growth curves with number of gyrations at different target moisture contents – US10 granular material (USCS: SP-SM) ... 213
Figure 5.25. Dry unit weight growth curves with number of gyrations at different target moisture contents – TH 36 granular material (USCS: SM)... 214
Figure 5.26. Dry unit weight growth curves with number of gyrations at different target moisture contents – TH 36 silty clay material (USCS: ML) ... 215
Figure 5.27. Dry unit weight growth curves with number of gyrations at different target moisture contents – TH60 soil 301 (USCS: CL) ... 216
Figure 5.29. Dry unit weight growth curves with number of gyrations at different target moisture contents – TH 60 soil 305 (USCS: CL) ... 218
Figure 5.30. Dry unit weight vs. No. of gyrations for TH 60 soil 306 (USCS: CL) ... 219
Figure 5.31. Dry unit weight vs. No. of gyrations for Iowa loess (USCS: ML)... 220
Figure 5.32. Comparison of moisture-dry unit weight relationships using Proctor and gyratory compaction (at 900, 600, 300, and 100 kPa vertical pressures) methods: (a) US10 granular (USCS: SP-SM), (b) TH 36 granular (USCS: SM), (c) TH 36 silty clay (USCS: ML), (d) Iowa loess (USCS: ML), (e) TH 60 soil 301 (USCS: CL). (f) TH 60 soil 303 (USCS: CL), (g) TH 60 soil 305 (USCS: CL), (h) TH 60 soil 306 (USCS: CL) ... 221
Figure 5.33. 150 mm (left) and 100 mm (right) plate diameter Zorn LWD tests on gyratory compacted specimens... 222
Figure 5.34. LWD testing with four different boundary conditions: (a) no boundary, (b) soft polyurethane (Durometer = 20A), (c) stiff polyurethane (Durometer = 50A), and (d) rigid
gyratory compaction mold ... 222
Figure 5.35. Schematic representation of LWD testing with different boundary conditions: rigid gyratory mold and flexible mold... 223
Figure 5.36. PDA (left) and unconfined compression test (right) on gyratory compacted
specimen ... 223
Figure 5.37. Resilient modulus testing on 1:1 and 2:1 gyratory compacted specimens... 224
Figure 5.38. Procedure for inserting Shelby tube into gyratory compacted specimen to generate 2:1 height to diameter ratio specimens ... 224
Figure 5.39. ELWD-Z1 contours in relationship with moisture and dry unit weight – US 10 granular
material (USCS: SP-SM) (dLWD-Z1 = 85/ELWD-Z1) ... 225
Figure 5.40. ELWD-Z1 contours in relationship with moisture and dry unit weight – TH36 silty clay
material (USCS: ML) (dLWD-Z1 = 59.4/ELWD-Z1)... 226
Figure 5.41. ELWD-Z1 contours in relationship with moisture and dry unit weight – TH60 soil 301
material (USCS: CL) (dLWD-Z1 = 49.8/ELWD-Z1)... 226
Figure 5.42. ELWD-Z1 contours in relationship with moisture and dry unit weight – TH60 (301,
303, and 305 combined) non-granular material (USCS: CL) (dLWD-Z1 = 49.8/ELWD-Z1) ... 227
Figure 5.44. su contours in relationship with moisture and dry unit weight – TH60 non-granular
material (301, 303, and 305 combined) (USCS: CL) (su determined from empirical relationship
with DPI)... 228
Figure 5.45. Shear resistance versus number of gyrations (σo = 300 kPa) for TH 60 soil 306 (USCS: CL)... 230
Figure 5.46. Shear resistance versus number of gyrations for US10 granular material (USCS: SP-SM) (σo=300 kPa) ... 230
Figure 5.47. Influence of moisture content on τG for TH60 – soil 306 non-granular (USCS: CL)
and US 10 granular (USCS: SP-SM) materials ... 231
Figure 5.48. Influence of boundary conditions on LWD measurements on gyratory compacted specimens at different moisture contents – TH 60 soil 306 (USCS: CL)... 231
Figure 5.49. Relationships between LWD measurements and τG for different boundary
conditions – TH 60 soil 306 (USCS: CL)... 232
Figure 5.50. Influence of boundary conditions on LWD measurements on gyratory compacted specimens at different moisture contents – US10 granular material (USCS: SP-SM) ... 232
Figure 5.51. Relationship between LWD measurements and τG for different boundary conditions
– US10 granular material (USCS: SP-SM)... 233
Figure 5.52. τG G versus number of gyrations for loess (USCS: ML) ... 234
Figure 5.53. suand τG versus moisture content forgyratory compacted specimens after 100
gyrations at σo = 100, 300, and 600 kPa for loess (USCS: ML)... 235
Figure 5.54. Relationship between suand τG for loess (USCS: ML)... 235
Figure 5.55. Effect of height to diameter ratio (H/D = 1 and 2) on Mr of gyratory compacted
specimens at so = 100, 300 and 600 kPa at 100 gyrations –TH-60 soil 306 (USCS: CL) ... 238
Figure 5.56. Relationship between H/D = 2:1 and 1:1 Mr results on gyratory compacted
specimens – TH60 soil 306 (USCS: CL)... 239
Figure 5.57. τG versus number of gyrations for σo = 100, 300, and 600 compacted specimens
TH60 soil 306 (USCS: CL)... 239
Figure 5.58. Correlation between su,Mrand τG for samples with H/D = 1 and 2 – TH 60 soil 306
(USCS: CL)... 240
Figure 5.59. Results from in-situ LWD tests showing ELWD increase and dLWD decrease with
Figure 5.60. ELWD-Z1 and ELWD-Z1.5 contours in relationship with moisture and dry unit weight
with stiff boundary conditions – TH60 soil 306 material (USCS: CL) ... 242
Figure 5.61. DPIand su contours in relationship with moisture and dry unit weight with stiff
boundary conditions – TH60 soil 306 material (USCS: CL)... 242
Figure 5.62. τG contours in relationship with moisture and dry unit weight with stiff boundary
test – TH60 soil 306 material (USCS: CL)... 243
Figure 5.63. Correlations between τG and LWD/DPI measurements with different boundary
conditions – TH60 soil 306 material (USCS: CL)... 244
Figure 5.64. Relationships between laboratory ELWD-Z1 and ELWD-Z2 measurements in comparison
with Terzaghi’s theoretical relationships – TH60 soil 306 material (USCS: CL)... 245
Figure 5.65. Comparison between in-situ LWD measurements (from TH60 project test strip 3) and laboratory predicted LWD target values (TH60 soil 306 “stiff” boundary model) ... 245
Figure 5.66. Comparison between in-situ LWD measurements (from TH60 project test strips 1 and 4/5) and laboratory predicted LWD target values (TH60 soil 301, 302, 303 combined rigid boundary model) ... 246
Figure 5.67. Comparison between ELWD Mn/DOT and laboratory determined target values, and
in-situ values (see Tables above for number of observations for each dataset)... 251
Figure 6.1. Proposed verification test beds with granular and non-granular materials ... 256
Figure 6.2. IC-MV compaction growth (left) and ΔIC-MV (right) between successive passes for non-granular subgrade soil test strip 3 – TH 60... 260
Figure 6.3. Spatial map of ΔCCV between successive passes on non-granular subgrade soil test strip 3 – TH 60 ... 260
Figure 6.4. Illustration of combined specification options: lower portion IC-MVs used primarily for QC; upper 1 m with more stringent calibrations and use of IC-MVs for QC and QA ... 271
Executive Summary
This report documents the field measurements from intelligent compaction (IC) project sites, summarizes results comparing test rolling rut measurements to various IC and in-situ point measurements, provides a detailed evaluation of light weight deflectometer (LWD)
measurements and an approach to determine target values, includes recommendations for IC specification and verification procedures, and finally provides summary/conclusions and further
recommendations for implementation of IC and LWD technologies. Building on the report Field
Validation of Intelligent Compaction Monitoring Technology for Unbound Materials, Final
Report MN/RC-2007-10 by White et al. (2007a), this project was initiated with a series of five educational/training seminars for Mn/DOT and contractor personnel.
Intelligent Compaction Technology Project Level Field Studies
Four field projects were studied to investigate how IC specifications were being implemented and how IC technologies and LWD devices were being used in quality assurance/quality control (QA/QC) operations and testing. At each project site, test sections were constructed to
investigate intelligent compaction measurement value (IC-MV) versus point measurement correlations and the influence of roller operating conditions on the IC-MVs. Test sections contained non-granular and granular materials. Detailed conclusions are reported in terms of empirical correlations between the IC-MVs and point measurements using LWD, falling weight deflectometer (FWD), dynamic cone penetrometer (DCP), Clegg hammer, and piezocone cone penetration test (CPTU) test devices. Results provide a basis for linking mechanistic-empirical pavement design to construction QA/QC. A procedure was developed for calculating the
reproducibility and repeatability errors of IC-MVs. The analysis technique is independent of the IC technology and can also be applied to in-situ point measurement technologies.
Test Roller Evaluation in Relation to IC and Point Measurements
Use of IC-MVs and DCP/LWD point measurements were used to evaluate bearing capacity in terms of rut depth under test rolling for non-granular and granular subgrade layers. Comparisons were made to test roller rut depth QA criteria for the upper subgrade layer of the pavement foundation. Correlations between compaction meter value (CMV) and machine drive power (MDP) IC-MVs and point measurements show positive trends, but with varying degrees of uncertainty. Scatter in the relationships was partly attributed to differences in the measurement influence depth.
At one project site involving compaction of non-granular soils, DCP-suprofiles showed
significant vertical non-uniformity. Test rolling identified soft layers at and below the surface
(rut depths ≥ 50 mm). Based on this finding, a chart solution using layered bearing capacity
LWD Analysis and Target Value Study
Several operational aspects of LWD testing including factors influencing values and protocols for field practices were studied. Some of the key findings were that differences exist in the reported plate deflections and repeatability between manufacturers. Further, plate diameter, contact stress, and buffer stiffness affect the calculated elastic modulus values. Field testing protocols were developed to provide consistency in the field practices, and laboratory gyratory compacted specimens were tested to link moisture-density-modulus values together and as a means to establish soil specific field target values.
IC Verification and Specification Alternatives
Integrating IC-MVs into QC and QA operations will benefit from standard protocols for verification procedures and quantifying measurement errors. Verification builds confidence in the IC-MVs; and specifications that link IC-MV’s to traditional point measurements should be done with knowledge of measurement errors. Procedures suggested for verification of IC-MVs and quantifying measurement error are described in this report. One concept for verification involves a dedicated and controlled test bed at the MnROAD facility. This option would require an investment in the facility and personnel to regularly monitor the test bed values and perform maintenance as needed. A simple schematic of the test bed is provided. Another option would be to develop a highly mobile mechanical system that could simulate the range of soil conditions expected to be encountered on a project. It is envisioned that the device could be transported to a project periodically to verify the IC-MVs.
In accordance with the research tasks, three possible options are presented as alternatives to on-site calibration testing for IC machines. The premise of these options is to better assist the roller operator to target areas that need more compaction or re-work and the field engineer to target areas for QA testing. A statistically rigorous concept was also presented and is a new to create a new way of defining quality of compacted fill materials. Some key features of these options are as follows:
• Option 1 – The final pass roller MV map of a production area is used to identify “weak”
areas. The weak areas are targeted for in-situ QA testing. Acceptance of the production area is based on in-situ QA test measurements in the “weak” areas.
• Option 2 – This option requires evaluating the change in roller MV between successive
passes over a production area. Production compaction should be performed until 90% of
the production area achieves a percent change in MV of ≤ 5%. These percentages may be
adjusted based on field conditions and experience.
• Option 3 – IC and QA target values for this option are pre-selected, which can be derived
from a database of correlations from current study/literature, information from local projects, and calibration tests on test beds of known engineering properties. The contractor would use the pre-selected roller MV target values for QC, and QA is evaluated using a combination of roller data and in-situ QA test measurements.
• Option 4 – This specification approach is based on two goals: (1) that the overall level of
over the entire site, is no more than some specified maximal amount (e.g., %COV). These statements are quantified by determining the nature of uncertainty inherent in the measurement systems and then writing rules for defining degree of acceptable risk, (i.e., risk that a site which actually does not meet the goal is erroneously declared as meeting the goal based on the data.) The approach requires calibration of IC-MVs and point measurements. Site wide QA is then based on achievement of the defined critical soil engineering property based on the IC results. The advantage of this approach is that it allows for the assignment of acceptable risk and creates a framework for incentive-based pay. Although more rigorous mathematically, this option could provide a new way of characterizing compacted soils. This approach should be considered a concept and will require detailed pilot testing from multiple projects and conditions, but has the advantage of creating a consistent metric between different technologies and for defining quality. This report lays out the framework for the specification. A next step will be to evaluate this approach for large project level areas for different soil conditions and multiple roller IC systems.
A concept combining these options is presented to target more stringent compaction criteria (including uniformity) perhaps in the upper part of the embankment where it is more critical. In the long term, it is the authors’ view, however, that option 4 is the approach that holds the most promise for specification development because it will be more easily linked to performance of the compacted fill materials than the other approaches. All four approaches provide a major advancement over traditional approaches. From a practice standpoint, option 4 will take the most effort and training to implement.
Recommendations
The results of this study provided further evidence that IC technology has the potential to significantly improve construction process control and the resulting quality of compacted fill materials. To continue to make advancements and provide value to the process there are three recommendations suggested as outcomes of this study:
1. The statistically framed specification option for calibration and statistical analysis of risk is viewed as the building block of a future more robust and complete specification that is independent of IC machine technologies and point measurement technologies. Although the basic framework has been established some of the operational aspects of this
specification will need to be developed. It is recommended that a specification task force take on the role to more fully developing the operational aspects. Future research is recommended to evaluate this approach for multiple material and IC rollers.
2. The general response from field inspectors and roller operators is that the IC technology
brings value to projects and that it will improve construction efficiencies and quality. Much has been gained over the past few years in terms of experience and knowledge from the Mn/DOT field projects. This knowledge should be captured in the form of a formal training program for field inspectors and roller operators. A field inspector’s guide should be developed for quick reference on roller operations, in-situ testing, data reporting, data analysis, and corrective actions.
3. Finally, challenges still exist with making use of the field data obtained during the
implementation process is to develop tools to provide real-time data analysis in
1
Chapter 1
Introduction
1.1 Overview
Research conducted by Mn/DOT and others has indicated that intelligent compaction (IC) has tremendous potential to improve construction quality and efficiencies for contractors and field personnel. Several demonstration and pilot projects have been completed by Mn/DOT since 2005 (http://www.dot.state.mn.us/materials/researchic.html). Building on the knowledge gained from these demonstration projects, the first IC pilot specification in the U.S. was implemented on TH 64 in District 2 in 2006 which provided promising results in terms of IC measurements providing information for improved process control and quality assurance/quality control (QA/QC) (see White et al. 2007a, White et al. 2008). Additional pilot projects have since been performed by Mn/DOT that showed similar promising results. Some challenges and
opportunities remain, however, to fully benefit from implementation of this technology. For example, although IC has been specified in the contract for pilot projects, traditional test
requirements and procedures are being used for QA. A next step is to implement IC as both a QC tool for the contractor and to fully use the IC data as part of QA. In the future, it is possible that providing an incentive-based QC program could be established similar to pavement smoothness. To take the next step, improvements to selection of IC target values, linking results to test rolling rut depth measurements and mechanistic pavement design parameter values, understanding IC measurements for a wider range of materials, characterizing spatial non-uniformity, and improving data handling are some of the elements that were identified as needing work and constitute some of the key tasks of this research report. A parallel effort has been to implement light weight deflectometer (LWD) testing in lieu of traditional density testing as part of the QA/QC program for IC projects. LWD testing has advantages of being rapid and being
empirically linked to pavement design parameters and IC measurement values (IC-MVs). LWD testing also has unique implementation challenges in terms of understanding modulus-based measurements, developing standard test protocols, creating suitable target values for QA/QC, and understanding influence from moisture content. This research report addresses many of these challenges and provides results and recommendations to further improve implementation of IC and LWD technologies including ideas for improvements to IC specifications.
1.2 Project Goals/Tasks
The overall goals of this research project were to:
• Provide educate and training opportunities to Mn/DOT staff and contractors on how to
most effectively use IC and LWD technologies.
• Verify that the current IC specifications can be used on a wide range of materials and site
conditions.
2
• Refine the current IC specifications based on lessons learned from additional IC
implementation.
• Develop the link between mechanistic empirical pavement design and construction
QA/QC.
Specific tasks developed for the research effort were as follows:
• Develop procedures that could eliminate control strips prior to production compaction.
• Provide mechanistic empirical pavement design based target values for construction
QA/QC use of IC and LWD.
• Develop guidance that could be used by Mn/DOT to modify or eliminate the existing test
roller specification.
• Develop calibration procedures for IC and LWD equipment that could be adopted by
Mn/DOT.
1.3 Research Methodology
This project was initiated after completion of the study Field Validation of Intelligent
Compaction Monitoring Technology for Unbound Materials, Final Report MN/RC-2007-10, by
White et al. (2007a), and builds on key findings from the study. A series of five
educational/training seminars were conducted early in the project at the locations and on dates shown below to provide new information and experience with IC and LWD testing. Mn/DOT staff and contractors attended the seminars. Electronic files for all presentations are provided separate from this report.
1. Mn/DOT Intelligent Compaction Implementation Seminar #1, by David J. White, Ph.D.
and Pavana Vennapusa, Mn/DOT Office of Materials, Maplewood, MN, April 23, 2007
2. Mn/DOT Intelligent Compaction Implementation Seminar #2: Strategies for IC Data
Management using ArcGIS, Correlations, and Geostatistical Analysis, by David J. White,
Ph.D. and Pavana Vennapusa, Mn/DOT Office of Materials, Maplewood, MN, April 23, 2007
3. Mn/DOT Intelligent Compaction Implementation Seminar #3: Lessons Learned from IC
and LWD Testing, by David J. White, Mn/DOT District 4, Detroit Lakes, MN, May 30,
2007
4. Mn/DOT Intelligent Compaction Implementation Seminar #4: Lessons Learned from IC,
DCP and LWD Testing, by David J. White, Mn/DOT District 4, Staples, MN, June 28,
2007
5. Mn/DOT Intelligent Compaction Implementation Seminar #5: Lessons Learned from IC
and LWD Testing, by David J. White, Pavana Vennapusa, and Dan Enz, Mn/DOT
3
In addition to the technology transfer efforts, a significant effort from this study also involved roller operation, test strip construction, in-situ testing, in-ground instrumentation, laboratory testing, and interviewing field personnel/constructor/technology manufacturers. Many
individuals contributed to coordinating this work. Field studies were conducted on earthwork construction sites at the following project sites:
• TH 36, Metro District, North St. Paul, MN (S.P. 6211-81)
• US 10, District 2, Staples, MN (S.P. 7702-42)
• TH 60, District 7, Bigelow, MN (S.P. 5305-55)
• CSAH 2, Olmsted County, MN
At each site IC measurement values and in-situ point measurements were collected and
compared to assess the relationships between the various measurements and also to examine the variability observed for the measurement systems. Laboratory soil index tests, compaction tests, strength, and resilient modulus tests were performed to characterize materials. LWD devices from two manufacturers (Zorn Stendal from Germany and Dynatest from Denmark) were evaluated in this study including devices with different plate diameters. Piezocone cone penetration testing (CPTU), dynamic cone penetration testing (DCP), plate load tests (PLT), falling weight deflectometers (FWD), Clegg impact tests (CIV), and nuclear moisture-density gauge tests (NG) were also used as part of the field investigations.
The findings from the field studies provide the basis for the IC and LWD specification recommendations and test protocols.
1.4 Report Organization
This report is comprised of eight chapters. Chapter 2 describes the experimental laboratory and field testing methods used throughout the research project with test procedures referencing test standards, when applicable. Chapters 3 summarizes the field measurements from the above referenced project sites in case history format. Chapter 4 summarizes the results comparing test rolling rut measurements to various IC and in-situ point measurements. Chapter 5 provides a detailed summary of LWD measurements and an approach to determine target values for QA/QC. Chapter 6 provides recommendations for IC specification and verification procedures. Finally Chapter 7 and 8 provide summary/conclusions and further recommendations for
implementation if IC and LWD technologies. Electronic files of raw data from field/laboratory measurements are provided separate from this report.
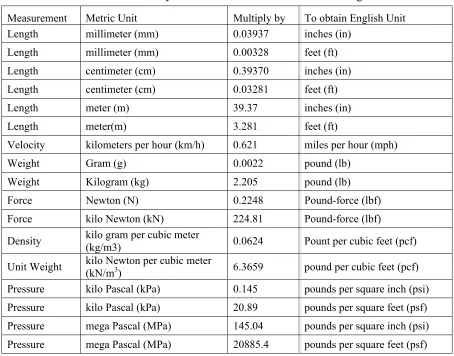
1.5 Units Conversion
4
Table 1.1. Summary of unit conversions from Metric to English
Measurement Metric Unit Multiply by To obtain English Unit
Length millimeter (mm) 0.03937 inches (in)
Length millimeter (mm) 0.00328 feet (ft)
Length centimeter (cm) 0.39370 inches (in)
Length centimeter (cm) 0.03281 feet (ft)
Length meter (m) 39.37 inches (in)
Length meter(m) 3.281 feet (ft)
Velocity kilometers per hour (km/h) 0.621 miles per hour (mph)
Weight Gram (g) 0.0022 pound (lb)
Weight Kilogram (kg) 2.205 pound (lb)
Force Newton (N) 0.2248 Pound-force (lbf)
Force kilo Newton (kN) 224.81 Pound-force (lbf)
Density kilo gram per cubic meter
(kg/m3) 0.0624 Pount per cubic feet (pcf)
Unit Weight kilo Newton per cubic meter (kN/m3) 6.3659 pound per cubic feet (pcf)
Pressure kilo Pascal (kPa) 0.145 pounds per square inch (psi)
Pressure kilo Pascal (kPa) 20.89 pounds per square feet (psf)
Pressure mega Pascal (MPa) 145.04 pounds per square inch (psi)
5
Chapter 2
Experimental Testing Methods
Two roller-integrated compaction monitoring technologies—Compaction Meter Value (CMV)
and Machine Drive Power (MDP)—were evaluated in this research study. Several in-situ testing
methods were employed in the field studies. This chapter provides a brief overview of the IC measurements and the in-situ testing procedures.
2.1 Roller-Integrated Compaction Measurements
2.1.1 Compaction Meter Value (CMV) and Resonant Meter Value (RMV)
Caterpillar 12-ton CS-563 and 19-ton CS-683 smooth drum rollers were used in this study. These rollers were instrumented with accelerometers to determine Geodynamik CMV and RMV by measuring drum accelerations in response to soil behavior during compaction operations. Settings available on the machines are summarized in Table 2.1.
CMV is defined as the ratio between the amplitude of the first harmonic and the amplitude of the fundamental frequency (Equation 2.1) (Thurner and Sandström, 1980). An increase in CMV indicates increasing compaction.
1
0
A
CMV C
A
= ⋅ (2.1)
where, C = constant, A1 = acceleration of the first harmonic component of the vibration, and A0
= acceleration of the fundamental component of the vibration (Sandström and Pettersson, 2004). CMV is a dimensionless parameter that depends on roller dimensions (i.e., drum diameter, weight) and roller operation parameters (i.e., frequency, amplitude, speed). CMV at a given point indicates an average value over an area whose width equals the width of the drum and length equal to the distance the roller travels in 0.5 seconds (Geodynamik ALFA-030).
6
RMV which is calculated using Equation 2.2, where A0.5 = subharmonic acceleration amplitude
caused by jumping (the drum skips every other cycle). According to Brandl and Adam (2004), RMV > 0 indicates that the drum is a double jump, rocking or chaotic mode. For a CS-563 machine used on TH64 project (see Vennapusa and White 2009b), RMV > 2 was used a practical cut-off value for transition between continuous contact and double jump.
0.5
0
A
RMV C
A
= ⋅ (2.2)
Table 2.1. Summary of measurement values and settings on the machines used
Parameter Description
Measurement Value CS563 and CS68: CMV CP563: MDP
Frequency
CS563 and CS683: 33 Hz (nominal) [31.8 ± 0.2 Hz measured]
CP563: 30 Hz (nominal) [not reported in the output]
Amplitude
CS563 and CS683: nominal 0.85 mm (low amplitude) and 1.70 mm (high amplitude)
CP563: nominal 0.85 mm (low amplitude) and 1.87 mm (high amplitude)
7
Table 2.2. Observed modes of vibratory roller drum (Adam 1997)
Drum Motion
Drum-Soil
Interaction Operation Mode
Validity of compaction
values
Soil Stiffness Continuous
Contact
Continuous
Contact Yes
Low
Partial Uplift Yes
Double Jump Yes
Periodic Periodic loss of contact
Rocking Motion No
Chaotic loss of contact Non-periodic Chaotic Motion No High
2.1.2 Machine Drive Power (MDP)
CP-563, CP-56, and CP-662 padfoot rollers equipped with MDP system (Figure 2.2) were used in this research study. Controlled field studies documented by White and Thompson (2008), Thompson and White (2008), and Vennapusa et al. (2009) verified that roller-integrated machine drive power (MDP) can reliably indicate soil compaction for granular and non-granular soils. The basic premise of determining soil compaction from changes in equipment response is that the efficiency of mechanical motion pertains not only to the mechanical system but also to the physical properties of the material being compacted. MDP is calculated using Equation 2.3.
MDP Pg WV sin a
(
mV b)
g
α
⎛ ⎞
= − ⎜ + ⎟− +
⎝ ⎠ (2.3)
where, Pg = gross power needed to move the machine (kJ/s), W = roller weight (kN), a =
machine acceleration (m/s2), g = acceleration of gravity (m/s2), α = slope angle (roller pitch from a sensor), V = roller velocity (m/s), and m (kJ/m) and b (kJ/s) = machine internal loss
coefficients specific to a particular machine (White et al. 2005). MDP is a relative value referencing the material properties of the calibration surface, which is generally a hard
compacted surface (MDP = 0 kJ/s). Positive MDP values therefore indicate material that is less compact than the calibration surface, while negative MDP values would indicate material that is more compacted than the calibration surface (i.e. less roller drum sinkage).
The MDP results presented in this research study (here after referred to as MDP*) are modified using Equation 2.4 and adjusted between 1 and 150. The calibration surface with MDP = 0 (kJ/s) is scaled to MDP* = 150, and a soft surface with MDP = 111.86 (kJ/s) is scaled to MDP* = 1 (from email communication with Mario Souraty, Caterpillar, Inc. October 2007). Therefore, with increasing compaction MDP decreases and MDP* increases.