Stress developments within a backfilled mine stope and the lateral loading on the barricade
267
0
0
Full text
(2) Stress Developments within a Backfilled Mine Stope and the Lateral Loading on the Barricade. By Sankha Darshanath Widisinghe B.Sc.(Eng) Hons. This thesis submitted for the Degree of Doctor of Philosophy. School of Engineering and Physical Sciences James Cook University. December 2014.
(3) STATEMENT OF ACCESS I, the undersigned, the author of this thesis, understand that James Cook University will make it available for use within the University Library and, by microfilm or other means, allow access to users in other approved libraries. All users consulting this thesis will have to sign the following statement: In consulting this thesis, I agree not to copy or closely paraphrase it in whole or in part without the written consent of the author; and to make proper public written acknowledgement for any assistance which I have obtained from it.. Beyond this, I do not wish to place any restriction on access to this thesis.. 01/12/2014 …………………………. Date. iii.
(4) STATEMENT OF ORIGINAL AUTHOURSHIP. DECLARATION. I declare that this thesis is my own work and has not been submitted in any form of another degree or diploma at any university or other institution of tertiary education. Information derived from the published or unpublished work of others has been acknowledged in the text and a list of references is given.. 01/12/2014 …………………………. Date. iii.
(5) PUBLICATIONS DURING CANDIDATURE Journals . Widisinghe, S. and Sivakugan, N. (2014). Vertical Stress Isobars for Trenches and Mine Stopes Containing Granular Backfills. International Journal of Geomechanics, 14(2), 313-318. doi: 10.1061/(ASCE)GM.1943-5622.0000321. . Widisinghe, S. and Sivakugan, N. (2014). Vertical stresses within granular materials in containments International Journal of Geotechnical Engineering, 8(4), 431-435. doi: 10.1179/1939787913Y.0000000031. . Widisinghe, S. and Sivakugan, N. (2014). Vertical stress isobars for silos and square backfilled mine stopes. International Journal of Geomechanics. (accepted manuscript). . Sivakugan, N. and Widisinghe, S. (2013). Stresses Within Granular Materials Contained Between Vertical Walls. Indian Geotechnical Journal, 43(1), 30-38. doi: 10.1007/s40098-012-0029-z. . Sivakugan, N., Widisinghe, S. and Wang, V. (2014). Vertical Stress Determination within Backfilled Mine Stopes. International Journal of Geomechanics, 14(5), 06014011. doi: 10.1061/(ASCE)GM.1943-5622.0000367. Refereed Conference Proceedings . Widisinghe, S. and Sivakugan, N. (2012). Vertical Stresses within Granular Materials in Silos. In Narsilio, G., Arulrajah, A. & Kodikara, J. (Ed.), Ground Engineering in a Changing World: 11th Australia - New Zealand Conference on Geomechanics (pp. 590-595). Melbourne, Australia: Australian Geomechanics Society and New Zealand Geotechnical Society.. . Widisinghe, S., Sivakugan, N. and Wang, V. Z. (2013). Laboratory investigations of arching in backfilled mine stopes. In Leung, C. F., Goh, S. H. & Shen, R. F. iv.
(6) (Ed.), 18th Southeast Asian Geotechnical Conference Cum Inaugural AGSSEA Conference (pp. 741-746). Singapore: Research Publishing. . Widisinghe, S., Sivakugan, N. and Wang, V. Z. (2014). Loads on barricades in hydraulically backfilled underground mine stopes. In Potvin, Y. & Grice, T. (Ed.), MineFill 2014: 11th International Symposium on Mining with Backfill (pp. 123134). Perth, WA, Australia: Australian Centre for Geomechanics, University of Western Australia.. v.
(7) ACKNOWLEDGEMENTS Firstly I would like to acknowledge the support of my wonderful family and relatives throughout the period of my studies. To my parents as well as sister and brothers who understood my intentions to pursue for PhD and supported back from home, I’m forever grateful their support and the understanding throughout this long journey. To my supervisor Associate Professor Nagaratnam Sivakugan, indeed a professor in the way he would interpret the complex aspects in Geomechanics with fundamental knowledge. Thank you Professor Siva, for being a real mentor and providing continuous support from the beginning till the end of my thesis. My co-supervisor, Dr. Vincent Z. Wang, whose guidance into numerical simulation aspects were very helpful throughout. Thanks to all academic and technical staff in School of Engineering and Physical Sciences, especially to senior engineering laboratory technicians Mr. Warren O’Donnell and Mr. Tony Skalecki for their ongoing patience with my style of test design and testing within the laboratory. Thanks to Ms. Kellie Johns at Teaching and Learning development for the discussions provided on my research proposal and to the graduate research school and Dr. Liz Tynan on organising academic writing workshops. Also, my university colleagues (Chana, Dushyanth, Peter, Manish, Om, Satheesh, Niroshan, Dhanya, Shaun, Rhys, Mohammad and Sepideh) and the school support staff (Melissa and Alison) provided support as well as company during my candidature. Also the friends and families at Townsville (the home away from home) should be thanked for their love, company and laughs during my stay. Bhanuka, Dinusha, Chamila, Samanthi, Chana, Susanthi, Muditha, Niranjan, Sudarshana, Nilanthi, Tony, Asanka and Udeshika, I feel very fortunate to spend with you guys during my stay in Townsville. I wish to acknowledge the JCU postgraduate research scholarship, which provided a living allowance during my studies as well as the financial support received from my. vi.
(8) school (Student Support Account) and the Graduate Research Scheme funds to support my academic and conference travel expenses. Finally, I also wish to express my sincere love and gratitude to my beloved wife, Nadeesha, for her understanding and endless love throughout the duration of my studies and keeping me fed during long hours of writing. Thank you for being a great companion on this journey.. vii.
(9) ABSTRACT Mine backfilling, filling of underground mined voids with processed tailings, is an integral process within the mining cycle and brings multiple benefits. Engineered barricades are constructed, to retain the backfill within the mined void (stope), across the horizontal drives before backfilling. Failure of such a slurry retaining barricade not only endangers the miners’ lives but also has led to many financial losses. Correct engineered design of barricade would bring safety and efficiency to the mining operation. The purpose of this thesis is to critically assess the arching and stress developments within backfilled stopes and drives and to develop a methodology to estimate the loads onto barricades, synthesizing analytical, numerical and laboratory studies. The arching theory is revisited and analytical equations are established, with limit equilibrium analysis method, for the vertical stress determination within the stope, considering the stope perimeter to the cross sectional areas as the basis. Numerical simulations were carried out to record the vertical stress at the bottom of the stope, which is a unique way of stress recording and has not been identified by previous studies. Although the lateral variation of vertical stress is well understood, there is a lack of simplified models to estimate the vertical stress at any point within the backfilled structure. Vertical stress isobars, were created with the use of numerical simulations, enable to estimate the vertical stress at any point within a backfilled structure up to a depth of six times the width. This has been extended to axisymmetric situations that can represent grain storage silos. A novel laboratory model was developed to identify the factors affecting lateral load on barricade as well as to measure the variation of the barricade loads with the change of barricade location within the drive (offset distance) and the effect of barricade width. Transducers were used to measure the horizontal normal stress on the barricade and the vertical stress at the stope centre and the stope corner. With laboratory tests, it is. vii i.
(10) observed that the barricade stress decreased with the offset distance and increased with the drive width. Then the barricade stress is estimated with modified analytical equation, which considers the equilibrium of a vertical layer element. Additionally, three dimensional numerical simulations were carried out to replicate the laboratory tests. The barricade stress estimated from analytical equations, numerical simulations and laboratory tests varied within a narrow range for all three approaches but the stress estimations were deviated at the stope entrance because of the continuum approach. Finally, an empirical equation to estimate the barricade stress in full scale mine backfilling situations was proposed with the test results, considering the offset distance, the drive width and the vertical stress at the stope centre. In order to improve the understanding of the stress variation within a backfilled stope, the previous laboratory models were modified to measure the average vertical stress and the horizontal stress on the stope wall. The vertical stress variations from laboratory model tests showed two distinct regions of vertical stress deviation, the upper region showing an exponential variation followed by a linear variation in the lower region of the stope. In contrast, the arching theory as well as finite difference numerical simulations use the continuum approach and predict an asymptotic vertical stresses achieved at large depths. Additionally, laboratory model tests revealed that the lateral pressure coefficient is not a constant along the depth. The deviations occurred as the cohesionless granular material differs from the concept of continuum approach considered in arching theory as well as in finite difference numerical simulations. Therefore, an alternative analytical solution, considering the particulate approach and inter-particle forces, was proposed. The vertical stress variation within a backfilled stope or silo, as studied through laboratory model test, could successfully match the new analytical solution which considered the presence of intermediate arching conditions with the packing of cohesionless granular material.. ix.
(11) Table of Contents Abstract ............................................................................................................................ viii List of Figures .................................................................................................................. xiii List of Tables ................................................................................................................... xxi Abbreviations .................................................................................................................. xxii List of Symbols .............................................................................................................. xxiii Chapter 1 ............................................................................................................................. 1 Introduction ......................................................................................................................... 1 1.1 General ...................................................................................................................... 2 1.1.1 Mining ................................................................................................................ 2 1.1.2 Geomechanics in underground mining .............................................................. 5 1.1.3 Mine backfilling ................................................................................................. 6 1.2 Problem statement ..................................................................................................... 9 1.3 Objectives and scope of research ............................................................................ 10 1.4 Relevance of research ............................................................................................. 11 1.5 Thesis overview ...................................................................................................... 12 Chapter 2 ........................................................................................................................... 15 Literature Review.............................................................................................................. 15 2.1 Overview of mine backfill literature ....................................................................... 16 2.2 Hydraulic fills – properties ..................................................................................... 17 2.2.1 Friction angle ................................................................................................... 19 2.2.2 Interfacial friction angle ................................................................................... 20 2.3 Barricade types and failures .................................................................................... 21 2.3.1 Brick barricades ............................................................................................... 22 2.3.2 Shotcrete barricades ......................................................................................... 23 2.3.3 Barricade failure and mechanisms ................................................................... 23 2.3.4 Numerical modelling of barricade ................................................................... 27 2.4 Numerical simulations for backfilling and estimations of loads onto the barricade28 2.5 Arching within backfills ......................................................................................... 32 2.5.1 In situ and model stress measurements ............................................................ 37 2.5.2 Assumption of uniform stress .......................................................................... 39 2.5.3 Lateral pressure coefficient .............................................................................. 40. x.
(12) 2.5.4 The use of Ktanδ as a measure of arching ....................................................... 42 Chapter 3 ........................................................................................................................... 44 Vertical Stresses in Vertical Containments....................................................................... 44 3.1 General .................................................................................................................... 45 3.2 Generalised Marston’s equation ............................................................................. 46 3.3 Setup and material description ................................................................................ 50 3.4 Data interpretation .................................................................................................. 53 3.4.1 Shear stresses along the wall: .......................................................................... 54 3.4.2 Average normal stress at the base: ................................................................... 55 3.5 Numerical simulation of laboratory scale backfilled stope..................................... 58 3.5.1 FLAC/FLAC3D simulation packages and capabilities ..................................... 58 3.5.2 Modelling methodology ................................................................................... 60 3.6 Vertical stress variation while filling and after filled ............................................. 63 3.7 Results from laboratory tests and FLAC for backfilled mine stopes ...................... 67 3.7.1 Vertical stress variation.................................................................................... 68 3.7.2 Vertical and shear stress variation within region 1 .......................................... 70 3.7.3 Vertical and shear stress variation within region 2 .......................................... 71 3.7.4 Sand and hydraulic fills - vertical stress variation ........................................... 72 3.7.5 Vertical stress variation with the size of the stope ........................................... 74 3.8 Calculated lateral pressure coefficient (Kcalc) ......................................................... 76 3.9 Estimation of vertical stress variation for plane strain conditions .......................... 77 3.10 Summary and conclusions .................................................................................... 80 Chapter 4 ........................................................................................................................... 84 Vertical Stress Isobars for Backfilled Structures .............................................................. 84 4.1 General .................................................................................................................... 85 4.1 Sensitivity study for parameters used with simulations .......................................... 88 4.1.1 Influence of friction angle ................................................................................ 90 4.1.2 Young’s modulus and Poisson’s ratio.............................................................. 92 4.1.3 Interfaces and interfacial friction angle ........................................................... 97 4.1.4 Dilation angle and cohesion ........................................................................... 100 4.2 FLAC simulation procedure ................................................................................. 101 4.3 Stress isobars for plane strain conditions and validation ...................................... 103 4.4 Stress isobars for axisymmetric conditions and validation ................................... 108 4.5 Summary and conclusions .................................................................................... 117. xi.
(13) Chapter 5 ......................................................................................................................... 119 Stress Developments within a Backfilled Drive and the Lateral Loading on the Barricade ......................................................................................................................................... 119 5.1 General .................................................................................................................. 120 5.2 Laboratory test design ........................................................................................... 122 5.2 Earth pressure cells – installation and calibration................................................. 125 5.2.1 Earth pressure cells installation ..................................................................... 125 5.2.2 Calibration of earth pressure cells.................................................................. 126 5.3 Laboratory test methodology ................................................................................ 130 5.3.1 Methodology to evaluate the variation of vertical stress ............................... 130 5.3.2 Methodology to evaluate the barricade stress variation with offset distance 130 5.3.3 Methodology to evaluate the barricade stress variation with drive dimensions ................................................................................................................................. 130 5.3.4 Methodology to evaluate the barricade stress variation with drive shape ..... 131 5.4 Analytical equations to estimate stresses on barricade ......................................... 131 5.4.1 Derivation of analytical equation to estimate the barricade stress ................. 133 5.5 Numerical (FLAC3D) simulations for laboratory tests .......................................... 135 5.6 Results and analysis .............................................................................................. 138 5.6.1 Variation of vertical stress at bottom and lateral stress ratio ......................... 139 5.6.2 Barricade stress variation with offset distance............................................... 141 5.6.3 Variation of barricade stress with drive dimensions ...................................... 144 5.6.4 Variation of barricade stress with drive shape ............................................... 145 5.6.5 Comparison of barricade stress estimated with analytical equations, numerical simulations and laboratory tests .............................................................................. 146 5.7 Extension of simulations to full scale mine stopes ............................................... 150 5.8 Summary and conclusions .................................................................................... 153 Chapter 6 ......................................................................................................................... 155 Estimation of Stresses within Backfilled Containments: An Analytical Approach ....... 155 6.1 General .................................................................................................................. 156 6.1 Theoretical assumptions with continuum approach .............................................. 157 6.1.1 Horizontal layer element and uniform vertical stress .................................... 157 6.1.2 The lateral pressure coefficient -K ................................................................. 158 6.2 Modified Butterfield (1969) solution for particulate approach ............................. 159 6.2.1 Contacts and contact angle............................................................................. 160 6.2.2 Arching factor- F ........................................................................................... 162. xii.
(14) 6.2.3 Derivation of analytical solution.................................................................... 163 6.3 Analytical equations for inter-disk forces ............................................................. 165 6.4 Sensitivity of the model ........................................................................................ 169 6.4.1 Vertical stress outputs and comparison with arching theory ......................... 171 6.4.2 Lateral variation of vertical stress .................................................................. 173 6.4.3 Variation of lateral pressure coefficient ......................................................... 175 6.5 Comparison of laboratory tests with analytical solution....................................... 176 6.7 Advantages and limitations of proposed numerical approach .............................. 178 6.8 Summary and conclusions .................................................................................... 180 Chapter 7 ......................................................................................................................... 183 Summary, Conclusions and Recommendations for Future Research ............................. 183 7.1 Summary ............................................................................................................... 184 7.2 Conclusions ........................................................................................................... 189 7.3 Recommendations for future research .................................................................. 192 References ....................................................................................................................... 195 APPENDICES ................................................................................................................ 211 APPENDIX A ................................................................................................................. 212 The FLAC3D code used to simulate laboratory studies ......................................... 222 APPENDIX B ................................................................................................................. 235. xii i.
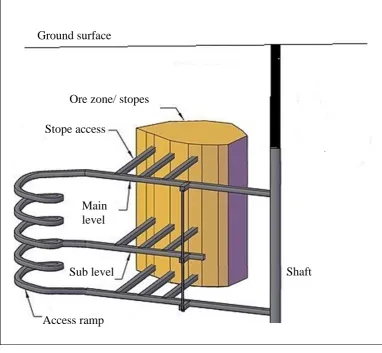
(15) List of Figures. Figure. 1.1. Idealised infrastructure in an underground mine, showing the basic elements. around a stope (source: www.wikipedia.com) .................................................................... 3 Figure 1.2. Open stoping sequence with backfilling showing the barricade ...................... 4 Figure 1.3. Fatalities in Australian mining industry, as reported by Mineral Council of Australia for 1999 to 2009; (a) fatalities breakdown due to cause and (b) geomechanically caused fatalities are categorised based on the location ........................... 5 Figure 1.4. Plan view related to egg crater pattern stoping sequence at Mount Isa Mines (reproduced from Simpson (2007)) .................................................................................... 8 Figure 2.1. Grain size distribution of Australian backfills that were tested at James Cook University (Sivakugan et al. 2006) ................................................................................... 18 Figure 2.2. Failure profiles as identified by previous researchers; (a) flexural failure or diagonal cracks, (b) punching failure and (c) shear failure .............................................. 24 Figure 2.3. Flexural failure pattern of a brick barricade (Grice 1989) ............................. 24 Figure 2.4. Shear failure appears on the barricade top (Revell and Sainsbury 2007b) ..... 25 Figure 2.5. The punching failure is shown with failed brick barricade (Grice 1998) ....... 26 Figure 2.6. The barricade load variation with centrifuge tests (Mitchell 1992), analytical equations (Li and Aubertin 2009) and numerical simulations (FLAC3D); (a) set back distance of 0 mm and (b) set back distance of 100 mm .................................................... 31 Figure 2.8. Vertical stress variation on a corn filled silo, as measured by Janssen 1895 . 34 Figure 2.9. Maximum vertical stress variation from Handy (1985) and Singh et al. (2011) equations ........................................................................................................................... 36 Figure 2.10. Lateral stress measurement within silos; (a) when filled with coal and (b) when filled with barley ..................................................................................................... 37 Figure 2.11.The Laboratory test setup to model the average stress variation used by Ting et al. 2012; (a) photograph and (b) schematic diagram (Ting 2011) ................................ 38 xii i.
(16) Figure 2.12. Average vertical stress variation for a rectangular stope backfilled with sand, as obtained by Ting (2011) ............................................................................................... 39 Figure 2.13. The use of Mohr's circle to define the lateral pressure coefficient as suggested by Krynine (1945) ............................................................................................ 42 Figure 3.1. Schematic diagram to derive analytical equations for stress within a backfilled stope; (a) backfilled stope dimensions and (b) isolated horizontal layer element ............ 47 Figure 3.2. Laboratory test setup; (a) photograph and (b) schematic diagram ................. 51 Figure 3.3. Grain size distribution for sand and HFs, obtained from Malvern MastersizerX instrument...................................................................................................................... 52 Figure 3.4. Detailed interpretation of calculations: (a) one layer, (b) after 6 layers, (c) after 7 layers, and (d) after all 10 layers ........................................................................... 54 Figure 3.5. Variation of normalised vertical, shear and horizontal stress according to Table 3.2 ........................................................................................................................... 56 Figure 3.6. Vertical stress variation along centre with number of elements across the halfwidth ; E = 50 MPa, ν =0.2 and γ = 14.675 kN/m³ ........................................................... 62 Figure 3.7. Vertical stress variation along centre with number of layers used; E = 50 MPa, ν =0.2 and γ = 14.675 kN/m³ ................................................................................... 63 Figure 3.8. Vertical stress at centre versus depth, for a narrow stope of 4B deep: E = 50 MPa, ν = 0.2 and γ = 14.675 kN/m³ .................................................................................. 64 Figure 3.9. Maximum vertical stress variation for vertical aspect ratios with depth H = 2B, 3B, 4B, 5B and 6B.:: E = 50 MPa, ν = 0.2 and γ = 17.65 kN/m³ ............................... 66 Figure 3.10. Maximum vertical stress variation for horizontal cross sections, B/L=1 square stope, B/L= 0 - narrow stope: E = 50 MPa, ν = 0.2 and γ = 14.675 kN/m³ ........... 66 Figure 3.11. Variation of Ktanδ with when definitions for Ko and Ka is considered for rough walls ........................................................................................................................ 67 Figure 3.12. Vertical stress variation from laboratory tests and FLAC simulations are compared with analytical equations; a) circular 150 mm diameter stope with medium. xi v.
(17) rough walls, b) circular 150 mm diameter stope with rough walls, c) square 150 mm wide stope with medium rough walls and d) square 150 mm wide stope with rough walls ..... 69 Figure 3.13. Stress variation from laboratory tests are compared with analytical equations for circular and square stope of 150 mm width; (a) shear stress variation and (b) horizontal stress variation ................................................................................................. 71 Figure 3.14. Variation of stress for sand and HFs, when filled to a 150 mm wide square stope; (a) vertical stress and (b) shear stress ..................................................................... 73 Figure 3.15. Grain shape analysis through SEM; (a) highly angular grains in HFs and (b) rounded to sub-rounded grains in sand ............................................................................. 74 Figure 3.16. Vertical stress variation from laboratory tests and FLAC simulations are compared with analytical equations; (a) circular 100 mm diameter stope with medium rough walls, (b) circular 100 mm diameter stope with rough walls, (c) circular 150 mm diameter stope with medium rough walls and (d) circular 150 mm diameter stope with rough walls ........................................................................................................................ 75 Figure 3.17. Calculated K value (Kcalc) from laboratory tests; (a) sand and (b) HFs ........ 76 Figure 3.18. Vertical stress variations for square and rectangular stopes, and a linear regression is indicted for region 2 ..................................................................................... 79 Figure 3.19. Regression for region 1; for (a) B/L = 1 (square stopes) and (b) B/L = 0.2 (rectangular stopes) ........................................................................................................... 79 Figure 3.20. Estimated vertical stress variation for plane strain conditions, based on laboratory test results ........................................................................................................ 80 Figure 4.1. Orientation of principal stress directions for a narrow backfilled structure, as output with FLAC simulations.......................................................................................... 86 Figure 4.2. Variation of average vertical stress with depth for various friction angles E = 20 MPa, ν = 0.20, and γ = 17.65 kN/m³ ..................................................................... 90 Figure 4.3. Vertical stresses for selected 15 points within the fill for friction angles 30° to 50° and E = 20 MPa, ν = 0.20, and γ = 17.65 kN/m3; (a) width 0.15B from the centre, (b) width 0.25B from the centre and (c) width 0.35B from the centre. .................................. 91. xv.
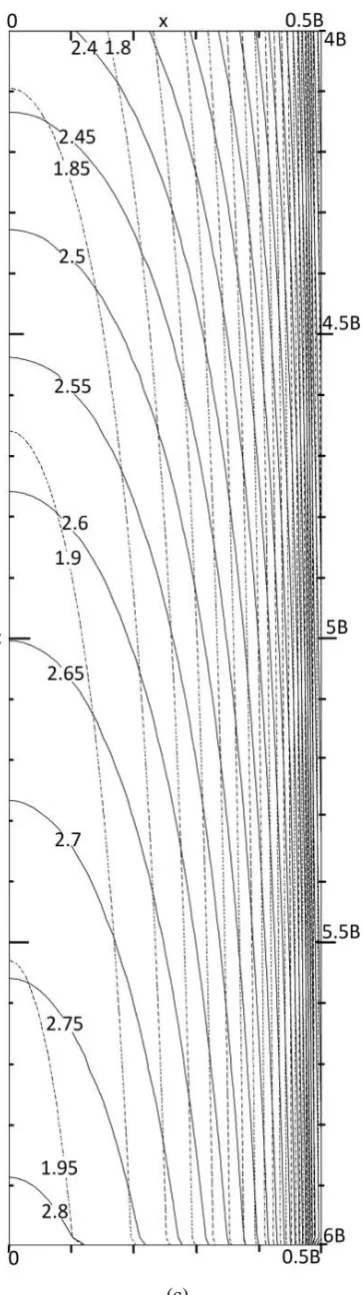
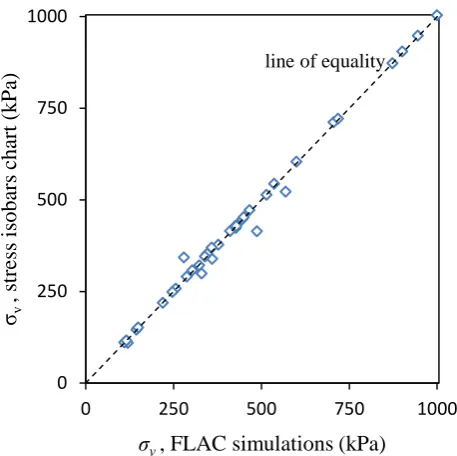
(18) Figure 4.4. Error distribution when 40° selected as the reference friction angle to estimate vertical stress within a backfilled structure ....................................................................... 92 Figure 4.5. Vertical stress variation along centre with Young’s modulus, when the model filled in layers; ν = 0.25 and γ = 17.65 kN/m³ .................................................................. 93 Figure 4.6. Stress variations for different Poisson’s ratio, when the model filled in layers, E = 50 MPa and γ = 17.65 kN/m³; (a) vertical stress at centre, (b) horizontal stress at wall and (c) horizontal stress at wall to vertical stress at centre ratio ...................................... 94 Figure 4.7.Variation of ‘elastic Ko’, with Poisson’s ratio ................................................. 95 Figure 4.8. Variation of average vertical stress for Mohr-Coulomb material and for elastic material. Analytical equation estimations are also included with Ko, Ka and ‘elastic Ko’ 97 Figure 4.9. A photograph showing the wall roughness in a mine stope (courtesy of Mr. Patrick Wilson, Ravenswood mine, Queensland). ............................................................ 98 Figure 4.10. Vertical stress variation along the centreline for different values of interfacial friction angle (E = 50 MPa, ν =0.20 and γ = 17.65 kN/m³) ............................. 99 Figure 4.11. Vertical stress variation along the centreline for different values of dilation angle (ψ) and cohesion (c) of the fill (E = 50 MPa, ν = 0.20 and γ = 17.65 kN/m³)....... 100 Figure 4.12. Stress isobars for plane strain conditions- trenches for (a) z = 0-2B, and (b) z = 2B-4B ........................................................................................................................... 104 Figure 4.12. Stress isobars for plane strain conditions- trenches for (c) z = 4B-6B........ 105 Figure 4.13. Comparison of vertical stresses estimated for selected random cases in Table 4.3 with plane strain stress isobar charts and individual FLAC simulations ........ 106 Figure 4.14. Vertical stress variation at x = 0, B/4 and B/2 for square and circular structures filled with granular materials (E = 50 MPa, ν = 0.20 and γ = 17.65 kN/m³).. 108 Figure 4.15. Axisymmetric vertical stress isobars for δ = φ; (a) z = 0 - 2Band (b) z = 2B 4B .................................................................................................................................... 110 Figure 4.15. Axisymmetric vertical stress isobars for δ = φ; (c) z = 4B - 6B ................. 111 Figure 4.16. Vertical stress isobars for δ = 0.5 φ; (a) z = 0 - 2B, (b) z = 2B - 4B, and (c) z = 4B - 6B ......................................................................................................................... 112 xv i.
(19) Figure 4.16. Vertical stress isobars for δ = 0.5 φ; (a) z = 0 - 2B, (b) z = 2B - 4B, and (c) z = 4B - 6B ......................................................................................................................... 113 Figure 4.17. Comparison of vertical stresses estimated for selected random cases with axisymmetric stress isobars and individual FLAC simulations ...................................... 114 Figure 4.18. Error of estimation, when stress isobar charts were used to estimate vertical stresses for scenarios; (a) plane strain stress isobars chart used for scenarios given on Table 4.3 and (b) axisymmetric stress isobars chart used for scenarios for given on Table 4.4.................................................................................................................................... 116 Figure 5.1. Arrangement of the test setup; (a) with square drive, (b) with circular drive, (c) EPC arrangement and (d) schematic of UDL application from MTS ....................... 124 Figure 5.2. The calibration charts by Ramirez et al. (2010) and a linear calibration drawn for readings of 'deadweights and wheat' ......................................................................... 127 Figure 5.3. The mould and setup used to calibrate EPCs; (a) close-up view with the mould and the EPC, (b) EPC loaded with dead weights after placing a fine layer and (c) details of the setup .......................................................................................................... 128 Figure 5.4. EPC Calibration results shown with calibration coefficients s and R-squared values for; (a) EPC1-200 kPa, (b) EPC2-500 kPa and (c) EPC3-1 MPa ........................ 129 Figure 5.5. The notation showing the barricade height and offset distance along with other parameters .............................................................................................................. 133 Figure 5. 6.FLAC3D model to simulate the tests conducted with MTS; (a) numerical modelling parameters and boundary conditions, and (b) interfaces used in model ........ 137 Figure 5.7. The lateral stress variation when the SD_125_75 model stope is subjected to a surcharge of 913 kPa ....................................................................................................... 137 Figure 5.8. The repeatability of tests, conducted with MTS, as analysed with four trials; (a) CD150_0 test results (b) CD150_75 test results ....................................................... 138 Figure 5.9. Vertical stress recorded at stope centre and stope edge with applied surcharge; (a) square drive attached, (b) circular drive attached, and (c) comparison of stress at centre to stress at edge .................................................................................................... 139. xv ii.
(20) Figure 5.10. The theoretical and calculated lateral pressure coefficient values are compared; (a) 75 mm wide square drive attached and (b) 75 mm wide circular drive attached ........................................................................................................................... 141 Figure 5.11. Barricade stress variation with offset distance and the best fit curve; (a) and (b) 75mm wide square drive, (c) and (d) 75 mm wide circular drive ............................. 142 Figure 5.12. Barricade stress variations, highlighting few increased stresses, as the offset distance increased; (a) for SD125 tests and (b) for CD150 tests .................................... 143 Figure 5.13. Barricade stress variation with barricade width, for offset distance of 25 mm; (a) square drives and (b) circular drives ......................................................................... 144 Figure 5.14. Barricade stress variation when shape of the drive is changed and the offset of 25 mm: (a) for surcharges of 36 kPa and 68 kPa, and (b) surcharges of 393 kPa and 523 kPa............................................................................................................................ 145 Figure 5.15. Variation of barricade stress with offset distance as compared in different surcharges; (a) q = 36 kPa, (b) q = 394 kPa and (c) q = 913 kPa ................................... 147 Figure 5.16. The variation of barricade stresses with the drive width from analytical, numerical and laboratory test results; (a) q = 394 kPa and L = 0, (b) q = 913 kPa and L = 0, (c) q= 394 kPa and L = 75 mm and (d) q =913 kPa and L = 75 mm .................... 149 Figure 5.17. The normalised barricade stress, with respect to the offset distance, from all laboratory tests with drives of 75 mm, 100 mm, 125 mm and 150 mm widths ............. 151 Figure 6.1. The forces in the disk assembly; (a) forces from surrounding disks and (b) the weight represented with two equal forces f .................................................................... 162 Figure 6.2. The force transmission at walls, when α <60°.............................................. 163 Figure 6.3. Disk arrangement in 2D space and relevant parameters .............................. 164 Figure 6.4. Disk arrangement to calculate (a) the vertical stress and (b) the horizontal stress ................................................................................................................................ 165 Figure 6.5. The disk arrangement highlighting the cases considered for calculations; each disk is identified with the respective i,j location............................................................. 166 Figure 6.6. Sensitivity of F on average vertical stress variation ..................................... 169 xv iii.
(21) Figure 6.7. Variation of vertical stress with number of disks used in the model ............ 170 Figure 6.8. Variation of vertical stress from the proposed analytical equation is compared with arching theory ......................................................................................................... 172 Figure 6.9. Variation of vertical stress along the width, for various arching factors, at a depth of 6B ...................................................................................................................... 173 Figure 6.10. Lateral variation of average stress at depths of 2B, 4B and 6B; (F = 0.002) ......................................................................................................................................... 174 Figure 6.11. Variation of calculated lateral pressure coefficient (K1) with depth for different F values ............................................................................................................ 175 Figure 6.12. The laboratory test results for B/L = 0.2 model are compared with the proposed analytical solution ........................................................................................... 176 Figure 6.13. The proposed analytical solution is matched with laboratory model test results with B/L = 0.2 ...................................................................................................... 177 Figure 6.14. The derived vertical stress variation with laboratory tests is matched with the proposed analytical solution ........................................................................................... 178 Figure A1. Load plate displacement results for tests with square drives for 75 mm and 100 mm wide drives ........................................................................................................ 212 Figure A2. Load plate displacement results for tests with square drives for 125 m and 150 mm wide drives ........................................................................................................ 213 Figure A3. The calculated lateral pressure coefficient values are compared with theoretical values; (a) 100 mm wide square drive is attached, (b) 100 mm wide circular drive is attached .............................................................................................................. 214 Figure A4. The calculated lateral pressure coefficient values are compared with theoretical values; (a) 125 mm wide square drive is attached, (b) 125 mm wide circular drive is attached .............................................................................................................. 215 Figure A5. The calculated lateral pressure coefficient values are compared with theoretical values; (a) 150 mm wide square drive is attached, (b) 150 mm wide circular drive is attached .............................................................................................................. 216 xix.
(22) Figure A6. Barricade stress variation with drive width at zero offset distance on square drives ............................................................................................................................... 217 Figure A7. Barricade stress variation with drive width at zero offset distance on circular drives ............................................................................................................................... 218 Figure A8. Barricade stress variation with drive width, for offset distance of 25 mm on square drives ................................................................................................................... 219 Figure A9. Barricade stress variation with drive width, for offset distance of 50 mm on square drives ................................................................................................................... 220 Figure A10. Barricade stress variation with drive width, for offset distance of 50 mm on circular drives.................................................................................................................. 221 Figure B1. Forces arrangements around a disk, for contact angle of 60; (a) forces from surrounding disks and (b) force transmission at walls .................................................... 236. xx.
(23) List of Tables Table 1.1. Reported backfill barricade failures in Australia ............................................... 9 Table 2.1. Density, Young's modulus and Poisson’s ratio values used with numerical simulations ........................................................................................................................ 19 Table 3.1.Geotechnical properties for hydraulic fills and sand ........................................ 53 Table 3.2. Laboratory model test data and derived vertical, shear and horizontal stress values for 150 mm x 150 mm x 900 mm stope................................................................. 57 Table 3.3. Material properties for backfill and Perspex, used in FLAC simulations ....... 61 Table 4.1. Summary of material properties used in the sensitivity study ......................... 89 Table 4.2. Parameters used with FLAC simulations to generate stress isobars .............. 102 Table 4.3. Scenarios used for verification of plane strain stress isobar charts ............... 107 Table 4.4. Scenarios used for verification of axisymmetric stress isobar charts ............ 115 Table 5.1. Geomechanical properties used with FLAC3D model for barricade bricks, rock surrounding, HF and interface ........................................................................................ 136 Table 5.2. The parameters considered for the calculation of barricade stress from the proposed empirical equation (Equations 5.18 and 5.19)................................................. 152 Table 6.1. The maximum average vertical stress compared with the number of disks used in the model..................................................................................................................... 171. xxi.
(24) Abbreviations. EPC. Earth Pressure Cells. TPC. Total Pressure Cell. CPB. Cemented Paste Backfills. UDL. Uniformly Distributed Load. DSM. Discrete Stiffness Model. DEM. Discrete Element Model. HF. Hydraulic Fills. USCS. Unified Soil Classification System. UCS. Unconfined Compressive Strength. FLAC. Fast Lagrangian Analysis of Continua. FLAC3D. Fast Lagrangian Analysis of Continua in three dimensions. JCU. James Cook University. SEM. Scanning Electron Microscope. PFC. Particle Flow Code. xxii.
(25) List of Symbols. h’. A height considered on the barricade. ca. Adhesion. F. Arching factor for disk model. σv. Average vertical normal stress. Kcalc. Calculated lateral pressure coefficient. Cc. Coefficient of curvature. Cu. Coefficient of uniformity. c. Cohesion. Ad. Cross sectional area of the drive/barricade. A. Cross sectional area of the stope. ρ. Density of the fill. z. Depth to a particular point, within the stope. ψ. Dilation angle. d. Disk diameter. f. Disk weight components. D10. Effective grain size. n. Fill load measured by the balance. m. Fill load measured by the load cell. φ. Friction angle. H. Height of the stope or structure. x. Horizontal distance from centre. xxiii.
(26) σhB0. Horizontal stress at base of the stope entrance. σhT0. Horizontal stress at top of the stope entrance. σh. Horizontal stress from backfill to walls. δ. Interfacial friction angle. Kkrynine. Krynine’s lateral pressure coefficient at rest. K. Lateral pressure coefficient. K0. Lateral pressure coefficient at rest. Kdl. Lateral pressure coefficient in longitudinal direction within the drive. Kdt. Lateral pressure coefficient in transverse direction within the drive. σb. Lateral stress on barricade. L. Length of the stope or structure. D50. Median grain diameter. MTS. MTS Universal Testing Machine. Kn. Normal stiffness for the interface in FLAC. p. Number of disks along the height. s. Number of disks along the width. L. Offset distance of barricade from the stope entrance. Pd. Perimeter of the drive/barricade. P. Perimeter of the horizontal layer element. ν. Poisson’s ratio. Ka. Rankine’s active earth pressure coefficient. Dr. Relative density. Ks. Shear stiffness for the interface in FLAC xxiv.
(27) Cw. Solids by weight. ni,j. The force directed horizontally from left side to the disk. Ni,j. The force directed horizontally from right side to the disk. Li,j. The force directed on an angle α from bottom left side to the disk. Mi,j. The force directed on an angle α from bottom right side to the disk. mi,j. The force directed on an angle α from top left side to the disk. li,j. The force directed on an angle α from top right side to the disk. α. The inclination of the line connecting the centres of disks to the horizontal. . The shear stress at the wall. Hd. Total height of the drive. q. Uniform surcharge. γ. Unit weight of the fill. v,. Vertical stress computed at friction angle of . v,40. Vertical stress computed at friction angle of 40°. Aw. Wall-fill contact area in a backfilled structure. w. Weight of the disk. B. Width of the stope or structure. E. Young’s Modulus. xxv.
(28) Chapter 1 Introduction. 1.
(29) 1.1 General Underground mining is the process of extracting mineral ore deposits. The massive ore bodies are divided into blocks or stopes, and the ore is mined from those stopes sequentially. The processed mineral waste is called tailings and the disposal of tailings in a safe, stable and economical manner is very important and beneficial to all stakeholders. Tailings were earlier disposed to surface impoundments, but limited availability of land area motivates one to find alternative means of tailings disposal. The void generated after mining the ore from underground is backfilled with a mixture including the processed mineral waste. The interest in mine backfilling is increasing and in some instances regulations were implemented for mandatory backfilling of mined voids considering the environmental impact from releasing mine waste to land or sea (Nantel 1998; Keen et al. 2007). For example, Jabiluka Uranium mine situated in Kakadu National Park, Australia had to direct all the tailings to underground due to lack of space for surface tailings facilities (ERA 2003). 1.1.1 Mining Mining is a major industry in Australian economy and can be classified into two categories based on the location: underground and open pit mining. Underground mining extracts the valuable ore from deep ore bodies and the ore body is accessed through ramps, shafts and tunnels (Figure 1.1). In contrast, open pit mining extracts the mineral ore from the earth by removal of ore from an open pit or open cut mining, where the overburden is relatively thin. Mineral distribution, ore grade, ore deposit dimensions, prevailing rock conditions and dilution rates decide the optimum mining method to be adopted in underground mining (Brady and Brown 1985). Deep massive ore bodies can be mined through open stoping methods (sublevel open stoping, secondary or tertiary stoping and vertical crater retreat) with the use of backfilling.. 2.
(30) In open stoping method, the ore body is divided into sections or stopes to carry out the mining operations. Often rectangular, square or narrow sections or stopes are mined such that the previously mined stopes are filled before mining the next stope (Figure 1.2). Open stoping mining method accounts for 60% of total underground tonnage in Canada (De Souza et al. 2003) and also a significant quantity in Australia (Grice 2001). Stope widths range from 2.7 m to 25 m and heights range from 11 m to 180 m (Evans et al. 2007). In open stoping, there are two production methods: (1) short hole mining, which is similar to development mining, except that it occurs in ore, and (2) long hole mining, which requires two accesses within the ore at different elevations to drill holes between the two levels and then production is carried out.. Ground surface. Ore zone/ stopes Stope access. Main level. Sub level. Shaft. Access ramp. Figure 1.1. Idealised infrastructure in an underground mine, showing the basic elements around a stope (source: www.wikipedia.com) 3.
(31) The blasted ore is removed from the bottom level via drives or drifts used as machinery paths and providing the link between stopes and other underground facilities (Figure 1.2). Usually drives are created only to cater to the underground traffic, and are barricaded before backfilling the stope. As it is required to support the host rock after exploitation the stope, backfill can be used as a bulking agent. When backfill is used with underground mining, a number of extraction strategies are available to optimize pillar recovery. In general, a stoping sequence is driven by ore grade requirements, operational issues such as existing development and fill availability, as well as induced stress considerations (Villaescusa 2003).. Rock. Width - B Length - L. Depth - H. Backfilling stope. Previously backfilled stope or rock Barricade. Transport levels. Figure 1.2. Open stoping sequence with backfilling showing the barricade. 4.
(32) 1.1.2 Geomechanics in underground mining The underground in situ rock stress conditions are affected by mining because the confinement conditions are changed in the stope vicinity. However, managing the host rock stress conditions is essential to maintain the safety and operational efficiency. The importance of underground geomechanics related to mining can be highlighted further with Figure 1.3, which summarises the fatalities related to Australian mining as. number of falalities. reported by Mineral Council Australia’s annual safety and performance reports from 65 60 55 50 45 40 35 30 25 20 15 10 5 0. Geomechanical. Machineries, driving. supports, natural. (a) 30. number of falalities. 25 20 15 10 5 0. Underground Open-pit. other. (b). Figure 1.3. Fatalities in Australian mining industry, as reported by Mineral Council of Australia for 1999 to 2009; (a) fatalities breakdown due to cause and (b) geomechanically caused fatalities are categorised based on the location 5.
(33) 1999 - 2009. In Figure 1.3, any cause of fatality related to geomechanics, such as rock falls, rock bursts and fill barricade failures are considered as geomechanical. Any fatality originated with machinery manoeuvring and repair activities is counted under ‘machineries, driving’. The other causes, such as inadequate handling of instrument and natural causes are categorised into ‘supports, natural’ category. Almost a quarter of the fatalities during 1999 - 2009, were caused by geomechanical issues (Figure 1.3). Further, fatalities due to geomechanical causes are classified with the location in Figure 1.3b, which highlights that 80% of the geomechanically caused fatalities occurred within underground operations. Several fatalities are counted from backfill runoffs occurring with barricade failures. Therefore, the underground geomechanics especially related to mine backfilling needs to be well understood for safe and efficient mining operations.. 1.1.3 Mine backfilling Though the backfill system is often expensive, typically covering about 30% of total mining costs, reliability and flexibility of the backfill system greatly support the mining operation (Bloss 2014). Backfill is an integral part of the mining cycle and brings production, safety and financial performance benefits (Evans et al. 2007). Backfill offers a versatile solution for waste disposal and sometimes uses surface pit waste or quarried aggregates as constituents to enhance the strength and flow properties of the backfill. In every backfilling situation, there may be one or more drives needing barricading to isolate the stope (Figure 1.2). Backfilling is a concurrent operation with mining and cannot be delayed as the next mining cycle depends on backfilling the stopes. Thus, development of the efficient backfill system can lower the cost of mining and bring operational benefits to the mining process. The main purposes of mine backfilling are as follows.. 6.
(34) . To achieve local and regional ground support. . To maximise ore extraction. . To control the ore dilution. . To dispose waste in an effective and environmentally friendly manner. . To reduce the need and maintenance of surface tailings ponds. . To improve ventilation and fire control aspects. . To control ground subsidence. . To acts as a working floor for the next mining cycle. The backfill quantities used per annum are high in Australia. For instance, the backfilled tonnage is two million tonnes or greater per annum (Grice 2003). The choice of materials that are utilized for fill preparation depends on the location of backfilling, availability of materials for a particular fill and prevailing ground conditions (Grice 1998a). Therefore, classified or total stream of tailings is processed and directed to mined out stopes. According to fill properties and preparation method, backfills can be divided into; . Hydraulic fills (HF). . Paste fill. . Aggregate / Rock fill. When free standing walls are not expected when mining adjacent stopes, the stopes can be filled with uncemented or slightly cemented HFs, just as a bulking agent to fill the void. Therefore, in stoping methods, the tertiary stope is usually filled with HFs. The backfilling in underground massive ore body mining is further illustrated with the egg crate pattern stope planning for 1100 ore body in Mount Isa Mines, Australia (Figure 1.4). In preparing HFs, fines (i.e., the clay fraction) are removed from total stream tailings through hydrocyclones (de-sliming) to increase the permeability to facilitate fast drainage. After preparation at surface fill plants, the fill is pumped or allowed to gravitate to underground. HF possess low to moderate in situ strength and. 7.
(35) HF placement rates can be as high as 100 – 200 t/h. Moreover, sufficient time should be left to allow draining the excessive water. Total mill tailings are used to process paste fills and about 50 - 200 t/h placement rates can be achieved. Negligible water run-offs are encountered as the water is used internally for the cementation process and often no provision is left for drainage with CPB. Higher free standing walls can be achieved with paste fills, in which the rheology is modified at the paste fill plant. However, paste fill has a more difficult rheology to manage than lower density hydraulic fill due to a higher pressure loss per unit length of pipe and a higher angle of repose when placed in a stope (Potvin 2005).. Figure 1.4. Plan view related to egg crater pattern stoping sequence at Mount Isa Mines (reproduced from Simpson (2007)) Aggregates are usually gravel size materials, which are produced in screening and pre-concentration processes. Rock fill is the crushed and screened product from the quarry or the fragments of host rock where mine developments were taking place (for example, crosscuts or development drives). Often, rock or aggregate fills are used when high strength fill is required especially for severe in situ stress conditions. Rock fill placement in stopes carried out with truck dumping for small operations, and for large. 8.
(36) operations conveyors are used to manage the placement costs. Additionally, de-slimed tailings are used solely or combined with aggregates, rock, or cement to prepare the required backfill composition.. 1.2 Problem statement Engineered barricades are built across horizontal drives to retain the backfill slurry in the stopes. Failure of such a slurry retaining barricade not only endangers the miners’ lives but also has led to many financial losses such as damage to mining equipment, underground rehabilitation due to flooding and cessation of operations for a considerable amount of time (Duffield et al. 2003; Sivakugan et al. 2006a; Yumlu and Guresci 2007). A catastrophic failure, the collapse of a hydraulic fill barricade at Bronzewing mine in Western Australia has resulted in three fatalities (Celeste 2000; Torlach 2000). Several other examples are presented in Table 1.1. Although most of the barricade failures are not reported in detail, it was evident that there is increased rate of backfill barricade failures. After all, the need to understand the stress developments within the mine stope and the need for the correct engineered design of barricade are increasing. Table 1.1. Reported backfill barricade failures in Australia Year. Incident/ Mine. Location. Consequences. References. 20032006. Twelve barricade failures. Not reported. Not reported. Helinski et al. (2011). 1998. Two barricade failures. Not reported. Not reported. Grice (1998b). 2000. Bronzewing Mine. Western Australia. Three fatalities. Torlach (2000),. 2000. Osborne Mine. Queensland. Rehabilitation. Duffield et al (2003). 2007. Two minesfive barricade failures. Not reported. Not reported. Revell and Sainsbury (2007b). Celeste (2000). 9.
(37) 1.3 Objectives and scope of research The aim of this research is to critically assess the arching and stress developments within backfilled stopes and drives and to develop a methodology to estimate the loads onto barricades synthesizing analytical, numerical and laboratory studies. The following objectives are set in order to estimate loads onto backfilled barricades. 1. To revisit the stress transfer mechanisms in hydraulic backfilled stopes 2. To identify the factors that affect the lateral load on barricade and develop suitable analytical expressions 3. To measure the variation of the barricade loads with the change of barricade location within the drive and the effect of barricade dimension on stresses in laboratory tests 4. To develop three dimensional numerical models to verify the laboratory model tests 5. To measure vertical stress in backfilled stopes and develop alternative analytical solutions to verify the test results The analytical, numerical and laboratory studies are conducted concurrently and the outcome for the barricade stress is compared for all three techniques. The agreements or deviations among the results will generate: . Improvement in the current state-of-the-art related to stress developments within backfilled mine stopes and drives,. . The concept of vertical stress isobars, and simple design charts to determine the vertical stress variations within backfilled structures including silos and stopes, and. . An alternative analytical methodology to address the stress developments within backfilled stopes.. 10.
(38) 1.4 Relevance of research Backfilling facilitates the optimization of the performance of the chosen mining method. There are numerous examples where mine production is directly related to the effectiveness and speed of filling empty stopes (Henderson et al. 1997). The overall productivity is severely constrained by the individual stope cycle times as stopes must be mined, filled and cured before an adjacent stope can be extracted. Barricades are temporary structures that need to support the loading from the backfill placed onto the stope. The water introduced into the stope, especially with hydraulic fill, can lead to higher hydraulic heads and the safety of the barricade can be jeopardized. Fill retaining barricades are normally constructed to isolate the backfilling stope. There are several methods available to estimate the vertical stresses within the backfilled stopes and the loads on the barricade, such as analytical, in situ stress measurements, physical modelling and numerical simulations. Analytical methods allow a preliminary assessment of the anticipated loads onto the barricade. However, the assumptions and simplifications to the geometry, barricade or rock interface properties, and the properties of the barricade limit the confidence in these design estimations for field application. Barricades vary in thickness, which is determined by the drive dimensions and loadings from backfill. However, when there is lack of understanding of the geomechanics related to backfill, barricade stresses are overestimated, and thus there is a tendency to construct larger barricades than necessary. For example, one metre thick heavily reinforced concrete barricades have been built (Mitchell et al. 1975). Construction of a such large barricade is not only expensive, but also causes considerable delays in the mining cycle due to time taken for the construction and curing of the barricade (Mitchell et al. 1975). Therefore, correct estimates of loads onto the barricades would lead to the optimum barricade design and favour the speed of the mining cycle.. 11.
(39) Therefore, while it is necessary to optimize the thickness of the barricade and to minimize time taken for the construction, the barricade needs to be able to sustain the loads induced by backfill. This study will investigate the forces acting on barricades in order to quantify the requirements for the barricade dimensions. Dry, uncemented hydraulic fills are considered in this study. Realistic determination of the vertical stresses within the mine stope and drives can pave the way to improving the design of barricades as well as minimise the risks associated with underground mining. Therefore, optimising of the design of barricades will balance the performance and safety concerns in underground mining. Furthermore, the stress developments onto bulkheads when the stope is filled with CPB would be different to the stresses from this study.. 1.5 Thesis overview Chapter 1 provides the introduction to mine backfilling and discusses the significance of studying the stress developments within backfilled mines and drives to enhance the understanding on loads acting on the barricades. Chapter 2 reviews the literature related to mine backfilling and barricade failures. The latter section of Chapter 2 reviews the analytical equations used with arching theory and reliability of the assumptions. Chapter 3 focusses on understanding the in situ stress state within a backfilled mine stope. First section summarises the laboratory tests carried out with square, circular and rectangular model stopes and identifies that the vertical stress variation from laboratory model tests shows a linear increase with depth without reaching an asymptotic vertical stress even at large depths. Next, finite difference numerical simulations were used to replicate the backfilling into model stopes and at the end of Chapter 3, vertical stresses calculated from analytical, numerical and laboratory test approaches were compared and the implications are discussed.. 12.
(40) Chapter 4 emphasizes the lateral variation of vertical stress within backfilled structures, which is not generally estimated by analytical equations. Numerical simulations were used to carry out a sensitivity analysis of the fill parameters that influence the vertical stress within a stope. The vertical stress contours within the backfill are presented as isobar charts. The proposed plane strain stress isobars can be used to estimate stresses in plane strain backfill situations, such as backfilled narrow mine stopes and backfilled trenches. Also, the proposed axisymmetric stress isobars can be used to estimate stresses in circular structures and the axisymmetric stress variation closely matches the vertical stress variation in backfilled structures with square cross section in plan. Additionally, an equation is proposed with interpolation to estimate vertical stresses in mine stopes with other cross sectional shapes such as rectangles. After the understanding of the stresses within the backfilled stope, the load distribution from stope to the drive is studied in Chapter 5. A laboratory test apparatus is designed and manufactured with provisions to insert drives of different widths as well as to vary the distance from stope to the barricade. This study focused on stress developments through drives towards the barricade in a stope filled with hydraulic fills. The analytical solutions available in literature are generally based on a continuum approach, and often underestimate the stresses within the fill. Therefore a laboratory model was used to investigate the stress distributions within stope and drive filled with dry hydraulic fill material under higher stresses. Earth pressure cells are used on the barricade and also within the stope to record the stress variation when a uniformly distributed load is applied from the top of the model stope. Also, three dimensional numerical simulations were used to compare the results from laboratory model tests. Finally, an empirical relationship for barricade stress was constructed based on laboratory test results. Chapter 6 presents an alternative analytical solution, as the observed vertical stress variation with laboratory models related to backfilled stopes is not successfully predicted by the arching theory. The mine fills are granular materials, which may show. 13.
(41) deviations in vertical stress estimations when assumed as continuum. Therefore, alternative analytical equations are developed considering a particulate medium consisting of two dimensional regular disk array and the summation of inter-particle forces. The proposed analytical equation is capable of estimating the vertical stresses close to those obtained from laboratory tests. Chapter 7, the final chapter, synthesises the conclusions drawn in each chapter and concludes the thesis. Furthermore, recommendations on future research are presented at the end of Chapter 7.. 14.
(42) Chapter 2 Literature Review. 15.
(43) 2.1 Overview of mine backfill literature Mine backfilling is an integral process within the mining cycle and often the backfilling speed dictates the speed of overall mining cycle. “One cannot mine faster than he fills” is a famous quote among the miners (Bloss 2014). The use of backfill has brought many advantages and provides the option to select the optimum ore extraction technique with mining methods such as sublevel open stoping, vertical crater retreat and cut and fill mining. Hydraulic fills (HF), among many other fill types, are widely used with backfilling operations, and are popular due to their low cost and relatively easy preparations. Barricades are constructed in place, blocking the drives, to retain the backfills and contain them within the stope. A proper understanding of the loadings on the barricades is necessary to design them with confidence, thus ensuring safe and reliable mining practices. In situ stress measurements have been reported for backfills within the stope (Knutsson 1981; Grice 1989; Belem et al. 2004; Thompson et al. 2009; Thompson et al. 2012). However, in situ measurements of barricade stress when the stope is filled with hydraulic fills are limited. Grice (1989) loaded the brick barricades under undrained conditions with cemented aggregate fills at Mount Isa Mines and recorded the stresses experienced by the barricades. Mitchell (1992), studied the resultant force variation for a barricade within a 200 mm × 200 mm wide drive via a centrifuge model, locating the barricade at two offset distances of 0 and 100 mm. Understanding the stress development within the backfilled mine stopes is necessary for estimating the loads on the barricade. The barricade stress variation is analytically expressed by Kuganathan (2002) and Li and Aubertin (2009b), assuming elastic behaviour considering a vertical layer element along the drive. Also numerical modelling has been carried out for studying the stress developments within the stope as well as the loads acting on the barricade (Aubertin et al. 2003; Li and Aubertin 2009b; Helinski et al. 2010). Moreover, laboratory model studies provide an insight to the behaviour of the backfill as well (Pirapakaran 2008; Ting 2011). Therefore, analytical, 16.
(44) numerical and laboratory tests are used in this dissertation to shed light on the understanding of loads onto the barricades considering the arching and stress propagation, thus enabling development of competent designs for barricades. The aspects such as drainage, loading on barricade and filling procedures are to be considered when mine stopes are backfilled with uncemented tailings. Comprehensive tests on properties and behaviour of emplace fills were undertaken by Thomas (1969) for Mount Isa Mines. Grice (1998) identified a few operations that use lower slurry densities than generally accepted and reported a few barricade failures while indicating recorded slurry densities of 53% solids by weight. Recent studies by Rankine (2005), Sivakugan et al. (2006b) and Helinski (2007) have led to improved understanding of the drainage within backfilled mine stopes.. 2.2 Hydraulic fills – properties The hydraulic fills are the coarse fraction from mine tailing streams. The specific gravity of mine fills is high, compared with general soils, as they are end products from heavy mineral ores. Sivakugan et al. (2006b) have reported that the specific gravity is ranging from 2.8 to 4.4 for HFs, after tests conducted for 20 different Australian hydraulic fills. The grain size distribution is an essential component in the backfill and the grain size distributions for common Australian backfills are given in Figure 2.1. The grain size parameters Cu and Cc vary in a range of 3.7 to 13.3 and 0.6 to 2.0, respectively (Sivakugan 2008). Removal of finer fraction, de-sliming, leads to a major characteristic of hydraulic fills as “less than 10% to be finer than 10 μm” (Grice 1998). This implies that D10 of a HF is expected to be greater than 10 m.. 17.
(45) Percent finer by weight. Grain size (µm). Figure 2.1. Grain size distribution of Australian backfills that were tested at James Cook University (Sivakugan et al. 2006) When a large quantity of water enters the stopes, it may not be able to drain through the barricade and may induce hydrostatic loading conditions to the barricade. Therefore, maintaining the slurry density as specified is important. Usually the slurry density of HF, ranges from 50 - 70% solids by weight (Cw). The quantity of drainage resulting from slurry densities of around 70% Cw is as little as a quarter of the drainage resulting from 55% Cw slurries (Grice 1998). Often, it is recommended to maintain 70% or higher solids by weight in the slurry to minimize the water placed underground. Water, being the main constituent of distribution and placement of backfill, enters the stope in considerable amount. The excess water needs to be removed from the stope as quickly as possible because of the instability caused by hydrostatic conditions (Sivakugan et al. 2005). The rate of drainage is a function of the permeability of the backfill and the driving head (Grice 1998). Rough surfaced and angular shaped HF particles produce a greater resistance to the movement of fluid through the voids and therefore permeability is lowered within the backfill. Permeability controls the rate of 18.
Figure

+7


Outline
Related documents
The pipeline operator shall establish and maintain a PSMS and build a shared understanding of safety culture. The pipeline operator shall articulate expectations, including
Значительная часть рНк, в том числе длинные некодирующие рНк (long non-coding RNA; lncRNA), выступают в роли сигнальных молекул, навигационных систем и
повышается также скорость входа протонов в матрикс (рис.. Влияние МрТр на трансмембранный обмен ионов в митохондриях. Открывание МРТР, как уже было показано нами
In this study it is aimed to investigate the total lipid and the fatty acid composition of pearl mullet which is the only fish species occurring in Lake Van and
innovation in payment systems, in particular the infrastructure used to operate payment systems, in the interests of service-users 3.. to ensure that payment systems
The encryption operation for PBES2 consists of the following steps, which encrypt a message M under a password P to produce a ciphertext C, applying a
This article has been downloaded from the Henry Moore Institute’s collection of Online Papers and Proceedings, an online publishing facility bringing you the most recent
Product Name Technical Licences Technical Licenses Required/ Optional GIS 8.0 Required GIS_INTERACTIONSERVICE 8.0 Required ics_custom_media_channel 8.0
