Wavelet basis selection for spectroscopic data analysis
136
0
0
Full text
(2) Wavelet basis selection for spectroscopic data analysis. Thesis submitted by David Andrew DONALD BSc(Hons) in May 2012. for the degree of Doctor of Philosophy in the School of Engineering and Physical Sciences James Cook University. i.
(3) Statement of Access I, the undersigned, author of this work, understand that James Cook University will make this thesis available for use within the University Library and, via the Australian Digital Theses network, for use elsewhere.. I understand that, as an unpublished work, a thesis has significant protection under the Copyright Act and;. I do not wish to place any further restriction on access to this work. __________________________ David A Donald. ________________ Date. ii.
(4) Signed statement of sources I declare that this thesis is my own work and has not been submitted in any other form for another degree or diploma at any university or other institution of tertiary education. Information derived from published or unpublished work of others has been acknowledged in the text and as a list of references. __________________________ David A Donald. ________________ Date. iii.
(5) Statement on the contribution of others Professor Danny Coomans and Dr. Yvette Everingham of the School of Mathematical and Physical Sciences, James Cook University, provided supervision, editorial assistance and imparted professional learning during these studies.. The School of Mathematical and Physical Sciences, James Cook University provided: a stipend via School of Mathematics and Physical Sciences Research Scholarship (20032004); a Teaching Scholarship; administrative support and; a School of Mathematical and Physical Sciences Travel Award used to attend the 12th International Conference of Near Infrared Spectroscopy in Auckland, 2005.. A travel award from the International Committee for Near Infrared Spectroscopy was awarded to attend the 12th International Conference of Near Infrared Spectroscopy, Auckland, 2005.. The Graduate Research School, James Cook University provided a stipend via a James Cook University Postgraduate Research Scholarship (JCUPRS) in 2004-2006 and professional development through graduate workshops; particularly the public speaking, negotiation skills, scientific writing and effective writing workshops. Additionally, the Graduate Research School awarded: a JCU Graduate Research International Travel Award to attend the 12th International Conference of Near Infrared Spectroscopy in Auckland, 2005; and a Doctoral Research Scheme grant used to attend the International Conference on Optimisation: Techniques and Applications in Ballarat, 2004, and visit the Australian Wine Research Institute in Adelaide and; Merit Research Grant used for computational support.. Data for Chapter 2 was provided by the Australian Wine Research Institute (AWRI) with the support of Dr. Daniel Cozzolino and Mark Gishen. The AWRI hosted a visit to the Adelaide research unit in December 2004 and assisted in professional development by inviting co-contributions in writing Grain Development Research Council milestone reports. Dr. Daniel Cozzolino assisted in the understanding and interpretations of the models development using the data provided by the AWRI. Both Dr. Cozzolino and. iv.
(6) Mark Gishen provided editorial assistance with manuscripts and reports involving the data provided by the AWRI. Dr. Carl J. Schwarz, from the Department of Statistics and Actuarial Science, Simon Fraser University, Canada, assistance in the experimental design analysis in Chapter 2.. Chapter 3 included two data sets provided by Dr. Yvette Everingham. The seagrass data originated from Dr. Lem Aragones, previously from the Department of Zoology, James Cook University, and Dr. William Foley, from the Division of Botany and Zoology, Australian National University. The mineral data set originated from Dr. Danny Aswen, previously from the Earth Sciences Department, James Cook University.. Dr. Timothy Hancock, formerly a PhD at the School of Mathematics and Physical Sciences, JCU, co-authored the manuscript in Chapter 4 and contributed the variable selection methodology using the variable importance list generated by Random Forests. Dr. Christine Smyth, formerly a PhD candidate at the School of Mathematics and Physical Sciences, JCU, assisted Dr. Hancock in his contributions to Chapter 4. SELDI-TOF mass spectra data used in Chapter 4 was freely provided by the National Cancer Institute (of the United States of America) from their website.. Chapter 5 data originated from Brian Osborne, BRI Australia Limited, North Ryde, Australian. Code for the Metropolis search used in Chapter 5 was obtained from Professor Marina Vannucci, Department of Statistics, Rice University, Houston, Texas, USA, and subsequently modified for use in this thesis. Professor Wayne Reid, head of the School of Mathematics and Physical Sciences, provided critical review of Chapter 6.. Dr. Ian Atkinson, Dr. Wayne Mallett and Dr. Dominique Morel from the James Cook University High Performance Computing Centre provided computational support which was employed extensively for the wavelet optimisation and variable search algorithms.. v.
(7) Acknowledgements I would firstly like to thank my supervisors, Danny and Yvette, for their support, encouragement and patience. They have imparted their skills and knowledge which has made me a professional researcher; which I can proudly say, has profoundly affected my career and personality in a positive way.. As the founding member of the Mathematics and Physics Students Club, I would like to thank the staff of the School of Mathematics and Physical Sciences, particularly Professor Wayne Reid, for their support for the club and encouraging young adults in their chosen academic fields. The free sausages were a bonus.. Finally a special acknowledgment to all of those who have continued to encourage me; particularly my mother Pauline and my wife, Mikayla.. vi.
(8) Abstract The discrete wavelet transform using adaptive wavelet bases were investigated in classification, regression and experimental design applications for spectroscopic data. Adaptive wavelets have been used previously in near infrared spectroscopy fields for classification and regression; however methods to select the parameters required in the adaptive wavelet algorithm have been largely influenced by human interaction. Methods are developed within this thesis to select parameters for adaptive wavelets along with investigating the hypothesis of using multiple wavelet bases to improve the predictability of classification and regression models.. Use of the adaptive discrete wavelet transform (ADWT) is illustrated using a repeated measures experiment. Near infrared (NIR) spectra of wine grape homogenates, from the Australian viticulture industry, underwent feature extraction via the ADWT and then modelled using penalised discriminate analysis, random forests and multiple adaptive regression splines.. The correct classification rates of all three methods were. substantially improved when the ADWT was applied.. Scores from the ADWT. penalised discriminate analysis (PDA) were analysed via multivariate analysis of variance (MANOVA) where it is reported that all main and interaction effects were significant. A bi-plot of the PDA scores illustrated the ease of which the ADWT extracted useful features from the spectra which were pertinent to the experimental design.. A method of ADWT parameter selection was derived using the Bayes’ information criteria (BIC) and demonstrated in an unsupervised classification problem. Using the BIC to select ADWT parameters removed the need to for human interaction to select good, optimised, adaptive wavelets.. This outcome highlighted an advantage over. standard wavelet types, which gave similar unsupervised classification performances, where adaptive wavelets only need to span a relatively small set of parameters to give good models while a prohibitively large number of standard wavelet types need to be trialled.. vii.
(9) Investigation of using multiple wavelet transforms to improve model performance - a new hypothesis in the field of chemometrics – was demonstrated in supervised classification and regression applications. In the classification example, SELDI-TOF mass spectra from a cancer study were analysed by pre-processing the spectra with a variety of standard wavelet types prior to variable elimination via a t-static and random forest approach.. The retained variables were subsequently model using Treeboost. where the specificity and sensitivity of the modelling process was improved by using multiple standard wavelet types compared to model using only one wavelet type alone. Models derived from wavelet processing were superior to models without preprocessing.. Further evidence supporting the multiple wavelet feature extraction hypothesis was gained in the regression application. Using a publically available and well documented NIR dataset, a Bayes Metropolis regression was modified to incorporate multiple wavelet transforms by using constrained stacking rather than Bayes model averaging as the model ensemble method.. Multiple adaptive wavelets and multiple standard. wavelets were trialled with the multiple adaptive wavelet approach resulting in a superior predictive regression model when compared to: all single standard wavelet models, single adaptive wavelet models, multiple wavelet standard wavelet models and models cited previously in literature for the same data set.. Methods for using adaptive wavelets, both multiple and singular wavelet bases, are outlined in this thesis with the general conclusion that the modelling process of NIR data (or juxta-positional data) can be substantially improved by the use of these wavelet transforms.. viii.
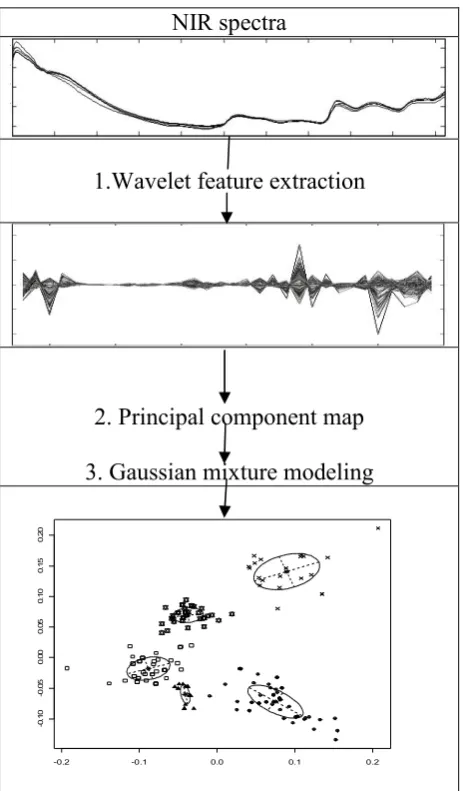
(10) Table of Contents Statement of Access......................................................................................................ii Signed statement of sources.........................................................................................iii Statement on the contribution of others ....................................................................... iv Acknowledgements...................................................................................................... vi Abstract .......................................................................................................................vii Table of Contents......................................................................................................... ix List of tables................................................................................................................xii List of figures.............................................................................................................xiii Chapter 1 Introduction .................................................................................................. 1 1.1 Thesis outline.......................................................................................................... 5 1.2 Chapter 2................................................................................................................. 5 1.3 Chapter 3................................................................................................................. 6 1.4 Chapter 4................................................................................................................. 6 1.5 Chapter 5................................................................................................................. 7 1.6 Chapter 6................................................................................................................. 7 1.7 Considerations for the NIR spectroscopy community............................................ 8 1.8 Publications resulting from thesis......................................................................... 10 Chapter 2 Adaptive Wavelet Modelling of a Nested 3 Factor Experimental Design in NIR Chemometrics ................................................................................................... 11 2.1 Introduction........................................................................................................... 11 2.2 Theory................................................................................................................... 13 2.2.1 Discrete wavelet transform ............................................................................ 13 2.2.2 Penalized discriminate analysis (PDA).......................................................... 15 2.2.3 Multiple adaptive regression splines (MARS)............................................... 15 2.2.4 Random Forests ............................................................................................. 17 2.3 Experimental......................................................................................................... 17 2.3.1 Data................................................................................................................ 17 2.3.2 Method ........................................................................................................... 19 2.3.3 Software ......................................................................................................... 20 2.4 Results and Discussion ......................................................................................... 20 2.5 Conclusions........................................................................................................... 24 2.6 Summary............................................................................................................... 26 Chapter 3 Integrated wavelet principal component mapping for unsupervised clustering on near infra-red spectra............................................................................ 27 3.1 Introduction........................................................................................................... 27 3.2 Theory................................................................................................................... 30 3.2.1 Principal component mapping (PCM) ........................................................... 30 3.2.2 Gaussian mixture models (GMM) ................................................................. 30 3.2.3 Wavelet transform.......................................................................................... 32 3.2.4 Adaptive wavelet matrix................................................................................ 35 3.3 Experimental......................................................................................................... 36 3.3.1 Data................................................................................................................ 36 3.3.2 Wavelet Principal Component Gaussian Mixture Model Mapping (WPG) .. 38 3.3.3 Wavelet packet transform .............................................................................. 38 3.3.4 Principal component analysis ........................................................................ 39 3.3.5 Gaussian mixture models............................................................................... 39 3.3.6 Overall WPG model selection ....................................................................... 40. ix.
(11) 3.3.7 Adaptive wavelet optimization criterion........................................................ 40 3.3.8 Software ......................................................................................................... 42 3.4 Results and Discussion ......................................................................................... 42 3.4.1 Seagrass Data................................................................................................. 42 3.4.2 Mineral Data .................................................................................................. 43 3.5 Conclusion ............................................................................................................ 51 3.6 Summary............................................................................................................... 52 Chapter 4 Bagged Super Wavelts Reduction for Boosted Prostate Cancer Classification of SELDI-TOF Mass Spectral Serum Profiles................................... 53 4.1 Introduction........................................................................................................... 53 4.2 Theory................................................................................................................... 55 4.2.1 Discrete Wavelet Transforms (DWT) – Super Wavelets .............................. 55 4.2.2 Classification and Regression Trees (CART)................................................ 56 4.2.3 Random Forests ............................................................................................. 56 4.2.4 Stochastic Gradient Boosting for CART (Treeboost).................................... 57 4.2.5 Tree based methods for variable importance ................................................. 58 4.3 Experimental......................................................................................................... 58 4.3.1 Data................................................................................................................ 58 4.3.2 Method ........................................................................................................... 59 4.3.3 Benchmarking................................................................................................ 61 4.4 Results and Discussion ......................................................................................... 62 Mean Decrease in Accuracy ........................................................................... 63 4.5 Conclusion ............................................................................................................ 66 4.6 Summary............................................................................................................... 67 Chapter 5 Joint Multiple Adaptive Wavelet Regression Ensembles ...................... 68 5.1 Introduction........................................................................................................... 68 5.2 Theory................................................................................................................... 73 5.2.1 Discrete Wavelet Transform (DWT) ............................................................. 73 5.2.2 Adaptive Wavelet (AW) matrix..................................................................... 74 5.2.3 Multivariate regression model ....................................................................... 76 5.2.4 Variable selection .......................................................................................... 77 5.2.5 Posterior distribution of γ ............................................................................. 78 5.2.6 Metropolis search........................................................................................... 79 5.2.7 Stacking ensembles........................................................................................ 80 5.3 Methodology......................................................................................................... 81 5.3.1 Near infrared spectra data .............................................................................. 83 5.3.2 Parameter settings .......................................................................................... 84 5.3.2.1 Adaptive wavelet parameters.................................................................. 84 5.3.2.2 Multivariate regression model settings ................................................... 84 5.3.2.3 Metropolis search settings ...................................................................... 85 5.3.3 Computation................................................................................................... 86 5.3.4 Analysis by previous methods ....................................................................... 86 5.4 Results and Discussion ......................................................................................... 87 5.5 Conclusion ............................................................................................................ 92 5.6 Summary............................................................................................................... 94 Chapter 6 Binomial Tree Factorization of the Matrix Polynomial Product with Shift Orthogonal Matrices ........................................................................................... 95 6.1 Introduction........................................................................................................... 95 6.2 Theory................................................................................................................... 95 6.3 Expansion of the multiple matrix polynomial product ......................................... 97. x.
(12) 6.4 Example .............................................................................................................. 100 6.5 Conclusion .......................................................................................................... 101 Chapter 7 Conclusion ................................................................................................. 102 7.1 Integration of adaptive wavelets ......................................................................... 102 7.2 Adaptive wavelet optimisation criteria ............................................................... 105 7.3 Adaptive wavelet parameter selection ................................................................ 106 7.4 Multiple wavelets................................................................................................ 109 7.5 Binomial tree algorithm for adaptive wavelets................................................... 111 7.6 Future considerations .......................................................................................... 111 Appendix 1 Beer-Lambert-Bouguer Law of Absorption ....................................... 113 References.................................................................................................................... 117. xi.
(13) List of tables Chapter 2 Adaptive Wavelet Modelling of a Nested 3 Factor Experimental Design in NIR Chemometrics ................................................................................................... 11 Table 2.1 Comparison of SNV and ANV ADWT NIRdata using PDA, MARS and RF analysis techniques ......................................................................................................... 21 Table 2.2 Manova based on the PDA (1 to 4) scores from the adapted DWT. Box M statistic = 0.051, Bartletts test for sphericity statistic = 1.000. ....................................... 21 Table 2.3 Manova partitioned mean squared error ......................................................... 21 Chapter 3 Integrated wavelet principal component mapping for unsupervised clustering on near infra-red spectra............................................................................ 27 Table 3.1 Parameterizations of the covariance matrix in the Gaussian model and their geometric interpretation.................................................................................................. 33 Table 3.2 Trialed standard wavelets ............................................................................... 40 Table 3.3 Trialed values for m, q and l ........................................................................... 40 Chapter 4 Bagged Super Wavelts Reduction for Boosted Prostate Cancer Classification of SELDI-TOF Mass Spectral Serum Profiles................................... 53 Table 4.1 Benchmarking model performance using super wavelet................................ 62 Table 4.2 Random Forests VIP list, cropped at the top 50 % of variables ..................... 63 Table 4.3 Benchmarking wavelet types using Random Forest performance ................. 65 Table 4.4 Percentage false positive rates using the Random Forests on the super wavelet data.................................................................................................................................. 65 Chapter 5 Joint Multiple Adaptive Wavelet Regression Ensembles ...................... 68 Table 5.1 Mean squared errors of the validation set using six calibration methods....... 86 Table 5.2 Re-sampled constrained stacking and Bayes model averaging (BMA) mean squared error of the validation data for each constituent using standard wavelets......... 89 Table 5.3 Number of models and wavelet coefficients used in the ensembles where constrained stacking resulted in the lowest predictive MSE for each constituent.......... 89 Table 5.4 Re-sampled constrained stacking mean squared error of the validation data for each constituent using adaptive wavelets. ...................................................................... 89. xii.
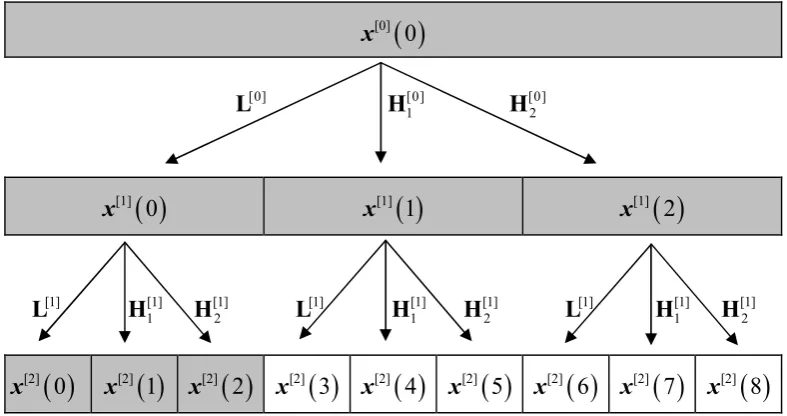
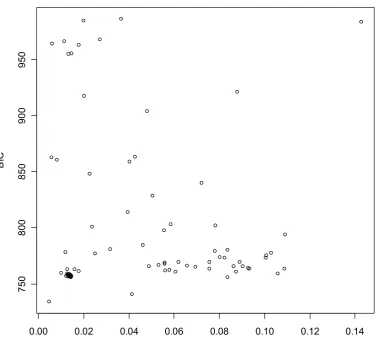
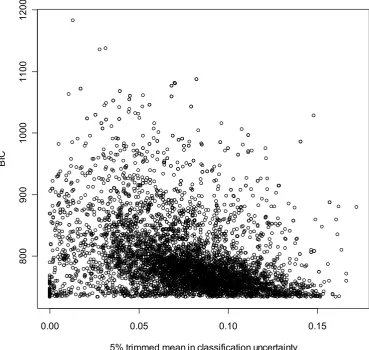
(14) List of figures Chapter 2 Adaptive Wavelet Modelling of a Nested 3 Factor Experimental Design in NIR Chemometrics ................................................................................................... 11 Figure 2.1 Nested three way design of the collected data where Variety, Storage and Homogenizer are crossed factors and the two levels of levels of replication occur within Variety and at the lowest level. Fixed effects and random effects are indicated in parenthesis as F and R respectively. ............................................................................... 18 Figure 2.2 Sample NIR spectra of the red grape homogenates ...................................... 18 Figure 2.3 Flow diagram of the adaptive DWT analysis ................................................ 19 Figure 2.4 Biplot of the adapted DWT PDA 1 and PDA 2 of the combined treatments. Adapted DWT PDA 1 and PDA 2 spectra scores are represented by the scatterplot (corresponding to the bottom and left axes respectively) while the ray diagram represents the PDA 1 and PDA 2 wavelet coefficient loadings (corresponding to the top and right axes respectively). Legend: variety A - ♦, variety B - ● variety C –(▼), H1(red), H2(green), H3(blue), Frozen – solid marker, Fresh – open marker. The PDA 1 scores are represented ..................................................................................................... 22 Figure 2.5 Biplot of the adapted DWT PDA 1 and PDA 3 of the combined treatments. Legend: variety A - ♦, variety B - ● variety C –(▼), H1(red), H2(green), H3(blue), Frozen – solid marker, Fresh – open marker. ................................................................. 23 Figure 2.6 Inverted DWT to the original NIR spectrum of the adapted DWT PDA axes. (a) PDA 1, (b) PDA 2, (c) PDA 3................................................................................... 25 Chapter 3 Integrated wavelet principal component mapping for unsupervised clustering on near infra-red spectra............................................................................ 27 Figure 3.1 Flow diagram of the proposed data mining and visualization method.......... 28 Figure 3.2 Pictorial representation of a three band wavelet packet transform, with the discrete wavelet transform in the shaded region. With the original spectrum at the top of the pyramid, x[0] ( 0 ) , L the low pass filter, H1 and H2 the respective high pass filters ........................................................................................................................................ 34 Figure 3.3 Sample of high pass wavelet filters (a) Daubechies 4 (b) Symmlet 7 (c) Daubechies 7 and (d) the Haar wavelet .......................................................................... 34 Figure 3.4 Five sample spectra from each category from the Seagrass NIR data set..... 37 Figure 3.5 Five sample spectra from the five categories from the Mineral NIR data set37 Figure 3.6 Seagrass adaptive WPG model scatter plot of the Bayesian information criteria (BIC) Vs classification uncertainty trimmed mean ............................................ 43 Figure 3.7 Seagrass standard WPG model scatter plot of the Bayesian information criteria (BIC) Vs classification uncertainty trimmed mean ............................................ 44 Figure 3.8 Adaptive WPG on the Seagrass data with adaptive wavelet parameters m = 2, q = 3, WPT band: X [1] (8) ............................................................................................... 45 Figure 3.9 Standard WPG on the Seagrass data with wavelet parameters: Daubechies 2 filter on the WPT band X [3] (8) ......................................................................................... 45 Figure 3.10 Standard WPG on the Seagrass data with wavelet parameters: Daubechies 2 filter on the WPT band X [3] (2) ........................................................................................ 46 Figure 3.11 Standard WPG on the Seagrass data with wavelet parameters: Daubechies 5 filter on the WPT band X [ 7] (6) ........................................................................................ 46 Figure 3.12 Mineral standard WPG model scatter plot of the Bayesian information criteria (BIC) Vs classification uncertainty trimmed mean ............................................ 47. xiii.
(15) Figure 3.13 Mineral adaptive WPG model scatter plot of the Bayesian information criteria (BIC) Vs classification uncertainty trimmed mean ............................................ 48 Figure 3.14 Adaptive WPG on the Mineral data with adaptive wavelet parameters m = 2, q = 3, WPT band: X [1] (8) ........................................................................................... 49 Figure 3.15 Optimal Gaussian mixture model on the third quadrant of Figure 3.14...... 49 Figure 3.16 Standard WPG on the Mineral data with adaptive wavelet parameters m = 2, q = 3, WPT band: X [1] (8) ............................................................................................... 50 Figure 3.17 Standard WPG on the Mineral data with adaptive wavelet parameters m = 2, q = 3, WPT band: X [1] (8) ............................................................................................... 50 Figure 3.18 Optimal Gaussian mixture model on the third quadrant of Figure 3.17...... 51 Chapter 4 Bagged Super Wavelts Reduction for Boosted Prostate Cancer Classification of SELDI-TOF Mass Spectral Serum Profiles................................... 53 Figure 4.1 Examples of the different wavelet families: Daubechies 4 (a), Symlets 4 (b) and Coiflets 2 (c)............................................................................................................. 56 Figure 4.2 Flow diagram of the analysis......................................................................... 60 Figure 4.3 RF reduction training set CCR convergence................................................. 65 Figure 4.4 Inverse wavelet transform of the coefficients found in by Random Forests. 66 Chapter 5 Joint Multiple Adaptive Wavelet Regression Ensembles ...................... 68 Figure 5.1 Pictorial representation of a three banded (m = 3) discrete wavelet transform where the DWT has been applied twice to the original spectrum. ................................. 75 Figure 5.2 Number of wavelet coefficients in best 500 Bayes regression models generated by the Metropolis search using Coiflet 3, level 1 as the DWT ...................... 90 Figure 5.3 Constrained stacking ensemble weights for Coiflet (1) DWT level 4, (a) without resampling (b) with re-sampling........................................................................ 90 Figure 5.4 Constrained stacking ensemble weights for multiple adaptive wavelet combinations (a) without resampling (b) with resampling. Individual adaptive wavelet combinations (sets) corresponding to the rows in Table 5.4 are indicated in parenthesis ........................................................................................................................................ 91 Figure 5.5 Adapted wavelets from different wavelet parameters used in the JAWRCS ensemble ......................................................................................................................... 91 Figure 5.6 Adaptive wavelet weighting resulting from two independent models within an ensemble using a similar region of the spectrum. An offset is added to one of the adapted wavelets for clarity ............................................................................................ 92 Chapter 6 Binomial Tree Factorization of the Matrix Polynomial Product with Shift Orthogonal Matrices ........................................................................................... 95 Figure 6.1 Binomial tree expansion of the projection matrices Pi used to construct the Kn matrices......................................................................................................................... 101. xiv.
(16) Chapter 1 Introduction Study of near infrared absorption spectra is of interest for developing low cost, automated and rapid measurement systems. The near infrared (NIR) spectrum is the portion of the energy spectrum between 800nm to 2500nm where molecular dipoles absorb energy. Molecular dipoles absorb at characteristic wavelengths and the amount of absorbance relates to the concentration of the dipole.. The Beer-Lambert-Bouguer law (Appendix 1) is the most widely adopted theoretical framework to correlate molecular concentration with spectral absorbance and is particularly useful when samples have few absorbing dipoles. With a sample with few absorbing dipoles at different wavelengths, absorbance is directly proportional to concentration. However in samples that comprise of a large number of absorbing dipoles there is, as yet, no consistent theoretical framework that can be universally applied. With samples with many absorbing diploes, the measured NIR spectrum is a convolution of many NIR absorbance spectra. To overcome this obstacle, empirical methods have been developed to determine molecular concentration based upon the measured near infrared absorbance spectrum.. Projection based calibration methods such as partial least squares (PLS) [1] and principle component analysis regression (PCR) [2] have widely been used in NIR spectroscopy with considerable success to empirically correlate NIR absorbance with molecular concentrations. The idea behind projection based methods is that the NIR spectrum can be decomposed into a multitude of orthogonal spaces which can be correlated with the desired molecular concentration.. While projection based methods have been quite successful in forming empirical relationships between NIR spectra and molecular concentrations, projection methods do not utilize the physical characteristics of the NIR spectrum; particularly the juxtapositional nature of wavelengths. For example, wavelengths (or wavenumbers) can be re-ordered randomly and PLS will result in an identical model – with re-ordered PLS loadings naturally. Empirical models derived solely from projection based method can. 1.
(17) be sensitive to the conditions in which the calibration data were collected [3]. Variants of PLS have been developed which do incorporate aspects of juxta-positioning. The most popular variant of PLS is moving window PLS (MWPLS) [4], where the spectrum is “windowed” in smaller regions. The windowing procedure incorporates some juxtapositioning information; however the portion of the spectrum within each window can still be randomly permutated to achieve the same result. Feature extraction, or signal filtering, is often used with PLS or PCR [5] to improve predictive performance as the feature extraction step incorporates physical information regarding the molecular dipole(s) spectrum.. With signal filter extraction methods, the spectrum (observed signal) is thought to consist of a superposition of underlying signals, where the signals can be characterised by a known functional form. For example, in Fourier analysis, the signals functional form is given by the sine function combined with a phase delay. Signal filters can be categorised into two classes: global and localised filters.. Fourier transforms are a classic example of a global filter where the basis function of the filter spans over the entire space of the observed signal. The Discrete Wavelet Transform (DWT) [6] and the Gabor Transform [7] are examples of localised signal filters, where the filter basis functions are localized to a small region of the observed spectrum.. Most spectra consist of a superposition of overlapping signals and the. desired signal, in regression applications, is widely believed to be restricted to a portion of the measured signal. With this overlapping structure, localised signal filters are ideal for feature extraction to improve modelling of spectra.. The discrete wavelet transform (DWT) has a similar structure as the spectrum superposition idea, where the DWT represents the spectrum as a superposition of scalable, localised functions. The DWT has been shown to be highly effective in improving the performance of calibration type problems in many fields of NIR spectroscopy [5]. However, unlike the Fourier transform, the DWT has a large number of basis functions to choose from and it has been demonstrated that some wavelets, used in the DWT, perform better than others in specific applications [8]. Most studies to date utilise wavelet transforms that use a mathematically derived wavelet such as a Daubechies or Morlet wavelet. These standard wavelet types have 2.
(18) been very successful in improving model performance particularly in the field of calibration development [9]. While Morlet and Daubechies wavelets have convenient mathematical properties, such as minimal phase distortion or maximum symmetry, they were not designed for unknown signal feature extraction for data analysis. Thus, it is more likely that a different wavelet basis, one derived for the task at hand, will more likely yield more a favourable model.. Wavelets in the DWT are functions that are fore mostly scalable and localised [7]. This criterion encompasses a broad range of functions that can be classified as wavelets. It is also possible to generate functions that fulfil the wavelet criteria. Pollen factorisation [10], Lifting [11] and Angular factorisation [12] are the most common algorithms to generate functions that meet the wavelet criteria. Additional criteria can be imposed in these wavelet generating algorithms to design wavelets specific to data analysis tasks – so called adaptive wavelets.. Adaptive wavelets are a class of wavelets which update their function frequency and phase forms to reduce a predefined optimisation criterion. The application of adaptive wavelets is quite limited in field of chemometrics with very few articles in literature [8, 12, 13]. Although the application of adaptive wavelets in literature is limited within the chemometrics field, the chemometric studies on adaptive wavelets have all indicated that adaptive wavelets are superior to standard wavelets. Nearly all of the adaptive wavelet applications in chemometrics have been on regression development [12] with only two papers on classification [8, 14].. Slow adoption of adaptive wavelets can be partially attributed to a lack of integration of adaptive wavelets into modern chemometric methods such as principle component analysis (PCA) and partial least squares (PLS). Standard wavelets have been used as a feature extraction tool for both PCA and PLS [1] chemometric applications, so it is understandable that adaptive wavelets should also be able to integrate with PLS and PCA to obtain further gains in model development. Integration of adaptive wavelets into modern chemometric methods is a key issue of this thesis, in particular how to generate the correct adaptive wavelet.. 3.
(19) To derive the correct adaptive wavelet there are three key issues to be addressed. Firstly are the optimisation criteria; second is implementation of the adaptive wavelet algorithm and lastly selection of adaptive wavelet parameters required in the wavelet generation algorithms.. Adaptive wavelets are largely dependant on the defined optimisation criteria [7] and definition of the optimisation criteria is entirely dependant on the modelling process under investigation. Chemometric modelling of NIR spectra can take many forms, but is generally one of the following four types: (1) unsupervised classification, (2) supervised classification, (3) analysis of experimental designs and (4) regression [15]. Each of these model types has different objectives and as such has different optimisation criteria. Development of the optimisation criteria for each of the model types is outlined in this thesis and is an important issue in generating the correct adaptive wavelet.. Adaptive wavelets have also been viewed as overly complicated and so have been criticized as an unnecessary complication in the modelling process [16]. While adaptive wavelets do have complicated mathematical properties, they are no more complicated than standard wavelet types. The algorithms that give rise to standard wavelets are in fact the same algorithms that are used to generate adaptive wavelets; the only difference being for standard wavelets, predefined constraints are used [7]. With this in mind, this thesis introduces an alternative adaptive wavelet algorithm based on the more familiar concept of binomial trees.. Apart from the optimisation criteria, algorithms used to generate adaptive wavelets also contain a set of parameters that need to be defined [17]. These parameters pertain to the number of banded wavelets used in the DWT and the localisation (width) of the wavelets.. Values of these parameters essentially restrict what form the resulting. wavelets can take. The larger the values the more flexible the wavelets become.. An additional key issue of this thesis is wavelet homogeneity. In all applications of the DWT to spectroscopy calibration problems, a single wavelet type is used in the feature extraction process. This assumes homogeneity of underlying signals across the breath of the spectrum.. However, if the underlying signals are heterogeneous along the 4.
(20) spectrum, different wavelet basis at different parts of the spectrum may offer further advantages in feature extraction for model development. This then leads to the main purpose of this thesis being, how to choose which wavelets to use and where to apply them.. The key issues addressed in this thesis are: 1. Integration of adaptive wavelet features within modern data analysis techniques 2. Generation of adaptive wavelet optimisation criteria for the four main types of data modelling: experimental design analysis, unsupervised classification, supervised classification and regression. 3. Automate adaptive wavelet parameter selection 4. Investigate feature heterogeneity within in a spectrum by using multiple wavelets, both adaptive and standard wavelets and, 5. To generate adaptive wavelets using a simplified binomial tree algorithm.. 1.1 Thesis outline This thesis is composed of five chapters investigating the application of wavelets, both standard and adaptive, to chemometric problems.. Chapters 2 to 5 focus on. incorporating adaptive wavelets with modern chemometric methods and addressing the issues related to wavelet selection, while Chapter 6 introduces a new method to generate adaptive wavelets based on a binomial tree factorisation.. Chapter 2 investigates integration of adaptive wavelets to experimental design analysis using near infrared (NIR) spectra; Chapter 3 integrates adaptive wavelets with unsupervised classification and investigates automated parameter selection for adaptive wavelets; Chapter 4 investigates heterogeneity of wavelets in building supervised classification models and; Chapter 5 focuses on multiple adaptive wavelet basis functions for regression applications and ensemble methods for adaptive wavelet parameter selection.. 1.2 Chapter 2 The aims of Chapter 2 are to (i) develop adaptive wavelet optimisation criteria for experimental designs and (ii) integrate adaptive wavelets with traditional projection based methods. Chapter 2 introduces the concept of using adaptive wavelets in a 5.
(21) repeated measures experiment.. Using an adaptive discrete wavelet transform, the. method initially extracts features from the spectra that correlate with the design of the experiment. The extracted features are then mapped onto a five-dimensional hyperplane using penalized discriminate mapping (PDM) to form PDM scores which are analysed using a multivariate mixed model (MMM) to determine if the experimental design affects the NIR spectra.. 1.3 Chapter 3 Chapter 3 aims to integrate adaptive wavelets with unsupervised classification and investigate automated parameter selection for adaptive wavelets. Chapter 3 investigates a new method of unsupervised cluster exploration and visualization for spectral datasets by integrating the wavelet transform, principal components and Gaussian mixture models. This method incorporates feature extraction with model selection where the Bayesian Information Criterion (BIC) and classification uncertainty performance criteria are used to guide an automated search of commonly available wavelets and adaptive wavelets. The effectiveness of the proposed method is demonstrated in elucidating and visualizing unsupervised clusters from near infrared (NIR) spectral datasets.. 1.4 Chapter 4 Chapter 4 introduces a new concept applying different wavelet transforms to different regions within the spectrum for supervised classification. Data used in Chapter 4 is not NIR spectra but SELDI-TOF mass spectra. Mass spectra (MS) and NIR spectra have similar characteristics as the data are juxta-positional so the same hypothesised data framework applies.. Features are extracted from the mass spectrum using multiple standard wavelets and incorporate into CART to develop a supervised classification model.. Chapter 4. investigates the hypothesis of feature heterogeneity within the spectrum and develops methodology to use features derived from multiple wavelets simultaneously in a CART model. The method is illustrated using the publicly available prostate SELDI-TOF MS data from the American National Cancer Institute (NCI).. 6.
(22) 1.5 Chapter 5 Chapter 5 extends and combines the multiple wavelet approach to regression applications.. Multiple adaptive discrete wavelet transforms were applied to NIR. spectroscopic data for a multiple regression problem for the purpose of investigating the hypothesis – does the use of different wavelets, at different points, within a NIR spectrum elucidate predictive capability of regression models. This furthers the natural framework of the spectrum as different molecules exhibit different NIR signatures at different locations of the spectrum. The aims of Chapter 5 are to (i) develop adaptive wavelet criteria for regression applications, (ii) further investigate the hypothesis of feature heterogeneity within the spectrum and, (iii) develop methodology to use multiple wavelet transforms for regression. Data used in Chapter 5 is a publically available dataset pertaining to biscuit dough where sample near infrared spectra were measured by a FOSS 5000 NIR instrument and laboratory measurements were made to determine the fat, flour, sugar and moisture content.. 1.6 Chapter 6 Algorithms to generate adaptive wavelets, such as Lifting [11], Quadrature Mirror Filtering [7] and Pollen factorisation [10], are complex and difficult to implement. By investigating the Pollen factorisation method, a simplified algorithm based on a binomial tree factorisation is established. The binomial method is relatively simple to implement to produce a full range of adaptive wavelets.. 7.
(23) 1.7 Considerations for the NIR spectroscopy community Methods and techniques discussed and developed in this thesis may initially be thought to be of a passing or isotoric academic interest. However, after being actively employed in the NIR chemometric community for the previous five years, presenting at international conferences regarding NIR spectroscopy and being invited to present in industrial committees on NIR applications, there remains many issues in the fifty year old plus field that remain to be resolved. Without question, the largest issue is, and will be for some decades, measurement sensitivity of the NIR spectrum. The issue of measurement sensitivity has resulted in a general impression in the scientific community that NIR spectroscopy is a black box magic!. Near infrared spectra lack the tightly focused peak definition that is observed in all other forms of spectroscopy such as infrared, visible, ultraviolet and x-ray. The spectra of agricultural products all look the same with broad flowing mounds for peaks. Measurement sensitivity is not simply a consequence of detector sensitivity, however it does help, but measurement sensitivity in the NIR spectrum is also a product of sample presentation.. NIR energy is extremely prone to absorption, scattering and emission, so when a sample of sufficient thickness is illuminated with NIR energy, vast numbers of interactions occur and “statistically blur out.” This leaves the interesting phenomena of sample presentation invariance (or close to) and peak broadening. If an incredibly thin film of a material (solid or liquid) was presented to a NIR spectrophotometer that was capable of analysing each photon and whence that photon interacted with the sample, a spectrum of clearly defined peaks would be measured. As it happens this is exactly what occurs when the NIR spectrum of gases are measured. Sadly gas NIR spectroscopy is limited and analysis of solid and liquid samples is what matters.. Methods to integrate and analyse broad flowing peaks in NIR spectra from solid and liquid samples are required. Current methods, such as PLS, utilise large portions of the measured spectra (the water absorption bands are typically ignored in most practical applications) which are mathematically used to solve Eigen vector relationships between the spectra and a measured constituent. Loadings (or regression) coefficients 8.
(24) from this approach rarely impart any knowledge regarding the importance of particular wavelength regions with respect to the constituent(s). Conversely, feature extraction methods utilise relatively small portions of the spectrum so a direct interpretation can be made between the spectrum and the constituent(s). Feature extraction methods almost invariably result in more predictive models than the traditional counterparts.. Feature extraction methods, such as adaptive wavelets, offer a means to resolve measurement sensitivity by de-convoluting portions of interest in the spectrum. Wavelets are still an underutilised pre-processing method in the chemometrics community partly because it involves making more choices being which wavelet to use. The field is already a flood with pre-processing techniques and introducing another which involves more complexity invokes further choice headaches.. By presenting a method which: selects/generates an appropriate wavelet, determines the portion of the spectrum to use, reduces model uncertainty and ultimately improves future predictions, the chemometrics community will develop a wider view to feature extractions methods – of which there are very few.. The question of how practical this thesis will be to the scientific community can be answered thus: Feature extraction methods illuminate localised information within the NIR spectrum which would otherwise be misinterpreted due to a lack in measurement sensitivity.. 9.
(25) 1.8 Publications resulting from thesis Chapters 2, 3, 4 and 5 have been published in the following manuscripts respectively: 1.. David Donald, Danny Coomans, Yvette Everingham, Daniel Cozzolino, Mark. Gishen and Tim Hancock (2006), Adaptive wavelet modelling of a nested 3 factor experimental design in NIR chemometrics. Chemometrics and Intelligent Laboratory Systems, 82 (1-2). pp. 122-129. 2.. David Donald, Yvette Everingham and Danny Coomans (2005), Integrated. wavelet principal component mapping for unsupervised clustering on near infra-red spectra. Chemometrics and Intelligent Laboratory Systems, 77 (1-2). pp. 32-42 3.. David Donald, Tim Hancock, Danny Coomans and Yvette Everingham (2006),. Bagged super wavelets reduction for boosted prostate cancer classification of seldi-tof mass spectral serum profiles. Chemometrics and Intelligent Laboratory Systems, 82 (12). pp. 2-7. 4.. David Donald, Danny Coomans and Yvette Everingham (2011), Joint multiple. adaptive wavelet regression ensembles, Chemometrics and Intelligent Laboratory Systems, 108 (2), pp. 133-141.. Additionally, sections of this thesis contributed to a book chapter:. Donald, D.A., Everingham, Y.L., McKinna, L.W., and Coomans, D. (2009) Feature selection in the wavelet domain: adaptive wavelets. In: Comprehensive Chemometrics: chemical and biochemical data analysis. Elsevier, Oxford, UK, pp. 647-679.. 10.
(26) Chapter 2 Adaptive Wavelet Modelling of a Nested 3 Factor Experimental Design in NIR Chemometrics 2.1 Introduction Near infrared (NIR) spectroscopy, being a relatively inexpensive means of data collection is enabling many industrialists and academics the opportunity to increase the experimental complexity of their research, which in turn results in more accurate and precise information of their area of interest. An example is the comparison of the generalized randomized block design (GRBD) with the randomized block design (RBD) [18], where the GRBD is a k replicated RBD (and thus cost k times as much). The GRBD offers the opportunity to measure the effects of pseudo blocking factors, thus forming more accurate effects corresponding to the (true) fixed effects. This is not possible with the RBD. So with decreased costs for replication with NIR, GRBD experiments are becoming increasing popular and as a result of this, increasing interest (and concern) is how the experimental design affects the NIR spectrum.. Traditional methods for analysing a GRBD are ANOVA or MAVOA; however, ANOVA/MANOVA methods are ill suited to highly correlated, high dimensional data such as NIR spectra. To overcome the issue of high dimensionality, the NIR spectra are projected onto a lower dimensional, less correlated space. This is most commonly done using either a PLS [19-22] or PCR [19, 21] kernel based approach or alternatively projection via PCA alone [23].. Since the experimental design is known, PLS on the experimental design matrix, ASCA [24] or LDA [22]; would be a more appropriate projection method since this would be in effect mapping the NIR spectra onto a MANOVA space (the space that best describes the treatment factors!). In addition, while the above methods address the issue of the high dimensionality, the corresponding concern of the high variable correlation is still evident.. 11.
(27) To overcome this issue of high variable correlation while simultaneously reducing the dimensionality and correcting for experimental design, we can employ a variety of methods such as: covariance inflation; penalized discriminate analysis (PDA) [25, 26], selection of multiple variable subsets; random forests (RF) [27] or fitting simple piece wise regressions; multiple adaptive regression splines discriminate analysis (MARSDA) [28]. It would seem as if the problem is solved. However, PDA, MARS and RF, can become insensitive in situations where the NIR spectrum is dominated by a small fraction of the experimental design, effectively masking the effects resulting from the remainder of the experiment.. One of the main reasons for this is the NIR spectrum is composed of complex convolutions of chemical signals spanning across multiple localized wavelengths. This type of localized interactions can be difficult to detect with the above methods which focus on detecting differences arising from linear combinations of all the wavelengths simultaneously. To improve the sensitivity of PDA, MARS and RF, we focus on the localised convolutions rather than the raw wavelengths. The discrete wavelet transform (DWT) can be used as a localised convolution filter, which can be used to approximate and extract features from a NIR spectrum and has been used as such in PCR and PLS NIR regression applications [1, 29].. The wavelet transform (WT) is a projection of the spectrum onto an orthogonal basis, called a wavelet basis. This is to say that the spectrum can be represented by a set of localised, orthogonal basis functions called wavelets [6]. In this the WT has a familiar origin with the Fourier transform (FT), whose orthogonal basis functions are the sine functions. However, the DWT has a larger amount of flexibility than the FT, in the sense that the WT has an infinite choice of basis functions (wavelets) to choose from. Thus we can choose a wavelet basis that will result in good approximations of the latent features within the spectrum.. In most NIR WT applications to date, the wavelet used is selected from one of eight standard types of wavelets [7] mainly as a matter of convenience [5, 9, 12, 30-32]. However, it is possible to develop wavelets specifically for a particular application. These application specific wavelets iteratively adapt themselves towards a user defined criteria and are generally termed adaptive wavelets [8, 13, 33, 34].. It has been 12.
(28) demonstrated in supervised settings that adaptive wavelets – ones characteristic to the modelling process, result in higher classification rates [8] and more accurate regression models [12].. In this chapter, NIR spectra from red grape homogenates collected as part of a three way cross GRBD experimental design will be modelled using PDA, MARS-DA and RF on both the NIR spectra and the adaptive discrete wavelet transform (DWT) NIR data. Following the modelling process, the WT PDA is analysed with MANOVA to assess which fixed effect processes from the GRBD affect the spectra.. 2.2 Theory 2.2.1 Discrete wavelet transform The discrete wavelet transform (DWT) [15] like the Fourier transform, can be used to reformulate a spectrum into an alternative “feature space”, by mapping the spectrum onto an analyzing function. In Fourier analysis, the analyzing functions are the set of sine function (spectra are mapped onto “frequency space”), where as for the DWT wavelets are the analyzing functions (spectra are mapped onto a “wavelet space”). The DWT is given by: l. 2l. x ( t ) = ∑∑ c j ,kψ j ,k. (2.1). j =1 k = 0. where ψ 0, 0 is the father wavelet, from which all the other wavelets ψ j,k are derived from, x(t ) is the spectrum and c j ,k is the wavelet coefficient calculated by the inner product between x(t ) and ψ j,k . c j ,k = x ( t ) ψ j ,k. (2.2). Unlike Fourier analysis, there are many types of analysis functions (wavelets) that can be used for the DWT – each resulting in different wavelet coefficients (mapped features), where typical (standard) wavelets used are Daubechies Symlets Coiflets. Since we do not know which wavelets will result in the best feature extraction a priori. 13.
(29) for classification, this chapter will use Pollen’s adaptive wavelets [15, 17] to extract features.. An advantage of the Pollen adaptive wavelets, is that the wavelet can be parameterized into q+1 normalized vectors u1 , u 2 ,..., u q and v; where q ∈ Ζ + is a smoothness parameter for the resulting wavelet. This means that we can asses the “fitness” of the wavelet as a function of the normalized vectors, which can then be iteratively updated to achieve a high “fitness”.. In this study, we define the fitness as the ability to. discriminant between the various homogenizers, varieties and storage combinations, and to achieve this; we introduce a fitness function based on the wavelet coefficients from the DWT and the experimental design.. The fitness function is defined as: R. f ( u1 ,… u1 , v ) = ∑ g i. (2.3). Σ −w1Σ B β i = g i β i. (2.4). i =1. where. Σ w is the with group covariance matrix, Σ B is the between groups covariance matrix, R. is the effective rank of Σ −w1Σ B and, gi and βi are the eigen-values and vectors of Σ −w1Σ B respectively.. The Pollen adaptive wavelets can be summarized in the following steps: (1) Define the integer values for m and q (2) Initialize the normalized vectors u1 , u 2 ,..., u q and v (3) Perform the DWT and evaluate the performance of the wavelet with Eqn. (2.3) (4) Iteratively update u1 , u 2 ,..., u q and v until a converge criteria is met.. In this study, u1 , u 2 ,..., u q and v are initially assigned elements from the uniform distribution, which in previous supervised studies as shown to converge based on. 14.
(30) similar optimization criteria detailed in eqn (2.3) [8, 13]. For a comprehensive account of the theory of the Pollen Factorization, the reader is referred to [17].. 2.2.2 Penalized discriminate analysis (PDA) Penalized discriminate analysis [26] is an extension of Fisher’s linear discriminant analysis (LDA) which aims to find linear combinations of the variables that best separate the G different groups within the dataset such that the between group variability is maximised as much as possible relative to the within group variability. Here, LDA assumes that the data are drawn from G groups with K dimensional mean vectors M j , j = 1… G , common within group covariance Σ w and proportions π 1 ,…π G of the groups in the population. Specifically, LDA finds β ∈ ℜ K with β T Σ w β = 1 such that f = ∑ j =1 π j (β T M j − β T M ) is maximised. Here M = ∑ j π j M j is the overall G. 2. population mean vector. Maximising. f is identical to maximising the ratio. g = β T Σ B β β T Σ w β under the constraint β T Σ w β = 1 .. Differentiation leads to the. eigensystem Σ −w1Σ B β = gβ . In this way we can see that the eigenvectors of Σ −w1Σ B lead to the discriminate space. In many NIR spectra situations, Σ w is near singular due to the high correlations between adjacent wavelengths (variables), thus the eigenvalues of Σ −w1Σ B cannot be computed. To overcome this near singularity, Σ w is replaced with Σ′w = Σ w + Ω , where Ω is a K by K matrix such that β T Ωβ is large for undesirable β . This Ω is the central idea in PDA, where Ω penalizes the β ' s . We refer the reader to [26] for a detailed description of Ω .. 2.2.3 Multiple adaptive regression splines (MARS) The idea behind the MARS [28, 35] strategy is that in different areas of the sample space, different variables may have a greater or lesser contribution to the response surface via different loci. In general, the number of variables contributing significantly along one locus to any one region of the response surface will be smaller than the total number of variables. The adaptive term in MARS refers to the ability of the algorithm to select the dominant variables in each of the subregions.. 15.
(31) The underlying MARS model can be written as:. yi = ∑ βi , j f j ( X i , j ) + ε. (2.5). j. where the vector y is the response vector, f j are the various (normalized) loci, β i , j are the loci coefficients, X i , j are the variables (wavelengths) that significantly contribute to yi through the loci f j , and ε is the error in the model. The set of basis functions is called the MARS function given by: fm = ∑ f j. (2.6). j. NIR data, which are piecewise smooth, f j are typically multivariate polynomial regression splines [36], and the X j are selected by trialling all permutations for X j in f j order to minimize a lack-of-fit (LOF) criterion described by [35]:. N. LOF ( f M ) =. (1 N ) ∑ yi − βi f M ( xi ) i =1. 1 − C ( M ) / N . 2. 2. (2.7). where f m is the MARS function, C(M) is a complexity penalty function and N is the number of observations (spectra).. For the n spectra, there will be n corresponding models given by Eqn. (2.5), were the n models share a common MARS function, f m , but are allowed different coefficients β i , j . We can then analyze the β i , j ’s using LDA to differentiate between the G groups within the sampled spectra [36].. 16.
(32) 2.2.4 Random Forests Random forests for classification as defined by Breiman [27] is a collection of many classification trees, each built on a unique bootstrapped (both variables and observations) sample of the data. The specific example of a RF used by Breiman [27], implements randomly selected predictor variables at each node in the building of each tree included within the bootstrapping. Breiman called this routine Forest-RI. ForestRI randomizes during the split selection of each tree. This randomness has the effect of building new trees with different structures, increasing the variety of relationships modeled within the forest (multiple trees) which in turn improves the overall predictive performance. The classifications are the determined by a count (majority vote) of the classifications from each tree within the forest.. This strategy of randomly selecting observations and sub-sets of variables for constructing trees has a significant role in NIR data as (a) the tree approach avoids the problems associated with high wavelength correlation and (b) localized regions within the spectrum can be identified rather than a single wavelength and (c) helps to mitigate the effects of over fitting that can occur in a single classification tree.. 2.3 Experimental 2.3.1 Data Data used in this study consists of 284 near infrared spectra of red grape homogenates, which are prepared from grapes using a combination of various common sample preparation procedures. The homogenates of three red grape varieties (A, B and C) were randomly partitioned into two batches which were subjugated to one of two types of short term storage (fresh and overnight freezing). Then the homogenates were randomly prepared using one of three types of homogenisers (H1, H2 and H3). The design of the data collection is illustrated in Figure 2.1. The variety plots for A and B were replicated five times, while the C variety plots were replicated twice. Further more, each homogenate was replicate four times at the homogenizer level.. 17.
(33) Each homogenate was scanned in a FOSS NIRSystems6500 instrument at 2nm increments from 400nm to 2500 nm. The spectra were then truncated to 400-2448nm (1024 sample wavelengths), transformed via the log(1/R) transform and then normalized via the SNV transform [37]. Figure 2.2 shows sample spectra of the red grape homogenates. Variety ( F ) | × Storage ( F ) × Homogenizer ( F ) Replicates ( R ) | Replicates ( R ). Normalized absorbance. Figure 2.1 Nested three way design of the collected data where Variety, Storage and Homogenizer are crossed factors and the two levels of levels of replication occur within Variety and at the lowest level. Fixed effects and random effects are indicated in parenthesis as F and R respectively.. 1. 0.5. 0. -0.5. -1. -1.5 400. 600. 800. 1000. 1200. 1400. 1600. 1800. 2000. 2200. Wavelength (nm) Figure 2.2 Sample NIR spectra of the red grape homogenates. 18. 2400.
(34) Figure 2.3 Flow diagram of the adaptive DWT analysis. 2.3.2 Method The experiment was carried out in a three step process. 1. Modeling the NIR spectra initially with Random forest (RF), PDA, and MARSDA. Then apply RF, PDA and MARS-DA on the discrete wavelet transformed (DWT) NIR spectra using the adaptive wavelet, illustrated in Figure 2.3. For both the NIR and DWT analysis, we used the correct classification rate (CCR) as a measure of model performance.. Throughout the modelling phase of the. methodology, we focus on the effects of the fixed effects only. 2. Analysis of the GRBD in Figure 2.1, is performed using the adapted DWT PDA scores from (1) via a MANOVA testing for a. Main effects due to the fixed factors; Storage, Homogenization and Variety, b. Interactions between the main fixed effects, c. Main and interaction effects corresponding to the random effect of Variety replication. 3. Visualization of the Treatment (main and interaction) effects and their corresponding relationships to the adapted DWT coefficients are illustrated using biplots [24]. These effects (corresponding wavelet coefficients) are then mapped onto regions within the normalized NIR spectrum.. 19.
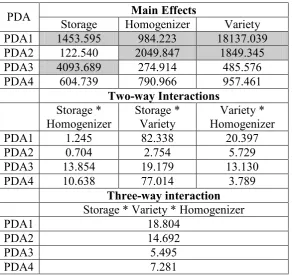
(35) 2.3.3 Software The DWT was coded in Matlab [38] and the optimization function utilized for the adaptive wavelet is the unconstrained optimizer fminu function from the Matlab Optimization Toolbox® [39].. The Random Forest, PDA and MARS-DA were all. generated in R using the modules; randomForest for random forest [40] and mda [41] for PDA and MARS.. The MANOVA model was developed using the manova. command in R [42].. 2.4 Results and Discussion Table 2.1 shows the correct classification rates for the NIR and DWT data using the PDA, MARS-DA and RF methods. Estimates for the dimensionality required for the PDA and MARS-DA models on both the adapted DWT and (SNV transformed) NIR data were taken from the effective rank of the correlation matrices, being three and four respectively.. The correct classification rates (CCR) for all three methods improved substantially when the wavelet coefficients from the adaptive DWT are analyzed rather than the original spectra. Various other Daubechies, Symlets and Coiflets wavelets were also trialed which resulted in higher CCR than the models on the (SNV transformed) NIR data, but did not outperform the adaptive wavelet.. From Table 2.1, the adaptive DWT PDA resulted in the highest CCR of 99.93%. During the MANOVA analysis of the adaptive DWT PDA, it was found that the random effect due to the Variety replication is not significant. This resulted in a simplification of the model which can be analyzed via a three factorial MANOVA.. The MANOVA model, shown in Table 2.2, on the adaptive DWT PDA revealed that all the main fixed effects, two way interactions are significant.. By looking at the. partitioned mean squared error (MSE) in Table 2.3, we can see that the main effects dominate the MSE for all the PDA axes (PDA1, PDA2,…,PDA4). From Table 2.3, PDA1 is largely dominated by the Variety main effect and to a lesser extent by the Homogenizer and Storage main effects. For PDA2, it is the main effects of both the. 20.
(36) Homogenizer and Variety treatments that dominate the MSE. From Table 2.3, PDA3 is largely dominated by the Storage main effect.. Table 2.1 Comparison of SNV and ANV ADWT NIRdata using PDA, MARS and RF analysis techniques. Method PDA MARS RF. SNV treated NIR 63.4 % 58.6% 45.6%. SNV ADWT treated NIR 99.93% 99.2% 76.4%. Table 2.2 Manova based on the PDA (1 to 4) scores from the adapted DWT. Box M statistic = 0.051, Bartletts test for sphericity statistic = 1.000.. Effect Intercept Storage Homogenizer Variety Storage * Homogenizer Storage * Variety Homogenizer * Variety Storage * Variety * Homogenizer. Wilks' Lambda .204 .041 .011 .000 .828 .368 .566 .558. 256.4 1550.9 573.6 3656.4 6.4 42.6 10.2. Hypothesis df 4.0 4.0 8.0 8.0 8.0 8.0 16.0. Error df 263.0 263.0 526.0 526.0 526.0 526.0 804.1. .000 .000 .000 .000 .000 .000 .000. 10.5. 16.0. 804.1. .000. F. Sig.. Table 2.3 Manova partitioned mean squared error. PDA PDA1 PDA2 PDA3 PDA4. PDA1 PDA2 PDA3 PDA4. PDA1 PDA2 PDA3 PDA4. Main Effects Storage Homogenizer Variety 1453.595 984.223 18137.039 122.540 2049.847 1849.345 4093.689 274.914 485.576 604.739 790.966 957.461 Two-way Interactions Storage * Storage * Variety * Homogenizer Variety Homogenizer 1.245 82.338 20.397 0.704 2.754 5.729 13.854 19.179 13.130 10.638 77.014 3.789 Three-way interaction Storage * Variety * Homogenizer 18.804 14.692 5.495 7.281. 21.
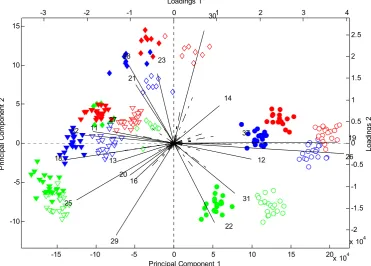
(37) Biplots in Figure 2.4 and Figure 2.5 illustrate the groupings within the adaptive DWT PDA data and the relationships with the wavelet coefficients. Where in the biplots, the bottom and left axes represent the PDA scores (shown as a scatter plot), while the top and right axes are used for the PDA loadings (ray diagram of the wavelet coefficient loadings). The wavelet coefficients in the loadings plots directly relate to localized regions in the NIR spectra centered at: WC*8 + 400nm, where WC is the wavelet coefficient number. Loadings 1 -3. -2. -1. 0. 301. 2. 3. 4. 15 2.5 2. 23. 1.5. Principal Component 2. 21 14. 5. 1. 27 32. 0.5. 11. 37. 19 0. 0 18. 26 -0.5. 12. 13 20. -5. 16. -1 31. 25. -1.5. -10. 22. -2 4. 29 -15. Loadings 2. 28 10. -10. x 10 -5. 0 5 Principal Component 1. 10. 15. 4 20 x 10. Figure 2.4 Biplot of the adapted DWT PDA 1 and PDA 2 of the combined treatments. Adapted DWT PDA 1 and PDA 2 spectra scores are represented by the scatterplot (corresponding to the bottom and left axes respectively) while the ray diagram represents the PDA 1 and PDA 2 wavelet coefficient loadings (corresponding to the top and right axes respectively). Legend: variety A - ♦, variety B - ● variety C –(▼), H1(red), H2(green), H3(blue), Frozen – solid marker, Fresh – open marker. The PDA 1 scores are represented. In the PDA1 and PDA2 biplot, Figure 2.4, there are very distinguishable groups which can be characterized by the variety/homogenizer/storage treatment combination. In Figure 2.5, the biplot of PDA1 ad PDA3, we can see that the frozen and fresh levels are separated by a downwards shift in the direction of PDA3.. 22.
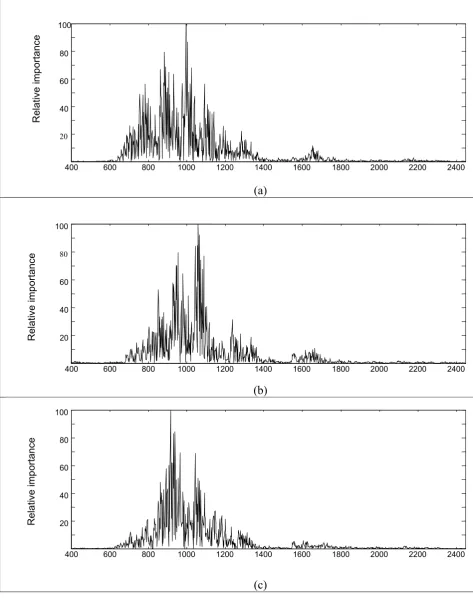
(38) Figure 2.6 shows the regions in the NIR spectrum that relate to the respective PDA axes and hence the different treatment effects. For PDA 1, which is dominated mostly by the Homogenizer treatment; we can identify four main regions: 750-810nm, 860-930nm, 980-1040nm and 1090-1140nm, that relate strongly to PDA 1. The regions that are related to PDA 2, and thus the Homogenizer and Variety main effects are: 850-860nm, 930-980nm and 1040-1085nm. For PDA 3, which is largely dominated by the Storage treatment, the NIR regions 850-980nm and 1040-1075nm were identified.. Loadings 1 -4. -3. -2. -1. 0. 1. 2. 3. 4. 5 3. 29 10 17. 2 22. Principal Component 2. 5. 37 32. 1 19 26. 13 11. 25. 0. 0. 12 27 31. -5. -1. 28 16. 18. Loadings 2. 20. 24 -2 -10 -3 4 x 10 -15. -10. -5 21 0 5 Principal Component 1. 10. 15. 20 4 x 10. Figure 2.5 Biplot of the adapted DWT PDA 1 and PDA 3 of the combined treatments. Legend: variety A - ♦, variety B - ● variety C –(▼), H1(red), H2(green), H3(blue), Frozen – solid marker, Fresh – open marker.. The irregular appearance of the variable importance plot is due to two factors. Firstly PDA axes are typically differential over small regions and secondly, the adapted wavelet is also irregularly differential over localised regions (on the wavelength axis). The irregularity of Figure 2.6 is also compounded the auto-scaling used to obtain the relative importance scale – being the auto-scaling of the absolute value of the inverse transform of the wavelet PDA axis.. 23.
Figure

+7
X8](https://thumb-us.123doks.com/thumbv2/123dok_us/160585.37729/60.595.180.445.438.684/figure-adaptive-wpg-seagrass-data-adaptive-wavelet-parameters.webp)
6](https://thumb-us.123doks.com/thumbv2/123dok_us/160585.37729/61.595.180.446.100.349/figure-standard-wpg-seagrass-wavelet-parameters-daubechies-filter.webp)
Related documents
Despite this caveat, it is well-known from other studies that high-tech start-ups show a higher survival rate - at least in their early years - than other firms (Agarwal, 1998).
In addition, after the implementation stage, a large number of studies indicate that fi rms employ the services of a Chief Risk Of fi cer whose main job is enabling the ef fi cient
In the second design with a hexagonal structure having air holes with unequal diameters, nearly zero dispersion, low nonlinearity and very low confinement loss are obtained..
Abstractive summarization [11] requires understanding of semantics or meaning of sentences to build the summary whereas extractive summarization method selects
Program goals can be defined via several dimensions, including (a) focus on employability through a higher share of practical training or favoring traditional
Objectives: This study established the percentage of veterinary research articles that are freely available online, availability differences inside and outside of core
Traditionally, Hypericum perforatum has a number of different uses including applying it externally as a treatment for wounds and burns, or taken internally as an infusion
suitable for good thermal exchange and low pressure drop in the small regenerative air preheater taking into account the typical pressure drop values and the reduction
