Research and Information Service
Briefing Paper
Paper 04/15 4th December 2014 NIAR 843-14
Caroline Perry
Financing education
Summary
Income sources in Northern Ireland
In Northern Ireland in 2013/14, 0.9% of the Department of Education’s total expenditure was provided by sources other than the allocation from the Northern Ireland Executive – most of this originated in the public sector.
Over three quarters (78%) of this came from the reimbursement of Further Education and Student Support grants from the Department of Employment and Learning (DEL). The remainder included the sales of property, plant and equipment (19%), a
contribution (1%) from the International Fund for Ireland (IFI) and a Capital Grant (1%).
EU funding
European funding streams present a potential source of income for education. In 2012/13 the Department of Education accessed EU funding through the Building Sustainable Prosperity programme, but did not receive any EU funding in 2013/14.
International practice
other private entities, such as businesses, community and religious organisations, have a role in financing education in many countries.
Examples include charter schools in the US and free schools in Sweden, which are publicly funded but privately managed. The schools do not charge tuition fees but often receive significant private investment and some are run on a for-profit basis. The evidence suggests that these approaches have not led to overall gains in educational outcomes.
Chile has the highest levels of private spending on education of any OECD country, with most of this coming from households. Publicly funded schools may charge fees to parents to supplement their income.
Conclusion
The vast majority of the Department of Education’s expenditure comes from the Executive, with a very small proportion emanating from other, mostly public, sources. Schools may raise additional income through voluntary contributions and fundraising. Internationally, education is mostly financed from the public purse, with other income sources including households and other private entities such as businesses and philanthropists.
1
Introduction
In a climate of continuing financial restraint, meeting increasing demands for education from the public purse is becoming more difficult for governments internationally. In addition, balancing public and private financing is seen as a key policy issue for many.1 This briefing paper details sources of income for compulsory school-age education in Northern Ireland and considers EU funding streams. It also outlines the proportions of private and public education spending internationally and considers a number of examples of income generation within the education sector.
2
Northern Ireland
In 2013/14 the Department of Education’s (the Department’s) total expenditure was around £2.1bn, of which £19.6m (or 0.9%) came from sources of income other than its allocation from the Executive.2
1 OECD (2013) Education at a Glance 2013: OECD Indicators OECD Publishing 2
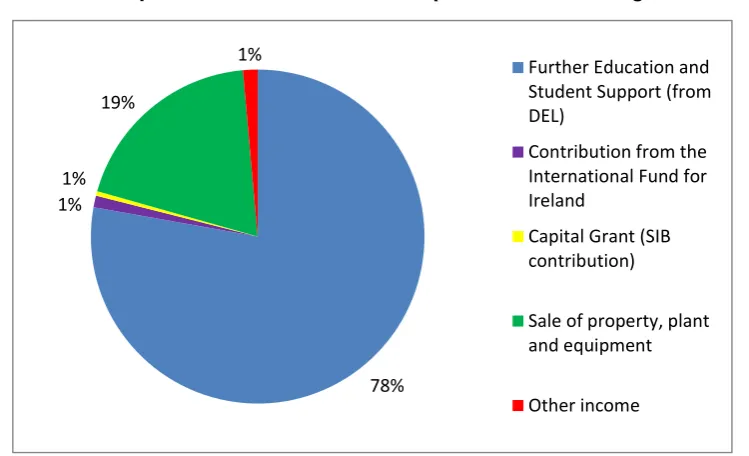
Figure 1: The Department’s income sources (other than the budget allocation)
Figure 1 shows that the majority of the Department’s other income relates to Further Education and Student Support from the Department of Employment and Learning (DEL). This is a reimbursement from DEL for grants paid by the Department to its Non Departmental Public Bodies (NDPBs) for DEL activities they carry out. As such, it does not represent additional income. The other sources include:3
Strategic Investment Board (SIB) Capital Grant: SIB provides 50% of certain costs for the Lisanelly Shared Education Campus;
Sales of property, plant and equipment: when an asset is disposed of by an ELB the proceeds are paid to the Department. Grant recovery is applied to assets in the voluntary grammar, maintained and grant-maintained integrated school sectors;
Other income: includes internal audit services provided to other departments, refunds from public sector organisations of prior year unspent funding and income from the provision of Education Inspection Services to public and private sector organisations.
School-level income generation
The Education Reform (NI) Order 1989 allows the Board of Governors of any grant‐ aided school to request voluntary contributions aiming to benefit the school. However, any such request must make it clear that there is no obligation to make the
3
Information provided by the Department of Education, December 2014
78% 1%
1% 19%
1%
Further Education and Student Support (from DEL)
Contribution from the International Fund for Ireland
Capital Grant (SIB contribution)
Sale of property, plant and equipment
contribution.4 Schools may also generate additional income through sponsorship schemes and fundraising activities.5
The legislation permits Boards of Governors of voluntary grammars to make a charge in respect of a registered pupil as follows (up to a maximum of £140):6
A voluntary grammar eligible for 85% capital grants on an approved capital development scheme may make a charge to meet the 15% balance of
expenditure incurred in relation to the provision or alteration to school premises; and the provision of equipment;
A voluntary grammar eligible for 100% capital grants on an approved capital scheme may make a charge only to meet any outstanding deficit on a completed capital development scheme which was 85% grant-aided by DE.
3
EU funding
In 2012-13 the Department received almost £2m from the EU Building Sustainable Prosperity programme which includes a focus on skills development. In the past ten years it has also accessed funds from PEACE II. In 2013-14 the Department did not receive any EU funding.7
A potential source of income for the education sector relates to European Funding Streams. Erasmus+ is the new education, training, youth and sport funding programme for the period 2014-2020. It replaces previous funding programmes including Comenius and Youth in Action programmes, the main sources of EU funding accessed by the Department of Education. The key areas of the programme are:8
Joint working and the sharing of good practice across organisations;
Support for policy reform (any activity aimed at facilitating the modernisation of education systems);
Learning mobility for individuals;
Jean Monnet Activities (supporting excellence in European integration studies);
Sport (funding is available to support grassroots activities).
The Minister for Education, John O’Dowd MLA, has stated that the Department is “proactively exploring” the potential for accessing EU structural funds to support
4
Legislation.gov.uk The Education Reform (Northern Ireland) Order 1989 [online] Available at:
http://www.legislation.gov.uk/nisi/1989/2406/contents
5
Department of Education (2010) Chapter 8: financial management of guide for school governors [online] Available at:
http://www.deni.gov.uk/contact-us/schools_79_governor-roles-and-responsibilities_pg.htm
6
Department of Education School fees, charges and remissions [online] Available at: http://www.deni.gov.uk/index/85-
schools/5-school-management/79-school_governors_pg/schools_79_governor-roles-and-responsibilities_pg/schools_79_chapter-19-fees-and-charges_pg.htm#prohibited-fees-and-charges_alink Accessed 2/12/14
7 Information provided by the Department of Education, December 2014 8
intervention activities in science, technology, engineering and mathematics (STEM) and business education, as well as programmes such as Peace IV.9
More detailed information can be found in Paper 22/14: European Funding Streams: Education.
4
International overview
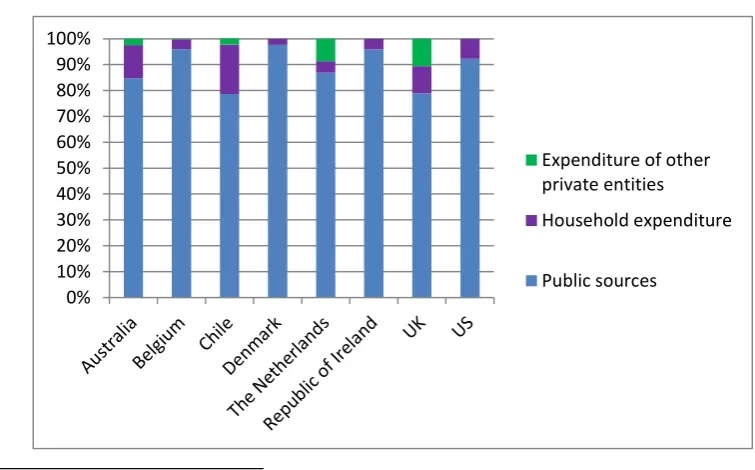
On average, 92% of all funds for primary and post-primary education internationally come from public sources. However, the role of other sources of funding is becoming increasingly important. For all levels of education combined, public investment in education increased by an average of 7% across OECD countries from 2008-2011.10 Figure 2 presents the proportion of expenditure on educational institutions from public and private sources at primary, post-primary and further education levels across a number of countries. It includes the three main sources of finance for education:
Public expenditure: the percentage of total spending originating in the public sector;
Household expenditure: the largest share of private expenditure in most countries comes from households, and goes mainly towards tuition; Other private entities: includes private businesses and non-profit
[image:5.595.83.461.476.711.2]organisations (such as religious, charitable and business organisations).
Figure 2: Proportion of public and private expenditure on primary, post-primary education and post-primary further education11
9
Northern Ireland Assembly Hansard Minister for Education response to an Assembly Question by Mr Daithí McKay MLA
[online] Available at: http://www.niassembly.gov.uk/Assembly-Business/Official-Report/Reports-13-14/14-January-2014/#AQO%205295/11-15 Accessed 1/12/14
10 OECD (2013) Education at a Glance 2013: OECD Indicators OECD Publishing 11
As above
0% 10% 20% 30% 40% 50% 60% 70% 80% 90% 100%
Expenditure of other private entities
Household expenditure
5
Examples of income generation
This section provides a number of examples of income generation for education employed around the world.
England: other sources of funding and academies
Although the vast majority of education funding in England comes from the public purse, a significant amount arises from other sources.12 These include:13
Donations or voluntary contributions;
Income from facilities and services;
Investment income;
Other self-generated income.
Data for the 2012/13 school year indicates that secondary academies on average generated £206 of income for each pupil, representing 4% of their total income (the remainder was from grant funding).14 Local authority maintained secondary schools on average generated £326 or 6% of the total expenditure per pupil.15 However, some schools have generated income as high as 42% of their total expenditure.16
Philanthropy can provide an additional source of education funding for education; this tends to be tied to specific targeted educational activities, often for disadvantaged pupils.17
Academy sponsorship
An academy is a government-funded independent school; it has independence from the local authority and greater autonomy over matters such as teacher salaries and the curriculum than other schools. Any school may become an academy and they may do so with or without a sponsor. Sponsors include religious organisations, philanthropists and educational institutions.18
Initially, sponsors had to provide 10% of the capital costs for a new building, up to a maximum of £2m; however the requirements have since been changed.19 While
12 Power, S., Taylor, C (2013) “Social justice and education in the public and private spheres”
Oxford Review of Education Vol. 39, No. 4, pp. 464-479
13
Gov.uk (2014) Income and expenditure in academies in England: 2012 to 2013 [online] Available at:
https://www.gov.uk/government/statistics/income-and-expenditure-in-academies-in-england-2012-to-2013 Accessed 1/12/14
14
As above
15
As above
16 Power, S., Taylor, C (2013) “Social justice and education in the public and private spheres”
Oxford Review of Education Vol. 39, No. 4, pp. 464-479
17
As above
18
Gov.uk (2014) Become an academy: information for schools [online] Available at: https://www.gov.uk/become-an-academy-information-for-schools Accessed 25/11/14
19
academy sponsors are not now required to provide funding to the academy, some choose to provide financial support in order to broaden opportunities for children.20
Charter schools in the US
The US has supported non-public finance in education for many years, motivated by concerns around the inadequacy of public systems and a lack of school options for disadvantaged communities. Policymakers and philanthropists have introduced a number of initiatives such as:21
Privately and publicly funded vouchers for education in many cities and states;
Expanding the use of tax credits to subsidise choice of private schools;
Reducing restrictions on home-schooling.
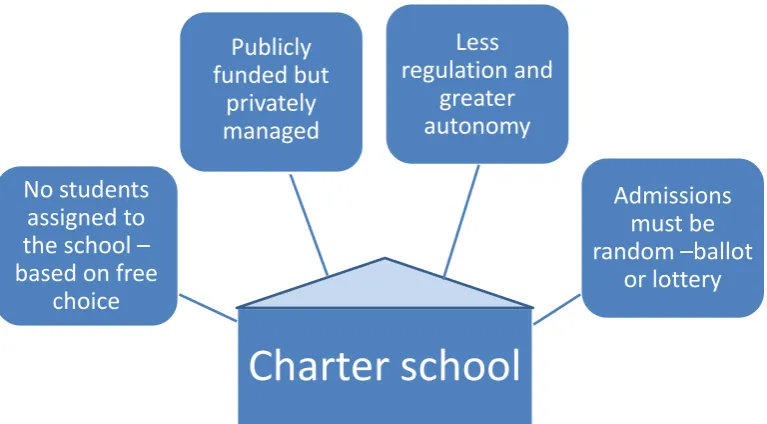
[image:7.595.103.487.414.626.2]Charter schools are privately run but publicly funded, and do not require tuition fees from parents. Charter schools often receive significant private investment22 and some are run on a for-profit basis. The idea is to move away from a system of public school districts (often with many failing schools) by introducing private providers to the market.23
Figure 3: Key features of a charter school
The evidence suggests that academic outcomes at charter schools are often no better, and in some cases worse, than those at district-run schools. A comprehensive study
20
Browne Jacobson (2014) FAQs - becoming an academy sponsor [online] Available at:
http://www.educationadvisors.com/resource/faqs-becoming-academy-sponsor/ Accessed 25/11/14
21 Lubienski, C. (2013) “Privatising form or function? Equity, outcomes and influence in American charter schools”
Oxford Review of Education Vol. 39, No. 4, pp 498-513
22
Strauss, V. (2013) Why wealthy foreigners invest in U.S. charter schools Washington Post [online] Available at:
http://www.washingtonpost.com/blogs/answer-sheet/wp/2013/02/15/why-wealthy-foreigners-invest-in-u-s-charter-schools/
23 Lubienski, C. (2013) “Privatising form or function? Equity, outcomes and influence in American charter schools” Oxford
Review of Education Vol. 39, No. 4, pp 498-513
Charter school
No students
assigned to
the school –
based on free
choice
Admissions
must be
random –ballot
or lottery
Less
regulation and
greater
autonomy
Publicly
found that outcomes were significantly better than in comparable schools in only 17% of charter schools, while more than a third significantly underperformed.24
Although admissions must be random where schools are oversubscribed, research indicates that charter schools tend not to admit less academically able students, possibly due to the profile of families likely to apply to charter schools, or that the schools “shed” other types of students.25
Free schools in Sweden
Sweden pioneered the free school approach in 1992, and Sweden remains the only country in the world with a nationwide network of for-profit education providers. Private equity firms and venture capitalists have invested significant sums into free schools.26 The evidence indicates that free schools have not led to significant overall gains in educational outcomes. In addition, free schools have led to an increase in social segregation, and have led to greater costs for municipalities.27
The involvement of the private sector in education in Sweden is now being called into question and the Government is planning to introduce legislation requiring private companies to reinvest all profits back into the schools.28
School tuition fees in Chile
Chile has the highest proportion of private spending on education of any OECD country (including third-level education) – much of this comes from households. At primary, secondary and non-tertiary post-secondary levels private sources account for 21% of per capita spending (the OECD average is 9%).29
Publicly subsidised schools are permitted to charge tuition fees to supplement their funding. All schools with students from disadvantaged backgrounds can apply for an additional subsidy. As well as schools run by municipalities, Chile has a high proportion of publicly funded but privately managed schools.30
6
Conclusion
This briefing note shows that the vast majority of the Department of Education’s expenditure comes from the Executive, with a very small proportion emanating from other, mostly public, sources.
24
Raymond, M.E. (2009) Multiple Choice: Charter school performance in 16 states Stanford: Stanford University
25 Lubienski, C. (2013) “Privatising form or function? Equity, outcomes and influence in American charter schools”
Oxford Review of Education Vol. 39, No. 4, pp 498-513
26
Vaughan, R. (2014) No return for Sweden’s free schools Times Educational Supplement, 24th October 2014
27
Wiborg, S. (2010) Swedish Free Schools: Do they work? London: Centre for Learning and Life Chances in Knowledge Economies and Societies
28
Vaughan, R. (2014) No return for Sweden’s free schools Times Educational Supplement, 24th October 2014
29 OECD (2013) Education Policy Outlook: Chile OECD Publishing 30