Multi-objective Optimal Design of a
Fluidic Thrust Vectoring Nozzle
Andr´
as S´
obester
∗, Andy J. Keane
†University of Southampton, Southampton, Hampshire, SO17 1BJ, UK
Fluidic Thrust Vectoring (FTV) systems based on Coand˘a jets are amongst the most promising technologies being considered for future flapless aircraft. One of the core components of a Coand˘a FTV device is the main jet nozzle, featuring a circular inflow section (at the aft end of the engine) and a high aspect ratio, rectangular outflow section. The aerodynamic performance of this nozzle, in terms of its pressure losses and outflow velocity field distortion, is critical from the control authority point of view, especially at throttle settings typical for low speed maneuvers and approach. The present article reports on an optimization study aimed at finding high quality nozzle shapes based on these considerations.
I. Introduction
F
LUIDICS, that is, the science of using fluid flow interactions to generate changes in a flow field, is widely regarded as the most likely technology to bring about a revolution in thrust vectoring. Compared to conventional, mechanical thrust vectoring systems, fluidic thrust vectoring has the potential to reduce complexity (small number of moving parts), weight and observability, while improving reliability and survivability.Over the past decade a number of such fluidic concepts have been developed. Perhaps the first major step in this direction was made in 1997 by Glezer and Smith,1 who presented a system based
onsynthetic jets. These are typically generated by time-periodic alternate ejection and suction of the working fluid through an orifice in the flow boundary.2 When placing the synthetic jet actuator on
top of a main jet exit duct, the series of vortex rings it produces (when engaged) causes a reduction in pressure above the main jet, which is thus vectored upwards.3 A number of alternative techniques
fol-lowed, includingfluidic throat skewing,4shock-wave manipulation,counterflow vectoring5andCoand˘a
surface blowing. It is the latter that forms the subject of the present study.
A jet of fluid may be deflected by the close proximity of a convex, curved surface. This phenomenon, known as theCoand˘a effect, is the operating principle of the Fluidic Thrust Vectoring (FTV) system discussed here. Two secondary jet nozzles (usually with a high aspect ratio rectangular cross section) are placed above and below the main jet nozzle (also of a slender rectangular cross section). Deflections
∗Research Fellow, Computational Engineering and Design Group, AIAA Member.
†Professor of Computational Engineering, Chair of Computational Engineering and Design Group.
1
American Institute of Aeronautics and Astronautics
11th AIAA/ISSMO Multidisciplinary Analysis and Optimization Conference
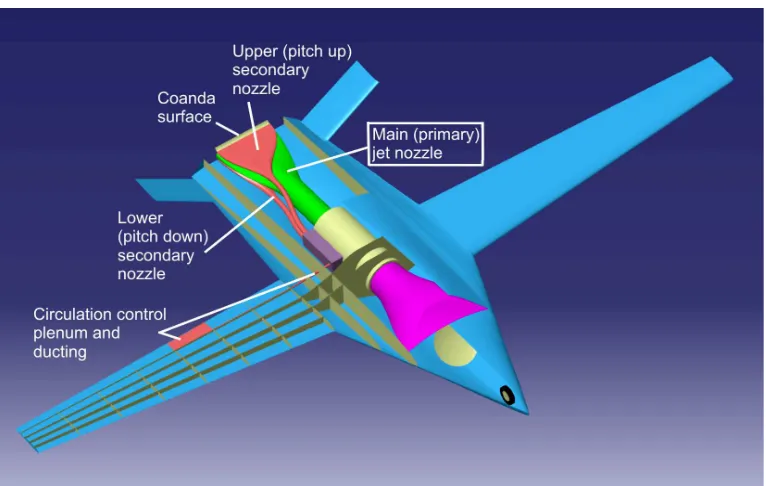
of the secondary jets, caused by curved surfaces mounted alongside them, trigger a deflection of the main jet. Thus, pitch control can be achieved by controlling the velocity of the secondary jets (see Figure 1 for an illustration of the concept).
Fig. 1 Conceptual sketch of the fluidic thrust vectoring system, showing the case where only
the top secondary duct is fed with bleed air, commanding pitch-up by an upwards deflection of the main jet.
Experimental investigations6 have highlighted a number of critical design issues related to the
shape of the main jet nozzle and the present work focuses on these. First, unless carefully designed, a duct with considerable cross-sectional shape variations is prone to pressure losses – this can certainly be the case here as the cross-section of the main jet varies from a circle at the engine outflow to a high aspect-ratio rectangle at the outflow (more on this shortly). An inefficient duct is likely to mean reduced thrust and increased fuel consumption; additionally, some control authority must be maintained even at low throttle settings and this can only be achieved through low-loss ducting. Therefore, one of the objectives of the shape optimization study presented here is the maximization of the duct’s overall pressure coefficient.
Another critical design driver is the shape of the main jet outflow velocity profile. The effectiveness of an FTV system can be significantly impaired by a ‘peaky’ profile, i.e., if the speed of the flow is high in the centre but falls away sharply towards the side walls. This can be avoided by careful shaping of the nozzle and thus a second objective can be formulated: the outflow distortion factor must be minimized.
In the following we describe this multi-objective study. The design search is based on a global response surface model with a Latin Hypercube initial sample and Bayesian updates, trained with data obtained from Reynolds-Averaged Navier-Stokes (RANS) simulations – more details on this in Section 3. For now, let us review the problem formulation and the parameterization developed from it, which forms the basis of the present design study.
II. Geometry – Constraints and Design Variables
The motivation for the work presented here is the development of a flapless Unmanned Air Vehicle (UAV) concept, where roll control is achieved by means of a circulation control system and fluidic thrust vectoring based on Coand˘a surface blowing provides single-axis pitch control. The concept
vehicle, developed using the design tool described in detail in Ref. 7, is shown in Figure 2.
Fig. 2 Unmanned Air Vehicle concept featuring a Coand˘a surface blowing fluidic thrust vec-toring system.
The object of the design study is the shape of the main jet duct, highlighted with a thicker black line in the longitudinal section sketch (Figure 1) and shown sandwiched between the two secondary jet nozzles in Figure 2. For the purposes of this investigation we assume that the location of the engine is fixed and therefore so is the total length of the duct∗. We also assume that we begin the transition
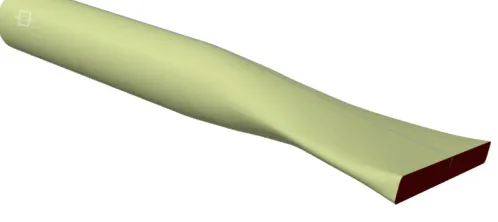
from the circular cross section (imposed by the engine outflow geometry) to the duct outflow cross section (10 : 1 aspect ratio rectangle, see Figure 3) at the halfway point along the length of the duct. The areas of the inflow (circular) and outflow (rectangular) cross sections are equal and held fixed and the aim is to design a transition between the two that does not deviate from this target area by more than 2%.
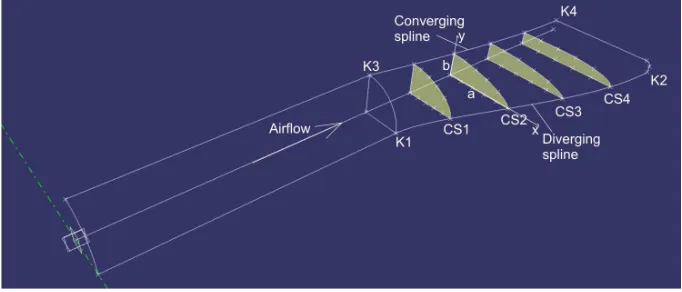
We achieve this by defining four equally spaced control sections (denoted by CS1 through CS4 in Figure 4). The shape of each control section is defined as a second degree conic of the form Γ =c1+c2x+c3y+c4xy+c5x2y+c6xy2= 0 (for the definitions of thexandy axes refer to Figure
4, where CS2 is highlighted as an example), where the coefficients c1 through c6 are obtained by
imposing a set of five constraints on each conic, as follows.
∗The design of propulsion systems featuring FTV controls raises a number of interesting issues that stem from having
to, to some extent, design the airframe around the FTV system. The main reason for this is that the conventional logic of airframe design around normal propulsion systems assumes that a) the width (diameter) of the nozzle is generally less than the external diameter of the engine and b) very little fuselage space is required aft of the engine. Neither assumption applies here and therefore the design drivers that determine the shape of the airframe are somewhat idiosyncratic – this, however, lies outside the scope of the present study.
[image:3.612.115.498.60.303.2]Fig. 3 An example of a main jet duct geometry, built in CATIA.R
Constraint 1 LetY(x) denote the explicit definition of the conic Γ in terms ofx. We impose the condition that the area under the conic has to be equal to the target areaA(this is a quarter of the inflow and outflow areas, as the conics only describe a quadrant of the geometry – one such quadrant is shown in Figure 4):
Z a
0
Y(x) =A (1)
whereais the height the conic has to cover (see Figure 4).
Constraint 2 The conic has to intersect they axis at a distanceb from the origin.
Y(0) =b (2)
Constraint 3 The conic has to intersect thex axis at a distanceafrom the origin.
Y(a) = 0 (3)
Constraint 4 The conic has to tend towards the horizontal as it intersects they axis. This is to ensure continuity with its mirror image, which will make up the other side of the nozzle.
dY dx 0
= 0 (4)
Constraint 5For similar reasons as before, the conic has to tend towards the vertical as it intersects thexaxis
dX dy 0
= 0 (5)
whereX(y) denotes the explicit definition of the conic Γ in terms ofy.
Since this system of five equations would be very difficult to solve analytically, we compute the coefficientsc1, . . . , c6numerically, by minimizing the residual:
R(c1, . . . , c6) =
Z a
0
(Y(x)−A) 2
[image:4.612.183.432.69.180.2]Fig. 4 The parametric geometry used in the optimization study.
The minimization of the residual (6) can be regarded as a low level optimization problem, solved as a Lamarckian learning process integrated into the high level problem of optimizing the shapes of the two curves that control the rate at which the nozzle expands in the horizontal plane and converges in the vertical plane†. These two curves are splines defined by the knotsK1 throughK4, in which they
are tangent to the direction of the central axis of the duct. Thelocal stiffnesses of the two splines at the knots determine their shapes and are, therefore, our high level design variables: v1 is the tension
in the diverging spline near knotK1,v2controls the stiffness of the same spine at its other end (K2);
v3 andv4are defined in a similar fashion.
To summarize, we have conceived the parameterisation with a two-level design search in mind. At the top level,v1, . . . , v4define the overall shape of the duct, whilec(CS1)1 , . . . , c
(CS1) 6 , . . . , c
(CS4) 1 , . . . , c
(CS4) 6
have to be computed for each candidate solution (each set of v’s) in such a way that they minimize R, as defined by Equation (6) (the superscripts in the above variable list denote which control section the corresponding coefficients refer to).
III. The Optimization Study
Objectives
We have alluded in the introduction to the bi-objective nature of our design problem. On the one hand, we aim to minimize pressure losses through the duct. We achieve this by maximizing the pressure coefficient, defined as the difference between the total pressures at the outflow and inflow, normalized by the freestream dynamic pressure:
Cp=
Poutflow−Pinflow
q∞
(7)
On the other hand, a uniform outflow velocity is desirable. We quantify this via a distortion factor, defined as the difference between the maximum and minimum outflow total pressure values, normalized
†Of course, we mean ‘converge’ and ‘diverge’ in a figurative sense here – after all, we aim to keep the cross-sectional
area constant. We merely use these terms to indicate that the constant area results from an increase in the width of the cross sections and a decrease in their height.
[image:5.612.135.476.44.190.2]by the mass-weighted average total pressure, which must be minimized:
D=P
max
outflow−Poutflowmin
Pmean outflow
. (8)
Thus, aD value of zero would imply uniform outflow throughout the nozzle.
Cp andD are computed via a RANS simulation in FluentR using ak−turbulence model.
Search
The relatively high computational cost of each evaluation (around 10 hours per design) and the small number of design variables make this problem a good candidate for optimization based on a global response surface model. The design search approach adopted here is broadly similar to that described by Jones.8
First, an initial sampling plan of 100 designs has been generated, using a Morris-Mitchell-optimal Latin Hypercube design of experiments (DoE). The flowfield through 90 of these nozzles has been computed successfully via RANS simulations (the remaining 10 runs failed to converge). A Gaussian Radial Basis Function (RBF) model was then built, using a leave-k-out crossvalidation procedure to find the value of the model’s single hyperparameter that, based on the available data, is likely to minimize the generalization error (or true risk). The aim here is, of course, to generate a model that predicts unseen data as accurately as possible – leave-k-out crossvalidation provides an estimate of the true risk, as a function of the hyperparameter of the model - this can then be minimized (for a detailed discussion on the factors influencing the bias of this estimator the interested reader may wish to refer to the excellent treatise by Hastie et al.9).
A hierarchical axis representation of the distortion factor response surface (after the initial set of 90 points) is shown in Figure 5. Each tile of the plot represents a section through the landscape showing v4 versus v2, with the values ofv1 and v3 determined by the location of the tile within the
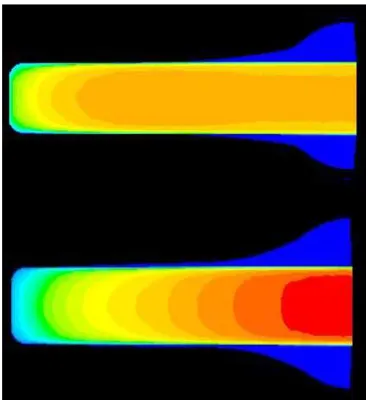
grid. Two examples are highlighted on the plot, a low distortion and a high distortion design – the corresponding velocity profiles are depicted in Figure 6. Each figure represents the left half of the (symmetrical) nozzle, as viewed from behind the aircraft.
The initial set of 90 runs was then followed by expected improvement updates, based on the global response surface model built on the initial latin hypercube set. Expected improvement, as the name suggests, is the statistical expectation of the improvement, that is, of the difference between the current best value and the objective value of the next sample point. The update process is thus based on computing the expected improvement surface for the entire design space and finding its global maximum (in this case we have used a multi-start local search to do this) – this will be the location of the next update (see Refs. 10 and 8 for more details on how to do this).
These were performed by alternating between the two responses, i.e., a pressure coefficient expected improvement update was followed by sampling at the maximum expected improvement in distortion
Fig. 5 Hierarchical axis contour plot of the distortion coefficient D versus the four design variables. The main axes represent v1 and v3, while the individual tile axes are v2 and v4
respectively.
Fig. 6 The examples of good (top) and bad (bottom) designs highlighted in Figure 5 – note the sharp velocity peak in the middle of the design shown at the bottom (D= 1.833, Cp=−0.467), compared against the flat velocity profile of the design shown above it (D= 1.607,Cp=
−0.368) .
[image:7.612.143.461.69.301.2] [image:7.612.214.398.388.588.2]-0.6 -0.55 -0.5 -0.45 -0.4 -0.35 -0.3
1.4 1.6 1.8 2 2.2
Distortion
C
p
Initial DoE Updates
Fig. 7 Cp versus distortion.
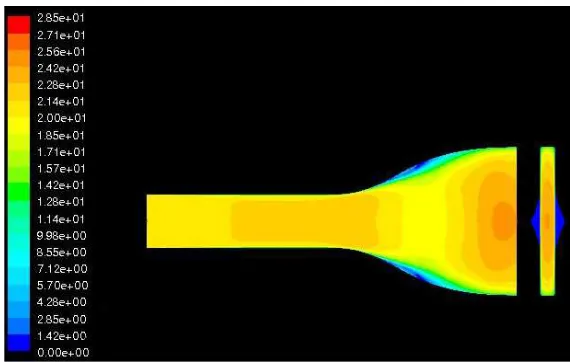
Fig. 8 Velocity magnitude contours on the design with the lowest distortion and lowest pressure loss.
coefficient point and so on‡. A total of 16 such updates have been computed and the quality metrics
of the designs resulting from these are shown in Figure 7, along with the those of the 90 initial designs.
The fourth of the 16 updates produced the best design, with a distortion factor of 1.471 and a pressure coefficient of -0.329 – this is indicated by the triangle in the upper left-hand corner of the scatter plot. A longitudinal section through the velocity magnitude field of this nozzle, as well as a cross section through the same field at the outflow are shown in Figure 8.
‡We note here that a more sophisticated update technique is available for cases where the two objectives are in
conflict and therefore a Pareto-front is sought.11
[image:8.612.143.474.45.236.2] [image:8.612.162.447.280.461.2]Conclusions
We have shown through the computational experiments described in this paper that the shape of the transition section of a circle-to-rectangle nozzle (with a rectangle aspect ratio of 10) has a significant impact on the flow field at the outflow, both in terms of its average pressure, as well as its pressure and velocity distribution. The optimization process based on these experiments was designed to minimize the pressure losses in the nozzle, while aiming to “flatten” the velocity profile at the outflow.
The design search process described here could be repeated with other goals, for example those related to the use of this type of nozzle for infrared signature reduction and jet noise attenuation (a recent article by Manneville12discusses the latter aspect in detail).
Acknowledgements
The work reported in this paper is part of the FLAVIIR (Flapless Vehicle Industry-Integrated Research) project, funded by BAE Systems and the UK Engineering and Physical Sciences Research Council.
References
1
Glezer, A. and Smith, B. L., “Vectoring and Small-Scale Motions Effected in Free Shear Flows Using Synthetic Jet Actuators,”AIAA paper 97-021, 1997.
2
Smith, B. L. and Glezer, A., “Vectoring of Adjacent Synthetic Jets,” AIAA Journal, Vol. 43, No. 10, 2005, pp. 2117–2124.
3
Kowal, H. J., “Advances in Thrust Vectoring and the Application of Flow Control Technology,”Canadian Aero-nautics and Space Journal, Vol. 48, No. 2, 2002, pp. 145–151.
4
Yagle, P. J., Miller, D. N., Ginn, K. B., and Hamstra, J. W., “Demonstration of Fluidic Throat Skewing for Thrust Vectoring in Structurally Fixed Nozzles,”Transactions of ASME, Vol. 123, 2001, pp. 502–507.
5
Strykowski, P. J., Krothapalli, A., and Forliti, D. J., “Counterflow Thrust Vectoring of Supersonic Jets,”AIAA Journal, Vol. 34, No. 11, 1996, pp. 2306.
6
Sparks, R., Michie, S., Gill, K., Crowther, W. J., and Wood, N. J., “Development of an Integrated Circulation Control and Fluidic Thrust Vectoring Flight Test Demonstrator,” 1st International Conference on Innovation and Integration in Aerospace Sciences, 2005.
7
Sobester, A. and Keane, A. J., “Multidisciplinary Design Optimization of UAV Airframes,”AIAA 2006-1612, 2006, pp. 1–13.
8
Jones, D. R., Schonlau, M., and Welch, W. J., “Efficient Global Optimization of Expensive Black-Box Functions,”
Journal of Global Optimization, Vol. 13, 1998, pp. 455–492.
9
Hastie, T., Tibshirani, R., and Friedman, J.,The Elements of Statistical Learning, Springer-Verlag, New York, 2001.
10
Keane, A. J. and Nair, P. B.,Computational Approaches to Aerospace Design: the Pursuit of Excellence, John Wiley & Sons, Chichester, 2005.
11
Keane, A. J., “Statistical Improvement Criteria for Use in Multiobjective Design Optimization,”AIAA Journal, Vol. 44, No. 4, 2006, pp. 879–891.
12
Manneville, A., Pilczer, D., and Spakovszky, Z. S., “Preliminary Evaluation of Noise Reduction Approaches for a Functionally Silent Aircraft,”Journal of Aircraft, Vol. 43, No. 3, 2006, pp. 836–840.