Egidio Brocca-Cofano,
a,bDavid Kuhrt,
a,bBasile Siewe,
cCuiling Xu,
a,dGeorge S. Haret-Richter,
a,bJodi Craigo,
a,dCelia Labranche,
eDavid C. Montefiori,
eAlan Landay,
cCristian Apetrei,
a,dIvona Pandrea
a,bCenter for Vaccine Research, University of Pittsburgh, Pittsburgh, Pennsylvania, USAa; Departments of
Pathologyband Microbiology and Molecular Genetics,dSchool of Medicine, University of Pittsburgh,
Pittsburgh, Pennsylvania, USA; Department of Immunology and Microbiology, Rush University Medical Center, Chicago, Illinois, USAc; Duke Human Vaccine Institute, Duke University School of Medicine, Durham, North
Carolina, USAe
ABSTRACT
We compared and contrasted pathogenic (in pig-tailed macaques [PTMs])
and nonpathogenic (in African green monkeys [AGMs]) SIVsab infections to assess
the significance of the B cell dysfunction observed in simian (SIV) and human
immu-nodeficiency virus (HIV) infections. We report that the loss of B cells is specifically
as-sociated with the pathogenic SIV infection, while in the natural hosts, in which SIV is
nonpathogenic, B cells rapidly increase in both lymph nodes (LNs) and intestine.
SIV-associated B cell dysfunction SIV-associated with the pathogenic SIV infection is
charac-terized by loss of naive B cells, loss of resting memory B cells due to their
redistribu-tion to the gut, increases of the activated B cells and circulating tissue-like memory
B cells, and expansion of the B regulatory cells (Bregs). While circulating B cells are
virtually restored to preinfection levels during the chronic pathogenic SIV infection,
restoration is mainly due to an expansion of the “exhausted,” virus-specific B cells,
i.e., activated memory cells and tissue-like memory B cells. Despite of the B cell
dys-function, SIV-specific antibody (Ab) production was higher in the PTMs than in AGMs,
with the caveat that rapid disease progression in PTMs was strongly associated with
lack of anti-SIV Ab. Neutralization titers and the avidity and maturation of immune
responses did not differ between pathogenic and nonpathogenic infections, with
the exception of the conformational epitope recognition, which evolved from low to
high conformations in the natural host. The patterns of humoral immune responses
in the natural host are therefore more similar to those observed in HIV-infected
sub-jects, suggesting that natural hosts may be more appropriate for modeling the
im-munization strategies aimed at preventing HIV disease progression. The numerous
differences between the pathogenic and nonpathogenic infections with regard to
dynamics of the memory B cell subsets point to their role in the pathogenesis of
HIV/SIV infections and suggest that monitoring B cells may be a reliable approach
for assessing disease progression.
IMPORTANCE
We report here that the HIV/SIV-associated B cell dysfunction (defined
by loss of total and memory B cells, increased B regulatory cell [Breg] counts, and B
cell activation and apoptosis) is specifically associated with pathogenic SIV infection
and absent during the course of nonpathogenic SIV infection in natural nonhuman
primate hosts. Alterations of the B cell population are not correlated with
produc-tion of neutralizing antibodies, the levels of which are similar in the two species.
Rapid progressive infections are associated with a severe impairment in SIV-specific
antibody production. While we did not find major differences in avidity and
matura-tion between the pathogenic and nonpathogenic SIV infecmatura-tions, we identified a
ma-jor difference in conformational epitope recognition, with the nonpathogenic
infec-Received21 June 2017Accepted12
September 2017
Accepted manuscript posted online20
September 2017
CitationBrocca-Cofano E, Kuhrt D, Siewe B, Xu
C, Haret-Richter GS, Craigo J, Labranche C, Montefiori DC, Landay A, Apetrei C, Pandrea I. 2017. Pathogenic correlates of simian immunodeficiency virus-associated B cell dysfunction. J Virol 91:e01051-17.https://doi .org/10.1128/JVI.01051-17.
EditorGuido Silvestri, Emory University
Copyright© 2017 American Society for
Microbiology.All Rights Reserved.
Address correspondence to Cristian Apetrei, [email protected].
on November 7, 2019 by guest
http://jvi.asm.org/
tion being characterized by an evolution from low to high conformations. B cell
dysfunction should be considered in designing immunization strategies aimed at
preventing HIV disease progression.
KEYWORDS
B cell, follicular T helper cells, humoral immune response, immune
activation, nonpathogenic infection, pathogenic infection, simian immunodeficiency
virus
U
nderstanding the pathogenic interactions between the simian immunodeficiency
viruses (SIVs) and the nonhuman primate hosts (NHPs) can lead to the
develop-ment of new strategies to control human immunodeficiency virus (HIV) infection and
prevent disease progression. Such studies may be even more meaningful if they involve
comparisons between pathogenic and nonpathogenic SIV infections with regard to a
given component of the immune system, to assess its potential role in shaping the
outcome of SIV infection.
African NHP species that are natural hosts of SIVs generally do not progress to AIDS
when infected with their species-specific SIV, in spite of high levels of chronic viral
replication (1–4). The lack of disease progression in natural hosts is due not to exquisite
immune responses (5–9) but to the ability of the natural hosts to maintain the T cell
homeostasis through multiple mechanisms: (i) resolution of chronic immune activation
and inflammation at the transition from acute to chronic infection (2, 10–18), (ii)
restriction of SIV infection and preservation of critical CD4
⫹T cell subsets (18–23), and
(iii) modulation of target cell availability (18, 24, 25). These multiple host adaptations
aimed at preventing the deleterious consequences of SIV infection and progression
to AIDS occurred during hundreds of thousands to millions of years of coevolution
between SIVs and their hosts (26–28).
In addition to the pathogenic features listed above, numerous studies recently
identified various differences between pathogenic and nonpathogenic infections with
regard to multiple immune cell subsets (CD4 cells, Th17 cells, regulatory T cells [Treg],
myeloid dendritic cells [mDCs], mesenchymal stem cells [MSCs], natural killer T cells
[NKT], etc.) (29–31). It is therefore considered that comparing and contrasting the fates
of various immune effectors between pathogenic and nonpathogenic models of HIV
infection will allow us to understand their contributions to the pathogenesis of AIDS
(32–36).
There is a renewed interest in understanding the role of B cells in HIV infection,
mostly due to the discovery of the broadly neutralizing antibodies and to the results
from multiple animal studies and clinical vaccine trials demonstrating that an effective
humoral immunity can prevent HIV acquisition (37–39). Although HIV/SIV do not
productively infect B cells, a significant feature of the pathogenesis of HIV/SIV infection
is generalized B cell dysfunction and dysregulation. Hypergammaglobulinemia,
poly-clonal activation, poor immune responses to pathogens and vaccine antigens,
imbal-ance in B cell subsets, and increased B cell turnover have been associated with
persistent HIV/SIV replication and represent important features of B cell dysfunction
(40). Numerous studies carried out with both humans and rhesus macaques (RMs)
suggested that this B cell dysfunction may play a central role in the progression to AIDS
(41), through alterations of the different subsets of circulating or tissue-resident B cells
(42) and low antibody (Ab) responses (43, 44). A generalized loss of memory B cells was
reported to be the major characteristic of B cell dysfunction in SIV-infected RMs (45). B
cells not being infected by HIV or SIV, the mechanisms of their loss are not well
understood. While a large body of literature suggested a role for either the Fas pathway
(46) or the programmed death 1 (PD-1) pathway in B cell exhaustion and dysregulation
of B cell homeostasis (47), very little is known about B cell survival during HIV/SIV
infection and progression to AIDS.
With the goal to better understand the role played by B cell immune dysfunction in
the pathogenesis of SIV infection and disease progression, we compared the
patho-genic SIVsab infection of pig-tailed macaques (PTMs) to the nonpathopatho-genic SIVsab
on November 7, 2019 by guest
http://jvi.asm.org/
but a positive correlation between their frequency and production of interleukin 10
(IL-10) can be established only in the pathogenic infection; (iii) increases in B cell
activation and apoptosis are predominantly associated with progressive SIV infection;
(iv) these changes do not appear to affect production of neutralizing and binding
antibodies or the dynamics of antibody avidity, which are similar in pathogenic and
nonpathogenic infections; (v) however, the evolution of Ab conformation ratio shows
opposite trends in nonprogressive versus progressive species; and (vi) a severe inability
to mount an Ab response against gp41 is associated with rapid disease progression in
the PTMs.
RESULTS
To assess the role of B cells in SIV pathogenesis and disease progression, we
compared and contrasted the dynamics of B cell populations from circulation, as well
as lymphoid tissues (lymph nodes [LNs]) and mucosal tissues (intestine) in SIV-infected
PTMs and AGMs.
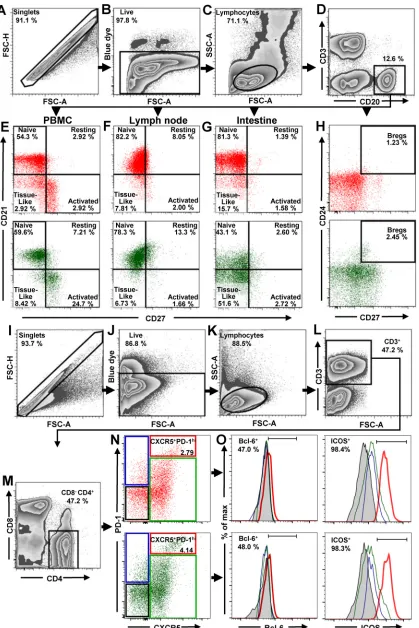
Gating strategy and assessment of total B cells, B cell subsets, and Tfh CD4
ⴙT
cell in uninfected NHPs.
All B and T cell subpopulations were first selected by using
the singlets gate to acquire the live/dead gate; then lymphocytes were gated by a
side-scatter area (SSC-A) versus forward-scatter area (FSC-A) plot (Fig. 1A to C and I to
K). B cells from circulation, LNs, and intestine were identified by gating on CD3
negCD20
⫹(Fig. 1D). Naive, resting, activated and tissue-like B cell populations were
distinguished through the CD27/CD21-based gating strategy and nomenclature
de-scribed by Titanji et al. (42): naive B cells were defined as CD27
negCD21
⫹, resting
memory B cells as CD27
⫹CD21
⫹, activated memory B cells as CD27
⫹CD21
neg, and,
finally, tissue-like memory B cells as CD27
negCD21
neg(Fig. 1E to G). With this approach,
we showed that the frequencies of naive and memory B cell subsets in uninfected PTMs
were in range of those reported for RMs (42, 44, 48–50), thus validating the accuracy of
our gating strategy.
Bregs were gated on CD20
⫹and then defined as CD24
⫹CD27
⫹(Fig. 1H). To identify
Tfh cells, CD4
⫹T lymphocytes from mesenteric and axillary LNs were sequentially gated
on CD3
⫹(Fig. 1L), CD4
⫹CD8
neg(Fig. 1M), and then PD-1
highCXCR5
⫹cells. ICOS and
Bcl-6 were used to confirm their Tfh nature (Fig. 1O). Consequently, Tfh CD4
⫹T cells
were defined as CD3
⫹CD4
⫹CXCR5
⫹PD-1
high(Fig. 1N).
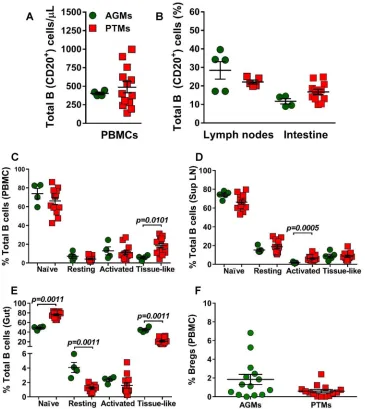
We first compared the baseline levels of total B cells and B cell subsets between
AGMs and PTMs. None of the differences observed between the two NHP species
with regard to the absolute counts of total circulating B cells, or their frequencies in
circulation (Fig. 2A) or axillary LNs and intestine (Fig. 2B), reached statistical significance.
We next compared the frequencies of the B cell subsets in blood, LNs, and intestine
between uninfected PTMs and AGMs. In both species and in all studied compartments,
naive B cells were the most prevalent subset, followed by activated memory B cells (in
circulation), resting memory B cells (in the LNs), and the tissue-like memory B cells (in
the gut). The frequencies of circulating B cell subsets were very similar in AGMs and
PTMs (Fig. 2C), the only notable exception being a higher number of tissue-like memory
B cells in PTMs (P
⫽
0.0101) (Fig. 2C). Likewise, the frequencies of B cell subsets in the
LNs were similar between the two species, the only notable difference being the higher
on November 7, 2019 by guest
http://jvi.asm.org/
FIG 1Flow cytometry strategy for identification of total B cells, B cells subsets, and Tfh cells in PBMCs, LNs, and intestine. The gating strategy to identify total B cells, B cell subsets, and Tfh cells in uninfected AGMs (green dot plots) and uninfected PTMs (red dot plots) is shown. Lymphocytes were gated on singlets, followed by gating on live cells (A to C). B cells from PBMCs, LNs, and intestine were
(Continued on next page)
on November 7, 2019 by guest
http://jvi.asm.org/
[image:4.585.45.464.70.698.2]percentage of activated memory B cells in PTMs (P
⫽
0.0005) (Fig. 2D). Significant
differences between the two species were observed in the gut, where AGMs harbored
significantly lower levels of naive B cells (P
⫽
0.0011), while the PTMs harbored
significantly lower percentages of resting (P
⫽
0.0011) and tissue-like (P
⫽
0.0011)
FIG 1Legend (Continued)
selected by gating on CD20⫹(D). CD21 and CD27 markers were used to distinguish naive (CD27negCD21⫹), resting memory (CD27⫹ CD21⫹), activated memory (CD27⫹CD21neg), and tissue-like memory (CD27negCD21neg) B cells from PBMCs (E), LNs (F), and intestine (G). CD27 and CD24 were used to identify regulatory B cells from PBMCs (H). To characterize Tfh cells in mesenteric and axillary LNs, lymphocytes were gated on singlets, followed by selection of live CD3⫹cells (I to L). CD4⫹CD8negcells were then gated (M) and analyzed based on expression of PD-1 and CXCR5. The doubly positive PD-1highCXCR5⫹population was used to identify Tfh cells (N). Expression of Bcl-6 and ICOS was assessed in CXCR5negPD-1negCD4⫹T cells (black square), CXCR5negPD-1⫹CD4⫹T cells (blue square), CXCR5⫹PD-1negCD4⫹T cells (green square), and CXCR5⫹PD-1highCD4⫹T cells (red square) (O). FSC-A, forward-scatter area; FSC-H, forward-scatter height; SSC-A, side scatter area.
FIG 2Total B cells and B cell subsets in peripheral blood, lymph nodes, and intestine in uninfected African green monkeys (AGMs) and pig-tailed macaques (PTMs). (A) Absolute counts of the total circulating B cells in peripheral blood (A) and frequency of total B cells in axillary lymph nodes and intestine (B). (C to E) Frequencies of the memory B cell subsets in peripheral blood (C), axillary lymph nodes (D), and intestine (E). (F) Frequency of regulatory B cells in peripheral blood. Values of individual animals are plotted, with the group means (long solid lines) and standard errors of means (short solid lines) shown. The Mann-Whitney U test was used to assess significance;Pvalues are shown.
on November 7, 2019 by guest
http://jvi.asm.org/
[image:5.585.40.405.73.482.2]memory B cells (Fig. 2E). We did not detect significant differences in the frequencies of
circulating Bregs between the two species prior to infection (Fig. 2F).
Loss of total B cells occurs only in the pathogenic model of SIV infection.
To
characterize the pathogenic correlates of the B cell dysfunction, we next monitored the
impact of SIVsab infection on total B cells in PTMs and AGMs (Fig. 3A to C). Very
different dynamics of total B cells were observed in the two species upon SIVsab
infection, with a significant loss of CD20
⫹cells occurring rapidly in PTMs both in blood
(8 days postinfection [dpi],
P
⬍
0.0001) (Fig. 3A) and in the LNs (4 dpi,
P
⫽
0.0079) (Fig.
3B). CD20 depletion also occurred in the gut during chronic infection of PTMs (72 dpi,
P
⫽
0.0028;
⬎
180 dpi,
P
⫽
0.0286) (Fig. 3C). Conversely, no significant decrease in the
B cell counts could be observed at any time point and in any of the studied
compart-ments in AGMs. Moreover, in AGMs, B cells increased early after infection in both the
intestine (8 dpi,
P
⫽
0.0286) and the LNs (4 dpi,
P
⫽
0.0286), where they remained
elevated throughout the follow-up (Fig. 3B). During chronic infection (after 42 dpi),
there was no significant difference between PTMs and AGMs with regard to the dynamics
of total B cells in either blood (Fig. 3A) or LNs (Fig. 3B).
Study of the B cell subset dynamics reveals specific patterns associated with
progressive SIV infection.
To assess the potential contribution of the various B cell
memory subsets to disease progression, we next compared and contrasted the
patho-genic and nonpathopatho-genic models of SIV infection with regard to the dynamics of naive,
resting, activated, and tissue-like memory B cell isolated from circulation, LNs, and gut
(Fig. 3D to O).
An association between loss of naive B cells and disease progression could be
established, supported by a consistent, significant, and rapid decrease of naive B cells
in SIV-infected PTMs, documented in all three studied compartments: blood (Fig. 3D),
LNs (Fig. 3E), and intestine (Fig. 3F). Conversely, in AGMs, the naive B cells decreased
only slightly in the LNs during chronic infection (Fig. 3E) while increasing significantly
in the gut (Fig. 3F).
Resting memory B cells were clearly depleted from circulation in SIVsab-infected
PTMs throughout the follow-up (Fig. 3G), while they were transiently increased in the
LN during acute infection (Fig. 3H) and consistently and massively increased in the gut
throughout the follow-up (Fig. 3I).
A different pattern was observed in SIV-infected AGMs, in which circulating resting
memory B cells were preserved and even increased (Fig. 3G). Resting memory B cell
showed an even more prominent and significant increase in the LNs (Fig. 3H) while
remaining virtually unchanged in the gut (Fig. 3I).
The frequencies of activated memory B cells dramatically increased in all three
compartments in SIV-infected PTMs (Fig. 3J to L), the highest increases being observed
at mucosal sites (Fig. 3L). In stark contrast, in the SIV-infected AGMs there was only a
modest trend to activated memory B cell increase, reaching significance only in the LNs
and only during acute infection (Fig. 3K).
In contrast to previous studies that failed to identify any significant change in the
levels of tissue-like memory B cells in SIVmac-infected RMs (42, 51, 52), we found a
persistent increase of this B cell subset throughout the progressive SIV infection in
PTMs in all studied compartments (Fig. 3M to O). Conversely, the levels of tissue-like
memory B cells did not significantly change in periphery in SIV-infected AGMs (Fig. 3M),
while they were decreased in the LNs (Fig. 3N) and intestine (Fig. 3O).
Increases in the IL-10-secreting Bregs are specifically associated with
patho-genic SIVsab infection.
It was recently reported that Breg frequency positively
corre-lates with markers of HIV disease progression (53–55). We therefore compared Breg
frequencies and functions between uninfected and chronically SIVsab-infected AGMs
and PTMs, and we report that Bregs significantly increased (14-fold) only in PTMs (P
⫽
0.0126) (Fig. 4A). In AGMs, only a limited increase (2.7-fold) of Bregs was observed.
Bregs can impact cell-mediated immune responses by secreting IL-10 (56–60). Since
the frequency of Bregs is very low, we measured IL-10 production by total circulating
on November 7, 2019 by guest
http://jvi.asm.org/
B cells and showed that SIVsab infection induced a significant increase of the frequency
of circulating total B cells expressing IL-10 (P
⫽
0.0451) only in PTMs, at levels that were
2.9-fold higher than in SIVsab-infected AGMs (Fig. 4B). The IL-10 expression by total B
cells positively correlated with Breg frequency (P
⫽
0.0064) (Fig. 4C), strongly
suggest-ing that the cell population expresssuggest-ing IL-10 is enriched in Bregs.
FIG 3Changes in the total B cells as well as naive versus memory B cells from circulation, lymph nodes, and intestine over the course of progressive SIVsab infection of AGMs and nonprogressive SIVsab infection of PTMs. (A to C) Fold increase of the absolute counts of total B cells in peripheral blood (A) and in the frequency of B cells from the lymph nodes (B) and intestine (C) in AGMs and PTMs. (D to O) Fold increase of naive (D to F), resting memory (G to I), activated memory (J to L), and tissue-like memory (M to O) B cells from circulation (left), lymph nodes (middle), and intestine (right) in AGMs and PTMs. Dotted lines mark the baseline levels of total B cells and of the different cell subsets. The Mann-Whitney U test was used to assess significance. Error bars correspond to standard errors of the means. Significant changes from the preinfection baseline levels are indicated as follows:*,P⬍0.05;**,P⬍0.01;***,P⬍0.001; and****,P⬍ 0.0001.
on November 7, 2019 by guest
http://jvi.asm.org/
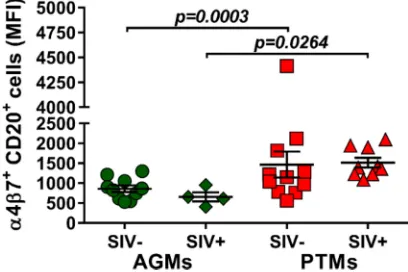
[image:7.585.44.545.67.595.2]Dynamic expression of homing markers support B cell redistribution to
mu-cosal sites during pathogenic SIV infection.
Due to the observed depletion of the
circulating B cell subsets in periphery and their increase at tissue sites, we next
investigated whether the mucosal homing marker
␣
4

7 integrin is differently
ex-pressed on circulating B cells during pathogenic and nonpathogenic SIVsab infections
FIG 4Frequencies of regulatory B cells and IL-10 production over the course of progressive SIVsab infection of AGMs and nonprogressive SIVsab infection of PTMs. (A) Frequencies of regulatory B cells in uninfected (green circles) versus SIVsab-infected (green diamonds) AGMs and uninfected (red squares) versus SIVsab-infected (red triangles) PTMs. (B) Expression of IL-10 in circulating total B cells from uninfected versus SIVsab-infected AGMs and uninfected versus SIVsab-infected PTMs. (C) Positive cor-relation between circulating total B cells expressing IL-10 and circulating Bregs in PTMs infected with SIVsab. Values of individual animals are plotted, with the group means (long solid lines) and standard errors of the means (short solid lines) shown. The Mann-Whitney U test was used to assess significance; Pvalues are shown. Relationships between total circulating B cells expressing IL-10 and of the frequency of total circulating Bregs were evaluated using the Spearman rank correlation test. The significant correlation illustrated as a solid line;Pand Spearman rank correlation (r) values are shown.
on November 7, 2019 by guest
http://jvi.asm.org/
[image:8.585.105.306.79.543.2]and the potential association between B cell homing to the gut and disease
progres-sion. While
␣
4

7 integrin expression on B cells did not increase after infection in either
species, the overall expression of
␣
4

7 integrin on B cells was significantly higher in
PTMs than in AGMs both prior to (P
⫽
0.0003) and after (P
⫽
0.0264) SIV infection (Fig.
5), suggesting that the fraction of B cells homing to the gut is higher in the model of
pathogenic infection.
Increased B cell apoptosis is specifically associated with pathogenic SIVsab
infection.
To further understand the mechanism of B cell loss during SIV infection, we
assessed the frequency of apoptotic B cells throughout the follow-up in PTMs and
AGMs.
The frequencies of circulating apoptotic B cells significantly increased in both
species during the acute stage of infection; however, B cell apoptosis was resolved in
AGMs and persisted only in chronically infected PTMs (Fig. 6A). In the LNs and intestine,
the levels of apoptotic B cells remained unchanged from the baseline during the acute
infection in both species but significantly increased during chronic infection in PTMs
(Fig. 6B and C). The dynamics of apoptotic B cells correlated with the degree of B cell
activation/proliferation (Ki-67) in both species (Fig. 7).
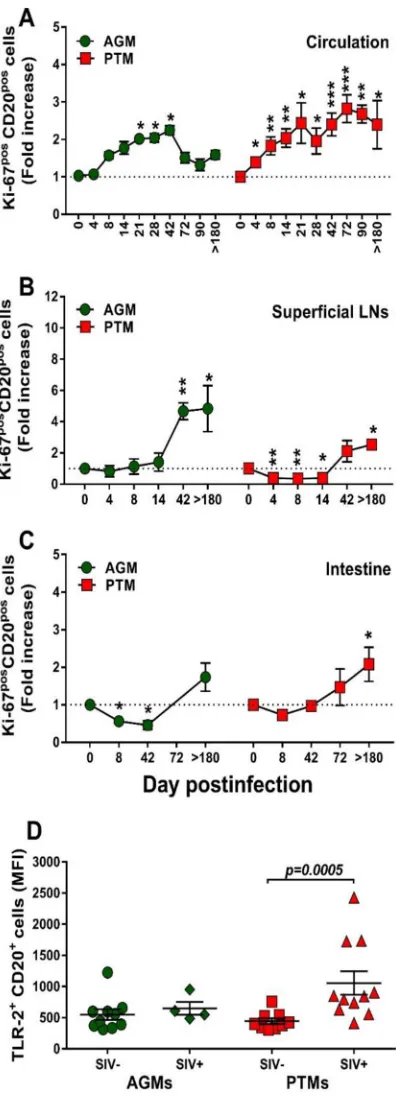
B cell activation is specifically associated with pathogenic SIV infection.
We
next interrogated whether the nonprogressive SIV infection is associated with a lack of
B cell activation that parallels the control of T cell activation in these models (61). We
first assessed and compared B cells isolated from circulation, LNs, and intestine from
AGMs and PTMs with regard their Ki-67 expression (Fig. 8). Prior to infection, levels of
Ki-67 expression on circulating B cells were similar between AGMs and PTMs (11.3% and
10.4%, respectively). Upon SIVsab infection, Ki-67 expression significantly but only
transiently increased in AGMs at the transition from the acute to chronic stage of
infection (Fig. 8A), differently from the T cell activation, which occurs very early after
infection (62). Conversely, in SIV-infected PTMs, B cell activation increased throughout
the follow-up (Fig. 8A). Ki-67 expression increased during chronic infection on the B
cells from LNs, and the levels were similar in PTMs and AGMs (Fig. 8B). In the intestine,
the frequency of activated B cells increased only in PTMs (Fig. 8C).
Pathogenic SIV infection is associated with increases in TLR-2.
B cell activation
may occur after Toll-like receptor 2 (TLR-2) stimulation (63). We therefore assessed
TLR-2 expression on B cells in SIVsab-infected PTMs and AGMs and showed that while
the baseline TLR-2 levels on total B cells were similar in both species, they significantly
increased upon infection only in PTMs (P
⫽
0.0005) (Fig. 8D).
Altogether, our results thus clearly show that chronic B cell activation is specifically
associated with progressive SIV infections.
FIG 5Mean fluorescence intensity (MFI) of␣47 integrin expression on total B cells in AGMs and PTMs. Results for uninfected (green circles) and SIVsab-infected (green diamonds) AGMs and uninfected (red squares) and SIVsab-infected (red triangles) PTMs are shown. Values of individual animals are plotted, with the group means (long solid lines) and standard errors of means (short solid lines) shown. The Mann-Whitney U test was used to assess significance;Pvalue is shown.
on November 7, 2019 by guest
http://jvi.asm.org/
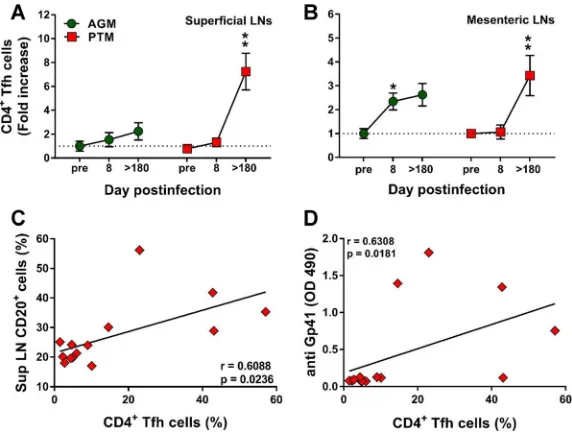
[image:9.585.103.307.74.210.2]The frequency of Tfh cells increases during chronic SIVsab infection in
patho-genic hosts.
Follicular helper CD4
⫹T (Tfh) cells are critical for generating and
main-taining the immunological memory of B cell response in the LN microenvironment (64).
We therefore compared the Tfh frequencies in the superficial (Fig. 9A) and mesenteric
(Fig. 9B) LNs from PTMs and AGMs to assess whether differences between the two
species may account for the deficiencies in B cell responses observed during the
progressive infection. The gating strategy to identify the CD4
⫹Tfh cells was based on
the coexpression of CXCR5 and PD-1. Before establishing the phenotype of the CD4
⫹Tfh cells, the doubly positive CXCR5 PD-1 CD3
⫹CD4
⫹T cells (Fig. 1N) were evaluated
for the expression of Bcl-6 and ICOS (Fig. 1O). While only a relative small fraction of the
CD3
⫹CD4
⫹CXCR5
⫹PD-1
⫹cells expressed Bcl-6 (48% in AGMs and 47%in PTMs), a
larger fraction (over 98% in both PTMs and AGMs) expressed ICOS. Increases in the Tfh
cell frequency were observed in chronically infected PTMs (Fig. 9A and B), while in the
AGMs Tfh cells increased only transiently during the acute infection and only in the
mesenteric LNs (Fig. 9B). CD4
⫹Tfh cell increases positively correlated with the
expan-sion of the total B cell pool only in the pathogenic infections (P
⫽
0.0236) (Fig. 9C).
Furthermore, Tfh cell increases also positively correlated (P
⫽
0.0181) with plasma
anti-gp41 antibody titers in PTMs (Fig. 9D).
FIG 6Changes in the levels of apoptotic B cells over the course of progressive SIVsab infection of AGMs and nonprogressive SIVsab infection of PTMs. Fold increases of the apoptotic cells from the PBMCs (A), lymph nodes (B), and intestine (C) are shown. AGMs are shown by green circles and PTMs by red squares. Dotted lines mark the baseline levels of the different cell subsets. The Mann-Whitney U test was used to assess significance. Error bars correspond to standard errors of the means. Significant changes from the preinfection baseline levels are indicated as follows:*,P⬍0.05;**,P⬍0.01; and***,P⬍0.001. AnnV, annexin V.
on November 7, 2019 by guest
http://jvi.asm.org/
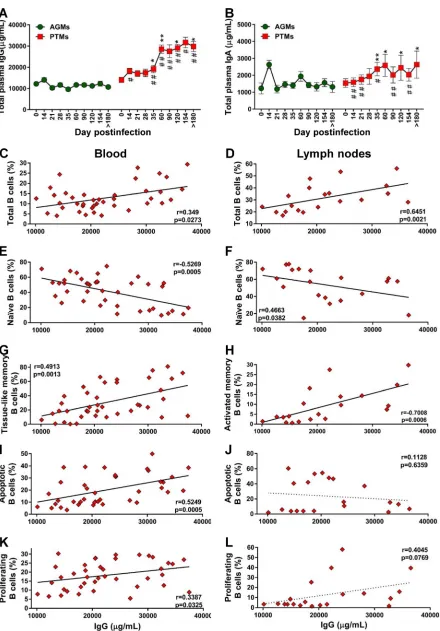
[image:10.585.88.326.73.429.2]Pathogenic species secrete significantly larger amounts of total IgG and IgA
than nonpathogenic species.
To assess whether the loss of total B cells in progressive
species significantly impacts the overall antibody responses, we quantified the total IgG
and IgA in PTMs and AGMs. Surprisingly, PTMs had higher levels of IgG and IgA than
AGMs (Fig. 10A and B), in spite of the B cell loss identified in PTMs. A moderate increase
of serum IgG and IgA occurred in the early phase of viral infection in both species, yet
this increase reached significance only in PTMs, in which the levels of both IgG and IgA
levels remained significantly increased throughout the chronic infection, from 35 dpi
on. The levels of antibodies were significantly higher in PTMs than in AGMs starting
from 21 dpi and 14 dpi for IgG (Fig. 10A) and IgA (Fig. 10B), respectively. We next
analyzed the relationship between total antibodies and the frequency of total B cells
and subsets, as well as the fraction of apoptotic and proliferating total B cells in blood
and LNs in both species. In PTMs, the levels of IgG were correlated to those of total B
cells from circulation (Fig. 10C) and LNs (Fig. 10D). To establish which memory B cell
subset contributes most to the production of serum Abs in PTMs, we correlated the
levels of total IgG and IgA with the levels of the B cell memory subsets and found a
FIG 7Correlations between proliferation and apoptosis over the course of progressive SIVsab infection of AGMs and nonprogressive SIVsab infection of PTMs. Positive correlations between proliferation and apoptosis were observed in both PTMs (red diamonds) and AGMs (green hexagons) in the blood (A and B), lymph nodes (C and D), and intestine (E and F). Relationships between proliferation and apoptosis were assessed using the Spearman rank correlation test. Significant correlations are represented by solid lines;Pand Spearman rank correlation (r) values are shown.
on November 7, 2019 by guest
http://jvi.asm.org/
[image:11.585.72.341.73.465.2]FIG 8Changes in Ki-67 expression on total B cells over the course of progressive SIVsab infection of AGMs and nonprogressive SIVsab infection of PTMs. (A to C) Fold increase of Ki-67 expression in PBMCs (A), lymph nodes (B), and intestine (C). Dotted lines mark the baseline levels of the different cell subsets. The Mann-Whitney U test was used to assess significance. Error bars correspond to standard errors of the means. Significant changes from the preinfection baseline levels are indicated as follows:*,P⬍0.05;**, P⬍0.01; and***,P⬍0.001. (D) MFI of TLR-2 expression on total B cells over the course of progressive SIVsab infection of AGMs and nonprogressive SIVsab infection of PTMs. AGMs are shown by green circles and PTMs by red squares. Results for uninfected (green circles) versus SIVsab-infected AGMs (green diamonds) and uninfected (red squares) versus SIVsab-infected PTMs (red triangles) are shown. Values of individual animals are plotted, with the group means (long solid lines) and standard errors of means (short solid lines) shown. The Mann-Whitney U test was used to assess significance;Pvalues are shown.
on November 7, 2019 by guest
http://jvi.asm.org/
[image:12.585.108.306.70.618.2]negative correlation between naive B cells and IgG in both blood and LNs (Fig. 10E and
F). Serum IgG negatively correlated with activated circulating memory B cells (data not
shown) and positively correlated with the exhausted tissue-like memory B cells (Fig.
10G). In the LNs, serum IgG levels also positively correlated with activated memory B
cells (Fig. 10H).
Finally, the levels of IgG correlated to those of apoptotic (Fig. 10I) and proliferating
(Fig. 10K) B cells from circulation but not from the LNs (Fig. 10J and L).
Lack of anti-gp41 antibodies in rapid progressor PTMs.
Using an SIVsab-specific
enzyme-linked immunosorbent assay (ELISA) (65), we monitored binding antibodies to
gp41 immunodominant region and found that PTMs developed significantly higher
titers of anti-gp41 than AGMs (Fig. 11A). Furthermore, PTMs also developed
signifi-cantly higher endpoint titers to whole Env protein than AGMs (Fig. 11C). We were not
able to detect anti-gp41 antibodies in all the PTMs. Only 43% of rapid progressors (3/7)
mounted a specific anti-gp41 response, as opposed to all of normal progressors (6/6)
(Fig. 11B).
The neutralizing antibody titers did not differ between pathogenic and
non-pathogenic SIVsab infections.
Different from the dynamics of binding antibodies,
PTMs and AGMs mounted similar levels of neutralizing antibodies during chronic
SIVsab infection (Fig. 11D), which positively correlated (P
⫽
0.0311) with the absolute
total B cell counts only in AGMs (Fig. 11G). In PTMs, this trend did not reach significance
(Fig. 11H).
Pathogenic and nonpathogenic hosts have opposite conformational epitope
specificities.
Finally, to understand the impact of B cell dysfunction on the humoral
immune responses characteristic to pathogenic and nonpathogenic infections, we
analyzed two critical aspects of the maturation of humoral immune responses—
FIG 9Changes in the levels of follicular helper CD4⫹T (Tfh) cells in lymph nodes over the course of progressive SIVsab infection of AGMs and nonprogressive SIVsab infection of PTMs. (A and B) Changes in the Tfh cell frequency in axillary (A) and mesenteric (B) lymph nodes in AGMs and PTMs. Dotted lines mark the baseline levels of the different cell subsets. The Mann-Whitney U test was used to assess significance. Error bars correspond to standard errors of the means. Significant changes from the preinfection baseline levels are indicated as follows: *, P⬍0.05;**,P⬍ 0.01; and***, P⬍0.001. Significant differences between pathogenic and nonpathogenic species at same time point are indicated as follows: #,P⬍0.05; ##,P⬍0.01; and ###,P⬍0.001. (C) Significant correlation between the frequency of total B cells and that of CD4⫹Tfh cells in PTMs. (D) Significant positive correlation between frequency of CD4⫹Tfh cells and the plasma levels of anti-gp41 antibodies in PTMs. Relationships between the frequencies of B cells and anti-gp-41 antibodies versus the frequency of CD4⫹Tfh cells in the axillary lymph nodes were evaluated using the Spearman rank correlation test. Significant correlations are
represented by solid lines;Pand Spearman rank correlation (r) value are shown.
on November 7, 2019 by guest
http://jvi.asm.org/
[image:13.585.62.348.71.287.2]FIG 10Assessment of the relationship between B cell dysfunction and overall humoral immune response over the course of progressive SIVsab infection of AGMs and nonprogressive SIVsab infection of PTMs. (A and B) Total levels of IgG (A) and total IgA (B) in AGMs and PTMs. Dotted lines mark the baseline levels of the different cell subsets. The Mann-Whitney U test was used to assess significance. Error bars
(Continued on next page)
on November 7, 2019 by guest
http://jvi.asm.org/
[image:14.585.45.485.66.697.2]DISCUSSION
There is a renewed interest in the role of B cells in the pathogenesis of HIV infection,
fueled by studies showing that humoral immune responses may be central to an
effective preventive and therapeutic HIV vaccine and for cure research (66–71). HIV type
1 (HIV-1) infection is associated with profound alterations of the B cell compartment
(72) which may play a pivotal role in rapid disease progression (41, 44), as depletion
of circulating B cells and low Ab responses are associated with progression to AIDS
(73, 74).
To assess the contribution of B cell dysfunction to HIV/SIV disease progression, we
compared and contrasted pathogenic and nonpathogenic models with regard to
the dynamics of B cells and memory subsets, i.e., their levels of immune activation,
apoptosis, exhaustion, and homing to the intestine. This allowed us to define specific
B cell-related changes which might impact disease progression in the pathogenic SIV
infection.
While the baseline levels of total B cells were similar in the two species,
species-specific differences could be identified with regard to the memory B cell subsets: higher
levels of tissue-like memory B cells and activated memory B cells in PTMs, lower levels
of mucosal naive B cells in AGMs, and lower levels of mucosal resting and tissue-like
memory B cells in PTMs. Thus, the frequencies of B cell subsets are significantly different
between the pathogenic and the nonpathogenic models in the tissue compartments
critical for virus replication, CD4
⫹T cell depletion, and persistent immune activation
and inflammation. However, the cross-sectional analysis did not permit any conclusion
on whether such differences are critical for SIV pathogenesis or whether they just
represent innate differences between the two species. Therefore, we next compared
the dynamics of the B cells and subsets during the course of SIV infection in the two
species and report that B cell loss is specifically associated with the pathogenic SIV
infection. Conversely, in the nonpathogenic SIV infection, B cells are maintained at
virtually the baseline levels in circulation while rapidly increasing in both the LNs and
intestine. Our data thus suggest that early B cell loss during pathogenic infection may
contribute to disease progression, while their involvement at tissue sites may be
beneficial in the nonpathogenic SIV infection.
Loss of total memory B cells (2–4), imbalances in B cell subsets (42, 45, 75–77), and
tissue-specific impairment of total B cell trafficking and functions, together with a
FIG 10Legend (Continued)
correspond to standard errors of the means. Significant changes from the preinfection baseline levels are indicated as follows:*,P⬍0.05; **,P⬍0.01; and***,P⬍0.001. Significant differences between pathogenic and nonpathogenic species at same time point are indicated as follows: #,P⬍0.05; ##,P⬍0.01; and ###,P⬍0.001. Significant positive correlations were established during the pathogenic SIV infection of PTMs between the levels of total IgG and total (C) and tissue-like memory (G) B cells from circulation (C) and total (D) and activated (H) B cells from the lymph nodes (D). Negative correlations between were established during the pathogenic SIV infection of PTMs between the levels of total IgG and the naive B cells from the peripheral blood (E) and lymph nodes (F). Significant positive correlation between the levels of total IgG and the levels of apoptotic B cells (I) and proliferating B cells (K) from peripheral blood and only trends for a negative correlation with the levels of apoptotic B cells (J) and for a positive correlation with the levels of proliferating B cells (L) from the lymph nodes were established. Relationships between the levels of total B cells and subsets, apoptotic and proliferating B cells from blood and lymph nodes, and total IgG were assessed using the Spearman rank correlation test. Significant correlations and positive or negative trends are illustrated by solid and dotted lines, respectively;Pand Spearman rank correlation (r) value are shown.
on November 7, 2019 by guest
http://jvi.asm.org/
FIG 11Antibody responses and antibody maturation profiles over the course of progressive SIVsab infection of AGMs and nonprogressive SIVsab infection of PTMs. (A) Anti-gp41 titers in AGMs and PTMs; (B) anti-gp41 antibody titers in normal progressor versus rapid progressor PTMs; (C) mean of endpoint titers of the highest reciprocal dilution; (D) neutralization antibodies titers; (E) mean avidity index; (F) mean conformation ratio. The Mann-Whitney U test was used to determine significance. Error bars correspond to standard errors of means. Significant differences compared to baseline values before infection are indicated as follows:*,P⬍0.05;**,P⬍0.01;***,P⬍0.001; and****,P⬍0.0001. Significant differences between AGMs and PTMs for the same time point are indicated as follows: #,P⬍0.05; ##,P⬍0.01; ###,P⬍0.001; and ####,P⬍0.0001. (G) Significant positive correlation between total peripheral B cells and production of neutralizing antibodies in AGMs (green circles). (H) Lack of correlation between the levels of total B cells and production of neutralizing antibodies in PTMs (red squares). Relationships between the levels of neutralizing antibodies and absolute counts of the total B cells were assessed using the Spearman rank correlation test. Significant correlations are represented by solid line;Pand Spearman rank correlation (r) values are shown.
on November 7, 2019 by guest
http://jvi.asm.org/
[image:16.585.47.498.66.627.2]redistributed to the gut during the pathogenic SIV infection of PTMs, which may
explain their depletion from circulation. The different dynamics of resting memory B
cells and their different trafficking patterns between pathogenic and nonpathogenic
infections are other key findings of our study. The increase of the activated B cells in
PTMs and in all studied compartments may contribute to chronic immune activation,
the main driver of progression to AIDS (42, 51, 52, 81, 82). In contrast to previous studies
with SIVmac-infected RMs that failed to identify any significant change of the tissue-like
memory B cells associated with SIV infection (42, 51, 52), but in agreement with studies
showing that they accumulate in circulation in HIV-infected patients (83), we found that
this B cell subset is increased in circulation in SIVsab-infected PTMs. The difference with
previous macaque studies may rely on the use in this study of the highly susceptible
PTMs and a tier 2 virus, while studies with RMs employed the highly
neutralization-resistant SIVmac.
Finally, we report that while circulating B cells are virtually restored to preinfection
levels during chronic pathogenic SIV infection, restoration is mainly due to an
expan-sion of the exhausted, virus-specific B cells, i.e., activated memory cells and tissue-like
memory B cells (83). Their dominance during chronic HIV/SIV infection may contribute
to the inefficiency of the antibody responses (72, 81).
These numerous differences between the pathogenic and nonpathogenic infections
with regard to dynamics of the memory B cell subsets point to their role in the
pathogenesis of HIV/SIV infections, suggesting that monitoring B cells may be a reliable
approach for assessing disease progression.
We also report that changes in Breg frequency, which positively correlate with
markers of HIV disease progression, such as the viral loads (VLs) and chronic immune
activation, are specifically associated with the pathogenic SIV infection. Breg expansion
might contribute to suppression of T cell effector functions either via the IL-10 and
PD-L1 pathway or by attenuated proliferation of anti-HIV CD8
⫹T cell effector subsets (53).
Breg secretion of IL-10 (56–60) may also contribute to viral persistence (84) through
suppression of T cell effector function (56, 57), and in our study, increased frequency of
circulating B cells expressing IL-10 occurred only in the pathogenic infection. Therefore,
our results are in agreement with previous studies (54, 55) reporting Breg involvement
in disease progression. The precise mechanism through which Bregs impact SIV
patho-genesis remains, however, unclear, as the immune responses are of similar magnitudes
in the pathogenic and nonpathogenic SIV infections (8).
The mechanisms of B cell depletion during HIV/SIV infection are not completely
understood; their reduction in circulation and increase in tissues of the PTMs suggest
B cell mobilization to lymphoid sites during the pathogenic infection. We compared the
changes in homing markers on the B cell subsets between pathogenic and
nonpatho-genic SIV infections, particularly the expression of the gut-homing marker
␣
4

7
integ-rin (85, 86), and we confirm that B cell loss from circulation may be due to their
redistribution to the gut.
Circulating B cells may be also lost during SIV infection through cell death. As they
cannot be infected by HIV/SIV and depleted through HIV/SIV killing, B cell reduced
survival during infection likely occurs through apoptosis (45, 87). In our study, increased
levels of apoptotic B cells in circulation and LNs and at the mucosal sites were specifically
on November 7, 2019 by guest
http://jvi.asm.org/
associated with the pathogenic SIV infection and correlated with B cell activation,
suggest-ing that apoptosis is likely involved in B cell loss.
Chronic immune activation is the main factor driving the progression of HIV
infection to AIDS (1, 88). The ability of natural hosts to maintain low levels of T cell and
myeloid dendritic cell (mDC) immune activation contributes to their resistance to SIV
disease progression (2, 18, 89). Therefore, we investigated whether the natural hosts of
SIV are also able to control B cell activation. We report that B cell activation occurred
only at the transition from acute to chronic stage of infection (likely when the AGMs
mounted the humoral immune responses), in stark contrast to the very early T cell
activation observed in the PTMs (23). During the chronic SIV infection, the patterns of
B cell activation were similar to those of the T cells, being resolved in the natural host
while remaining increased throughout the follow-up in all the tissue compartments
without a positive impact on the clinical course of SIV infection in the pathogenic
model. Therefore, our results suggest that B cell activation contributes to the persistent
inflammation that drives progression to AIDS (90).
To understand the mechanism of SIV-associated B cell activation, we assessed TLR-2
expression on B cells. TLR signaling plays an important role in microbial translocation
(MT) (30, 91). Upon TLR-2, TLR-7, and TLR-9 activation, proliferative B cell responses can
be detected in the follicular and marginal zone in the LNs (14, 92). B cell ligation of TLRs
downregulates integrin receptor expression, leading to their redistribution from the
marginal zone of spleen to circulation, LNs, and spleen follicles (93) and potent priming
for Ig secretion (14, 36, 92, 94). We report that upon SIV infection, the levels of TLR-2
significantly increased only in the pathogenic model. This is not surprising, as TLR-2
binding to a wide range of microbial products translocated from the gut (91) may
contribute to B cell activation (30, 95). Conversely, in chronically infected AGMs, the
absence of microbial translocation may be the reason for the lack of TLR-2
overexpres-sion. We therefore concluded that the mucosal damage specific to SIV/HIV infection
contributes to B cell activation in a similar manner to that by which it drives T cell
activation.
The generation and maintenance of memory of B cell responses in the LN
microen-vironment are governed by the Tfh cells (64, 96): Tfh cell accumulation is accompanied
by B cell expansion and hypergammaglobulinemia in both HIV (97) and SIV (51, 98)
infections. Tfh cells significantly expanded in the LNs in response to SIV infection in
both progressive and nonprogressive hosts. The higher Tfh cell increase observed in
PTMs during the chronic SIV infection may be a cause of abnormal Ab production in SIV
infection, in agreement with recent studies with both NHPs (51, 98) and HIV-infected
subjects (96, 97).
Finally, to establish whether B cell dysfunction impacts humoral immunity, we
performed a thorough characterization of the humoral immune responses and their
maturation. We first interrogated whether the loss of total B cells in progressive species
impacts the overall humoral immunity. Surprisingly, we found that in spite of the
observed B cell dysfunction, PTMs secrete significantly larger amounts of total IgG and
IgA than AGMs. The study of relationships between total antibodies and the
frequen-cies of total, apoptotic, and proliferating total B cells identified correlations only in
PTMs. Furthermore, naive B cells were negatively correlated with the total IgG, probably
due to the increased apoptosis and differentiation in specific anti-SIV memory B cell
subsets. The total IgG levels were also negatively correlated with activated circulating
memory B cells and positively correlated with the exhausted tissue-like memory B cells.
Therefore, our results suggest that the majority of circulating antibodies produced
during SIV infection in PTMs are secreted by activated, apoptotic, and exhausted B cells.
The anti-SIVsab antibody titers were higher in PTMs than in AGMs, probably as a
result of the higher antigenic stimulation. Surprisingly, more than half of the rapid
progressor PTMs did not have detectable anti-gp41 antibodies, as a result of a defective
humoral immune response which could contribute either to the rapid progression or to
the higher antigenic burden and antibody complexation masking the humoral immune
responses (99).
on November 7, 2019 by guest
http://jvi.asm.org/
between AGMs and PTMs, yet the AGMs showed a delayed maturation compared to
that in PTMs, suggesting that an earlier antibody maturation is not sufficient to improve
clinical outcome. On the other hand, the conformational epitope recognition evolved
from low to high conformation ratios in AGMs, similar to the pattern observed in
HIV-infected patients, and from high to low conformation ratios in PTMs, following a
pattern typically expected of SIV-infected NHPs (105). Taken together, our results show
that in AGMs, unlike the pathogenic SIV infections, epitope recognition starts out at a
higher level of linear epitopes, with increasing recognition of conformational epitopes
over time. The patterns of early antibody recognition of more conformational epitopes
and increasing recognition of linear epitopes over time characteristic to pathogenic SIV
infection may thus be one of the factors behind the high susceptibility to disease
progression.
In conclusion, by comparing and contrasting the B cell dynamics in blood and
tissues in NHP models of progressive and nonprogressive SIV infections, we showed
that B cell dysfunction defined by loss of total and memory B cells, increases in the
circulating levels of tissue-like B cells and Bregs as well as increases of the B cell
recruitment to the gut, B cell activation, and apoptosis is specifically associated with the
pathogenic SIV infection, being absent during the nonpathogenic SIV infection. The
observed changes in the B cell population were not correlated with production of
neutralizing antibodies, the levels of which were similar in the two models. Yet rapid
progressive infection is associated with a severe impairment in SIV-specific antibody
production. While our study did not identify major differences in avidity and maturation
between the pathogenic and nonpathogenic SIV infection, we found a major difference
in conformational epitope recognition, with the nonpathogenic infection being
char-acterized by an evolution from low to high conformations. These differences should be
considered in designing immunization strategies aimed at preventing HIV disease
progression.
MATERIALS AND METHODS
Ethics statement.All the NHPs included in this study were housed and maintained at the RIDC Park animal facility of the University of Pittsburgh according to the standards of the Association for Assess-ment and Accreditation of Laboratory Animal Care (AAALAC) International. ExperiAssess-ments presented here were approved by the University of Pittsburgh Institutional Animal Care and Use Committee (IACUC), the studies being covered by the IACUC protocols 0907039/12080831 (Animal Model for SIV Infection Control, approved in 2009 and renewed in 2012) and 0911844/12121250 (Pathogenesis of SIV in African Green Monkeys, approved in 2009 and renewed in 2012).
The animals were fed and housed according to regulations set forth by the Animal Welfare Act and theGuide for the Care and Use of Laboratory Animals(106, 107). All the animals included in this study were socially housed (paired) indoor in stainless steel cages, had a 12-h/12-h light/dark cycle, and were fed twice daily; water was providedad libitum. The animals were given various toys and feeding enrichment. In addition, the animals were observed twice daily and any signs of disease or discomfort were reported to the veterinary staff for evaluation. For sample collection, animals were anesthetized with 10 mg/kg (of body weight) of ketamine hydrochloride (Park-Davis, Morris Plains, NJ) or 0.7 mg/kg of tiletamine hydrochloride and zolazepan (Telazol; Fort Dodge Animal Health, Fort Dodge, IA) injected intramuscu-larly. At the completion of the study or when they reached the AIDS-defining clinical endpoints, the animals were sacrificed by intravenous administration of barbiturates prior to the onset of any clinical signs of disease.
Animals and infections.Our study included a total of 40 AGMs and 29 PTMs. Different animals were used for different experiments carried out in this study. The AGMs were intravenously infected with
on November 7, 2019 by guest
http://jvi.asm.org/
plasma equivalent to 300 50% tissue culture infectious doses (TCID50) of SIVsab92018 (108). The PTMs received intravenously plasma equivalent to 300 TCID50of SIVsabBH66 (109).
Four AGMs and 13 PTMs were used in a prospective study to assess (i) the dynamics of total and memory B cell subsets, B cell apoptosis, and immune activation status in blood, lymph nodes (LNs), and intestine; (ii) the dynamics of CD4⫹Tfh cells; and (iii) the dynamics of binding anti-gp41 and neutralizing antibodies (NAbs). The follow-up of NHPs in this group ranged between 1 week preinfection and up to 300 days postinfection (dpi) or until progression to AIDS. Animals were closely clinically monitored throughout the follow-up. Plasma VLs were quantified by real time-PCR as previously described (25, 108).
Additionally, to better support the findings of the prospective study, we have included samples collected at key time points of SIVsab infection from historical studies. Thus, 14 AGMs and 20 PTMs were used to monitor B regulatory cells (Bregs), B cell expression of IL-10, and TLR-2, and homing to the intestine.
Sampling.For the prospective study, blood, axillary/mesenteric LNs and intestinal biopsy specimens were collected as described previously (18, 110), prior to and after infection. The sampling schedule was as follows: whole blood was collected prior to infection (preinfection), twice per week during the first 2 weeks after SIVsab infection (at 4, 8, 10, and 14 dpi), weekly for the next 2 weeks (21 and 28 dpi), bimonthly for the next 2 months (42, 72, and 90 dpi), and either at the completion of the follow-up (300 dpi) or at the AIDS stage. Axillary LNs were collected prior to infection and at 4, 8, 14, 42, and 180 dpi. Additional mesenteric LNs were collected prior to infection and at 8 and 180 dpi. Intestinal biopsy specimens were collected prior to infection and at 8, 42, and 72 dpi. Intestinal resections (5 to 10 cm) were surgically performed prior to infection, during acute infection (8 dpi), and during chronic infection (180 dpi), as previously described (18, 25, 110). Additional intestinal samples were collected at the necropsy. Peripheral blood mononuclear cells (PBMCs) and mononuclear cells from the LNs and intestine were isolated as described previously (18, 36).
Antibodies and flow cytometry.Cells isolated from blood, axillary LNs, and intestine were immu-nophenotyped by flow cytometry. Briefly, 1⫻106to 2⫻106cells were stained with viability dye (blue dye; Life Technologies) and incubated for 15 min in the dark at room temperature. The cells were then washed with phosphate-buffered saline (PBS) and stained for 30 min in the dark at room temperature using a combination of antibodies (Table 1) appropriate for the identification of different B cell subsets and a combination of isotype and fluorescence-minus-one controls. Stained cells were washed in 1⫻PBS, fixed with 2% paraformaldehyde solution (PFA), and stored at 4°C prior to acquisition. A minimum of 100,000 CD20 or 250,000 live CD3 cells were acquired with FACSDiva software v.8.0. Acquired cells were analyzed using FlowJo 7.6.5 software.
Assessment of apoptosis and proliferation status of the B cells and subsets.Viable cells stained as described above were washed with 1⫻PBS and incubated with 1⫻annexin V buffer binding for 20 min or fixed with 2% PFA. Cells were then washed once with PBS and stained with anti-annexin V-fluorescein isothiocyanate (FITC) monoclonal antibody (MAb) or permeabilized with a solution containing 0.1% saponin and incubated for 30 min at room temperature in the dark. Permeabilized cells were then stained with an anti-Ki-67-FITC MAb (clone B56) (BD Pharmingen) for intracellular detection of Ki-67. Cells were then washed with 1⫻PBS, fixed with 2% PFA, and stored at 4°C prior to the acquisition. B cells (CD20pos) expressing annexin V or Ki-67 were defined as apoptotic and proliferating B cells, respectively.
[image:20.585.41.371.83.260.2]Tfh CD4ⴙT cell staining.To assess the frequency of Tfh CD4⫹T cells, 2⫻106cells from axillary and mesenteric LNs were stained with an amine-reactive fixable dead-cell dye (Invitrogen, Grand Island, NY), as described above, washed once with PBS plus 2% newborn calf serum (NCS; Atlanta Biological Inc., TABLE 1Antibodies used for flow cytometry assaya
Marker Clone Fluorochrome Company
CD3 SP34-2 Pacific Blue BD Pharmingen
CD4 L200 APC BD Pharmingen
CD8 3B5 PE-Texas Red Invitrogen
CD20 2H7 APC-H7 BD Pharmingen
CD21 B-ly4 PE-Cy5 BD Pharmingen
CD24 ML5 PerCP-Cy5.5 BD Bioscience
CD27 M-T271 APC BD Pharmingen
CXCR5 (CD185) MU5UBEE PE-Cy7 eBioscience
ICOS (CD278) C398.4A PerCP5.5 BioLegend
PD-1 (CD279 eBioJ (J105) PE eBioscience
Annexin V NA FITC BD Pharmingen
Bcl-6 K112-91 Alexa Fluor 488 BD Pharmingen
IL-10 JES3-9D7 Alexa Fluor 647 eBioscience
Ki-67 B56 FITC BD Pharmingen
PD-L1 M1H1 PE-Cy7 eBioscience
TLR-2 T2.5 FITC eBioscience
Viability dye NA Blue fluorescent reactive dye Life Technologies
aAPC, allophycocyanin; PE, phycoerythrin; PerCP, peridinin-chlorophyll protein; FITC, fluorescein
isothiocyanate; NA, not applicable.
on November 7, 2019 by guest
http://jvi.asm.org/
previously described (65). Absorbance values (optical density [OD]) were read at 492 nm, and the cutoff to discriminate negative values was arbitrarily established at an OD of 0.2.
Serum NAb.SIVsab neutralizing Abs (NAbs) were measured using a SIVsab92018-specific neutral-ization assay, as previously described (5). Briefly, an SIVsab-specific molecularly cloned Env-pseudotyped virus containing full-length gp160 of SIVsab92018 (clone 28) was prepared as described previously (111). Neutralization titers were then measured as 50% reductions in luciferase reporter gene expression in TZM-bl cells, as reported previously (5).
Total IgG and IgA in plasma.Plasma samples were tested for total IgG and total IgA by ELISA using commercial kits for IgG and IgA (Life Diagnostic, Inc., PA), per the manufacturer’s instructions. The results, expressed as micrograms per milliliter of immunoglobulin, were extrapolated from a standard curve.
Characterization of SIV envelope glycoprotein-specific antibodies by ConA ELISA.The reactivity of serum samples to SIVsab native envelope proteins was determined in a series of quantitative and qualitative concanavalin A (ConA) ELISAs, as described previously (112). Briefly, SIVsab92018 virions which had been Triton disrupted as described previously (113) were captured for 1 h at room temperature onto Immulon 2HB microtiter plates (Fisher Scientific, Pittsburgh, PA) coated with ConA (Sigma, St. Louis, MO). Following ConA capture, plates were washed with PBS and blocked by the addition of 5% dried milk in PBS (Blotto) for 1 h at room temperature. Serum samples were serially diluted 2⫻ in Blotto and incubated for 1 h at room temperature. Following extensive washing, peroxidase-conjugated anti-monkey IgG, whole molecule (Sigma), was diluted in Blotto, added to each well, and incubated for 1 h at room temperature. After a final washing, plates were incubated with TM Blue substrate (Sigma) for 20 min at room temperature, color was developed by the addition of 1 N sulfuric acid, and plates were read at 450 nm using an automated plate reader. Endpoint titers were determined as the last 2⫻dilution that yielded an OD twice that of normal monkey serum at the lowest dilution (1:50) or an OD of 0.100, whichever was greater. Serum dilutions were selected in the linear range of the endpoint titer curve for qualitative assays of Ab avidity index and conformation ratio. Ab avidity was determined by measuring the stability of the Ag-Ab complexes to 8 M urea and is expressed as follows: percent Ab avidity index⫽(OD of wells washed with 8 M urea/OD of wells washed with PBS)⫻ 100. Serum Abs with avidity index values of ⬍30% are designated low-avidity Abs, those with values between 30 and 50% are designated moderate-avidity Abs, and those with values of⬎50% are considered high-avidity Abs. Conformational dependence, or the specificity for conformational viral envelope glycoprotein determinants compared to that of linear envelope determinants, was determined by measuring the reactivity to native versus dena-tured envelope proteins, where a ratio of⬎1 reflects predominant reactivity with native envelope proteins and a ratio of⬍1 reflects predominant reactivity with denatured envelope proteins. The results represent the averages from at least three independent experiments.
Statistical analyses.Data were expressed as averages⫾standard errors of the means (SEM). We used the Mann-Whitney U test to assess significant changes during the follow-up. Results of statistical analyses were interpreted as significant if thePvalue wasⱕ0.05. Linear-relationship analyses between Breg-producing IL-10 versus percentage of Breg, between log NAb titers versus absolute counts of total B cells, and fold increase of total B cell proliferation versus fold increase of total B cell apoptosis were assessed by the Spearman rank correlation coefficient. All statistical analyses and graphs were prepared with GraphPad Prism software v.6.02 (GraphPad Software Inc., San Diego, CA).
ACKNOWLEDGMENTS
We thank Susan Moir, Elisabeth Falwell, and Adam Kleinman for helpful discussions
and critical readings of the manuscript.
This work was supported by the National Institutes of Health/National Center for
Research Resources/National Heart, Lung and Blood Institute/National Institute of
Allergy and Infectious Diseases grants R01 RR025781 (C.A. and I.P.), RO1 HL117715 (I.P.),
R01 AI119346 (C.A.), and R01 HL123096 (I.P.).
The funders had no role in study design, data collection and analysis, decision to
publish, or preparation of the manuscript.
on November 7, 2019 by guest
http://jvi.asm.org/
REFERENCES
1. Pandrea I, Apetrei C. 2010. Where the wild things are: pathogenesis of SIV infection in African nonhuman primate hosts. Curr HIV/AIDS Rep 7:28 –36.https://doi.org/10.1007/s11904-009-0034-8.
2. Pandrea I, Sodora DL, Silvestri G, Apetrei C. 2008. Into the wild: simian immunodeficiency virus (SIV) infection in natural hosts. Trends Immu-nol 29:419 – 428.https://doi.org/10.1016/j.it.2008.05.004.
3. VandeWoude S, Apetrei C. 2006. Going wild: lessons from naturally occurring T-lymphotropic lentiviruses. Clin Microbiol Rev 19:728 –762.
https://doi.org/10.1128/CMR.00009-06.
4. Silvestri G, Paiardini M, Pandrea I, Lederman MM, Sodora DL. 2007. Understanding the benign nature of SIV infection in natural hosts. J Clin Invest 117:3148 –3154.https://doi.org/10.1172/JCI33034.
5. Gaufin T, Pattison M, Gautam R, Stoulig C, Dufour J, MacFarland J, Mandell D, Tatum C, Marx MH, Ribeiro RM, Montefiori D, Apetrei C, Pandrea I. 2009. Effect of B-cell depletion on viral replication and clinical outcome of simian immunodeficiency virus infection in a nat-ural host. J Virol 83:10347–10357.https://doi.org/10.1128/JVI.00880-09. 6. Gaufin T, Ribeiro RM, Gautam R, Dufour J, Mandell D, Apetrei C, Pandrea I. 2010. Experimental depletion of CD8⫹cells in acutely SIVagm-infected African green monkeys results in increased viral replication. Retrovirology 7:42.https://doi.org/10.1186/1742-4690-7-42.
7. Schmitz JE, Johnson RP, McClure HM, Manson KH, Wyand MS, Kuroda MJ, Lifton MA, Khunkhun RS, McEvers KJ, Gillis J, Piatak M, Lifson JD, Grosschupff G, Racz P, Tenner-Racz K, Rieber EP, Kuus-Reichel K, Gelman RS, Letvin NL, Montefiori DC, Ruprecht RM, Desrosiers RC, Reimann KA. 2005. Effect of CD8⫹lymphocyte depletion on virus containment after simian immunodeficiency virus SIVmac251 challenge of live attenuated SIVmac239delta3-vaccinated rhesus macaques. J Virol 79:8131– 8141.
https://doi.org/10.1128/JVI.79.13.8131-8141.2005.
8. Dunham R, Pagliardini P, Gordon S, Sumpter B, Engram J, Moanna A, Paiardini M, Mandl JN, Lawson B, Garg S, McClure HM, Xu YX, Ibegbu C, Easley K, Katz N, Pandrea I, Apetrei C, Sodora DL, Staprans SI, Feinberg MB, Silvestri G. 2006. The AIDS resistance of naturally SIV-infected sooty mangabeys is independent of cellular immunity to the virus. Blood 108:209 –217.https://doi.org/10.1182/blood-2005-12-4897.
9. Wang Z, Metcalf B, Ribeiro RM, McClure H, Kaur A. 2006. Th-1-type cytotoxic CD8⫹T-lymphocyte responses to simian immunodeficiency virus (SIV) are a consistent feature of natural SIV infection in sooty mangabeys. J Virol 80:2771–2783.https://doi.org/10.1128/JVI.80.6.2771 -2783.2006.
10. Bosinger SE, Li Q, Gordon SN, Klatt NR, Duan L, Xu L, Francella N, Sidahmed A, Smith AJ, Cramer EM, Zeng M, Masopust D, Carlis JV, Ran L, Vanderford TH, Paiardini M, Isett RB, Baldwin DA, Else JG, Staprans SI, Silvestri G, Haase AT, Kelvin DJ. 2009. Global genomic analysis reveals rapid control of a robust innate response in SIV-infected sooty mang-abeys. J Clin Invest 119:3556 –3572.
11. Chakrabarti LA, Lewin SR, Zhang L, Gettie A, Luckay A, Martin LN, Skulsky E, Ho DD, Cheng-Mayer C, Marx PA. 2000. Normal T-cell turn-over in sooty mangabeys harboring active simian immunodeficiency virus infection. J Virol 74:1209 –1223.https://doi.org/10.1128/JVI.74.3 .1209-1223.2000.
12. Douek DC. 2003. Disrupting T-cell homeostasis: how HIV-1 infection causes disease. AIDS Rev 5:172–177.
13. Estes JD, Gordon SN, Zeng M, Chahroudi AM, Dunham RM, Staprans SI, Reilly CS, Silvestri G, Haase AT. 2008. Early resolution of acute immune activation and induction of PD-1 in SIV-infected sooty mangabeys distinguishes nonpathogenic from pathogenic infection in rhesus ma-caques. J Immunol 180:6798 – 6807.https://doi.org/10.4049/jimmunol .180.10.6798.
14. Giorgi JV, Hultin LE, McKeating JA, Johnson TD, Owens B, Jacobson LP, Shih R, Lewis J, Wiley DJ, Phair JP, Wolinsky SM, Detels R. 1999. Shorter survival in advanced human immunodeficiency virus type 1 infection is more closely associated with T lymphocyte activation than with plasma virus burden or virus chemokine coreceptor usage. J Infect Dis 179: 859 – 870.https://doi.org/10.1086/314660.
15. Jacquelin B, Mayau V, Targat B, Liovat AS, Kunkel D, Petitjean G, Dillies MA, Roques P, Butor C, Silvestri G, Giavedoni LD, Lebon P, Barre-Sinoussi F, Benecke A, Muller-Trutwin MC. 2009. Nonpathogenic SIV infection of African green monkeys induces a strong but rapidly con-trolled type I IFN response. J Clin Invest 119:3544 –3555.
16. Ma D, Jasinska AJ, Feyertag F, Wijewardana V, Kristoff J, He T, Raehtz K, Schmitt CA, Jung Y, Cramer JD, Dione M, Antonio M, Tracy R, Turner T, Robertson DL, Pandrea I, Freimer N, Apetrei C, International Vervet Research Consortium. 2014. Factors associated with siman immunode-ficiency virus transmission in a natural African nonhuman primate host in the wild. J Virol 88:5687–5705.https://doi.org/10.1128/JVI.03606-13. 17. Pandrea I, Onanga R, Kornfeld C, Rouquet P, Bourry O, Clifford S, Telfer PT, Abernethy K, White LT, Ngari P, Muller-Trutwin M, Roques P, Marx PA, Simon F, Apetrei C. 2003. High levels of SIVmnd-1 replication in chronically infected Mandrillus sphinx. Virology 317:119 –127.https:// doi.org/10.1016/j.virol.2003.08.015.
18. Pandrea IV, Gautam R, Ribeiro RM, Brenchley JM, Butler IF, Pattison M, Rasmussen T, Marx PA, Silvestri G, Lackner AA, Perelson AS, Douek DC, Veazey RS, Apetrei C. 2007. Acute loss of intestinal CD4⫹T cells is not predictive of simian immunodeficiency virus virulence. J Immunol 179:3035–3046.https://doi.org/10.4049/jimmunol.179.5.3035. 19. Beaumier CM, Harris LD, Goldstein S, Klatt NR, Whitted S, McGinty J,
Apetrei C, Pandrea I, Hirsch VM, Brenchley JM. 2009. CD4 downregu-lation by memory CD4⫹T cells in vivo renders African green monkeys resistant to progressive SIVagm infection. Nat Med 15:879 – 885.https:// doi.org/10.1038/nm.1970.
20. Apetrei C, Gaufin T, Gautam R, Vinton C, Hirsch V, Lewis M, Brenchley J, Pandrea I. 2010. Pattern of SIVagm infection in patas monkeys suggests that host adaptation to simian immunodeficiency virus infec-tion may result in resistance to infecinfec-tion and virus extincinfec-tion. J Infect Dis 202(Suppl 3):S371–S376.https://doi.org/10.1086/655970. 21. Vinton C, Klatt NR, Harris LD, Briant JA, Sanders-Beer BE, Herbert R,
Woodward R, Silvestri G, Pandrea I, Apetrei C, Hirsch VM, Brenchley JM. 2011. CD4-like immunological function by CD4-T cells in multiple natural hosts of simian immunodeficiency virus. J Virol 85:8702– 8708.
https://doi.org/10.1128/JVI.00332-11.
22. Milush JM, Mir KD, Sundaravaradan V, Gordon SN, Engram J, Cano CA, Reeves JD, Anton E, O’Neill E, Butler E, Hancock K, Cole KS, Brenchley JM, Else JG, Silvestri G, Sodora DL. 2011. Lack of clinical AIDS in SIV-infected sooty mangabeys with significant CD4⫹ T cell loss is associated with double-negative T cells. J Clin Invest 121:1102–1110.
https://doi.org/10.1172/JCI44876.
23. Paiardini M, Muller-Trutwin M. 2013. HIV-associated chronic immune activation. Immunol Rev 254:78 –101. https://doi.org/10.1111/imr .12079.
24. Pandrea I, Parrish NF, Raehtz K, Gaufin T, Barbian HJ, Ma D, Kristoff J, Gautam R, Zhong F, Haret-Richter GS, Trichel A, Shaw GM, Hahn BH, Apetrei C. 2012. Mucosal simian immunodeficiency virus transmission in African green mo