This is a repository copy of Modelling impacts of agricultural practice on flood peaks in upland catchments: An application of the distributed TOPMODEL.
White Rose Research Online URL for this paper: http://eprints.whiterose.ac.uk/121726/
Version: Accepted Version
Article:
Gao, J, Holden, J orcid.org/0000-0002-1108-4831 and Kirkby, M (2017) Modelling impacts of agricultural practice on flood peaks in upland catchments: An application of the
distributed TOPMODEL. Hydrological Processes, 31 (23). pp. 4206-4216. ISSN 0885-6087
https://doi.org/10.1002/hyp.11355
© 2017 John Wiley & Sons, Ltd. This is the peer reviewed version of the following article: Gao J, Holden J, Kirkby M. (2017) Modelling impacts of agricultural practice on flood peaks in upland catchments: an application of the distributed TOPMODEL. Hydrological Processes, which has been published in final form at https://doi.org/10.1002/hyp.11355. This article may be used for non-commercial purposes in accordance with Wiley Terms and Conditions for Self-Archiving. Uploaded in accordance with the publisher's
self-archiving policy.
[email protected] https://eprints.whiterose.ac.uk/
Reuse
Items deposited in White Rose Research Online are protected by copyright, with all rights reserved unless indicated otherwise. They may be downloaded and/or printed for private study, or other acts as permitted by national copyright laws. The publisher or other rights holders may allow further reproduction and re-use of the full text version. This is indicated by the licence information on the White Rose Research Online record for the item.
Takedown
If you consider content in White Rose Research Online to be in breach of UK law, please notify us by
This article has been accepted for publication and undergone full peer review but has not been through the copyediting, typesetting, pagination and proofreading process which may lead to differences between this version and the Version of Record. Please cite this article as
Modelling impacts of agricultural practice on flood peaks in
upland catchments: an application of the distributed
TOPMODEL
Jihui Gao1, 2, Joseph Holden2, Mike Kirkby2
1. Institute of Hydrology and Water Resources, Zhejiang University, Hangzhou,
310058, China
2. water@leeds, School of Geography, University of Leeds, Leeds, LS2 9JT, UK
Abstract
reduce flood peaks while at the same time ensuring economic viability for upland farmers.
1 Introduction
Vegetation cover and soil properties have been heavily modified by land management practices. Peatland catchments, as flashy hydrological systems, normally with shallow water tables, are sensitive to these modifications. In the UK, many major rivers have their headwaters located in blanket peat. These upland areas are typically grazed with some areas of prescribed burning to promote game bird populations, and more recently there has been investment in peatland
restoration (Parry et al., 2014). These activities usually change land cover and soil properties (e.g. grazing may lead to vegetation loss and soil compaction), and hence influence subsurface flow, overland flow and river flow, particularly in flood events.
During storm events, saturation-excess overland flow dominates the hillslope contributions to the river channel hydrograph in peatland catchments (Holden and Burt, 2002; Holden and Burt, 2003). Land cover change may alter surface roughness (e.g. due to vegetation loss or revegetation) and then, depending on the spatial distribution of land cover, modify the concentration of overland flow on hillslopes in peat catchments. These changes could change the timing and size of river flow peaks in peat catchments. However, there is little work on how blanket peat
vegetation management influences river flow peaks. The modelling study by Gao et al. (2016) suggested that the same land cover change in ‘sensitive’ areas of upland catchments such as riparian zones could have three times the impact on flow peaks as those same changes in headwater areas. This work indicated that the specific locations of land management interventions can play a vital role in influencing flood flows from upland systems. However, in the work of Gao et al. (2016) the
interventions simulated were changes in square plots of different sizes within which the vegetation was switched between Sphagnum-rich cover, bare peat and a sedge mix with outflows from the catchment simulated. In reality, upland management occurs over larger, more joined up areas, covering large parts of subcatchments. Therefore, further work is required to understand how different spatial configurations of land cover change, which are relevant to the scale of policy decisions, may impact downstream flood peaks.
Grazing
(Holden et al., 2007; Zhao, 2007). Lower hydraulic conductivity may also decrease subsurface flow volume and increase the possibility of saturated-excess overland flow generation. Reduction of infiltration capacities may induce infiltration-excess overland flow; however, from the study of Marshall et al. (2009) in an improved pasture hillslope of a headwater peat catchment, infiltration excess overland flow would not be widespread across the hillslope and occur only where soils are
‘severely’ compacted.
At the same time, heavy grazing may induce vegetation loss, as sheep and cattle may eat and trample a large proportion of Eriophorum and other vegetation (Shaw et al., 1996). This vegetation cover loss can reduce surface roughness to accelerate overland flow movement on hillslopes and may set off early and sharp flow peaks in river courses.
There have been subsidy schemes in UK farming, and agri-environment schemes date from the mid-1980s (Hodge and Reader, 2010). Since 2005, the Environmental Stewardship Scheme, comprised of Entry Level Stewardship (ELS) and Higher Level Stewardship (HLS), provides payments to farmers for environmental service
provision (Hodge and Reader, 2010; Quillerou et al., 2011). ELS has more general requirements and higher participation by farmers, while HLS has more specific
environmental commitment and hence lower participation rates (Quillerou and Fraser, 2010; Hejnowicz et al., 2016). The aim of the scheme is to reduce the production intensity and promote environmental protection (Hodge and Reader, 2010). In many uplands in the UK this scheme applies mainly to sheep farming.
Burning
Rotational prescribed burning has operated across large areas of the UK uplands including peatland headwaters for over 100 years (Hobbs and Gimingham, 1987; Thompson et al., 1995; Holden et al., 2007). The main aim of this prescribed burning is to generate a mosaic vegetation distribution with varying ages, promoting the habitat of the game bird, red grouse. These managed fires normally seek to achieve a quick burn of the vegetation cover and to avoid consumption of the underlying peat (Yallop et al., 2006; Holden et al., 2012). This is different to wildfires in peatlands which may last for long periods and often burn down into the peat profile (Davies et al., 2013). Each burning patch in the mosaic is typically burned once every 8-25 years depending on the vegetation productivity and local agreements with
prescribed burn mosaics so that there are always some areas of recent burn (Holden
et al., 2015).
The impact of prescribed burning on high flows in peatland catchments is not entirely clear. The burnt catchments seem to have deeper water tables and more
consolidated peat than similar catchments without burning (Holden et al., 2014; Holden et al., 2015). Deeper water tables may reduce the occurrence of saturation-excess overland flow and river flow peaks in moderate storms. However, in the heaviest storm events, this buffering influence could be limited. Instead, during large storm events, the key factor would be loss of vegetation cover which decreases surface roughness and thus accelerates delivery and concentration of overland flow, thereby increasing flow peaks. The modelling study of Gao et al. (2016) found that lots of bare peat patches covering a random 20% area of a blanket peat catchment increased river flow peaks by 10% compared to the scenario with no bare peat patches (1-hour 20 mm/hr storm event).
Revegetation
From the end of the last century, many degraded peatland catchments have
undergone peatland restoration, and the main techniques of peat restoration include drain blocking, gully blocking, bare peat stabilisation and vegetation restoration (Parry et al., 2014). These practises may change the hydrological regime of peat catchments and influence the movement and concentration of overland flow and river flow peaks in flood events. Compared to drain blocking, several studies have shown that surface roughness increase resulting from vegetation restoration may have a greater impact on peak flows (Holden et al., 2008b; Ballard et al., 2012; Lane and Milledge, 2013). This may be particularly the case for Sphagnum cover which is a common peatland plant which has large surface roughness (Holden et al., 2008a). Grayson et al. (2010) found lower flow peaks in a peat catchment with good
vegetation cover compared to periods when the same catchment had a higher proportion of bare peat. However, there has been a lack of studies that have
examined such effects. This is mainly because long-term river flow records in upland peat systems are lacking.
Hydrological modelling
Existing models and most recent work has focussed on propagation of floods
2005; Boll et al., 2015). However, driven by some recent serious flooding, there is
currently much political discussion in the UK about ‘natural flood management’ which
involves finding upstream solutions to downstream flood problems. Thus practitioners and policy makers require tools and evidence to test and inform catchment management solutions to reduce flooding. Hydrological modelling tools can be used to simulate land management scenarios, and can quantify land
management impacts on flood peaks downstream. Land management scenarios can be designed and modelled in a distributed hydrological model. An individual scenario can be simulated under various rainfall events, and different scenarios can also be run in a duplicated storm. These simulations can help us to understand how upland management impacts peak river flow in a same catchment under different potential conditions.
Gao et al. (2015) recently developed a spatially distributed version of TOPMODEL with a specific overland flow roughness module suitable for upland peat systems. They showed that the model was an effective tool for examining land cover impacts on river flow peaks in these systems. There are two main merits of the distributed TOPMODEL for studying the impact of land management on flood hydrographs in blanket peat catchments: 1) the water storage change of peat and its impact on overland flow production can be simulated (spatially-distributed) by the model; 2) overland flow occurrence (the locations and rates of overland flow generation), movement (according to the surface roughness presented by the vegetation cover, considering gradient and flow depth) and the locations where overland flow infiltrates into soil or enters watercourses in the catchment can be predicted to give an
overland flow map in every modelled time point during and after a storm event. These advantages mean that land-cover and soil condition change in different parts of the catchment can be evaluated with regard to impacts on the flow at the
catchment outlet.
2 Study site
An upland catchment, Coverdale, in the Yorkshire Dales National Park of the UK was chosen as the study site. The Coverdale catchment (5416’ N, 243’ W) covers
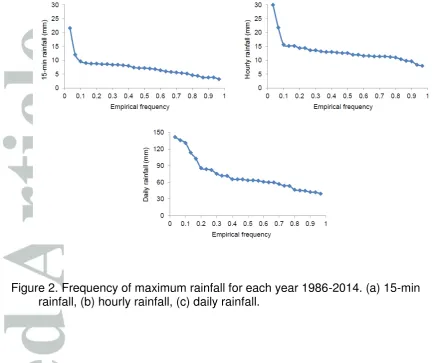
84.0 km2 with an elevation ranging between 97 m and 675 m AOD (Figure 1), and a mean slope of 12.7%. The river Cover is a tributary of the River Ure, which supplies river flow to important urban areas downstream, as part of the larger Ouse basin, including the historic City of York which is seeking to improve flood alleviation through both urban flood defences and also upstream catchment solutions. The Coverdale catchment has a mean annual precipitation of 1757 mm based on the Environment Agency rainfall record (station number: 047281) between 1986 and 2014. Figure 2 shows the rainfall frequency analysis in this period.
3 Methodology
3.1 Distributed TOPMODEL
The distributed TOPMODEL developed by Gao et al. (2015) is a spatial-distributed version of TOPMODEL which was lumped or semi-distributed when originally developed by Beven and Kirkby (1979). The new model, using grid cells as
computational units, keeps the key equations of runoff production from the original TOPMODEL (see (Kirkby, 1997)), but downscales those equations from catchment scale to cell scale. The overland flow movement is described by a new module in which the multiple-direction flow theory of Quinn et al. (1991) and the Darcy-Weisbach equation are employed to give overland flow direction depending on topography and its velocity taking slope, water depth and surface roughness into account. A stochastic algorithm is involved to describe the routing of overland flow in the module.
The distributed TOPMODEL has three key parameters for peatland catchment modelling. K is hydraulic conductivity of the soil. m is a scaling parameter representing the active water storage in soil. kv is an overland flow velocity
parameter related to surface roughness. The velocity parameter was derived from an empirical study of overland flow in a UK blanket peatland catchment by Holden et al.
the map of each parameter can be used to describe the heterogeneous properties of the catchment.
3.2 Land management scenarios
Land management scenarios were designed to model the impact of land
management on peak river flow in storm events in upland peat catchments. These scenarios represent different land management types and spatial patterns. There is
a ‘normal’ land management scenario with a uniform Eriophorum surface cover and no soil compaction which is treated as the baseline status for scenario comparison (the vegetation cover in the catchment is dominated by Eriophorum).
For this study, K was assumed to be horizontally homogeneous; while m and kv are
spatially variable to represent different spatial configurations of soil compaction and land cover. A map of parameter m from the soil conditions in the catchment and another map of kv based on the land cover map of the catchment were used as
inputs in scenario modelling runs.
Grazing
There are two different sheep grazing subsidy schemes operating in the catchment. The ELS scheme covers 24.4 km2 and the HLS scheme covers 42.6 km2. It is
assumed that there could be two levels of grazing intensity: light grazing compacting soil but with little overall removal of vegetation, and heavy grazing with both soil compaction and vegetation cover loss. A series of scenarios were organised to represent light or heavy grazing conducted in ELS and HLS regions separately and together (shown in Figure 3).
A half value of m was set in all grazing areas to describe soil compaction by livestock. This reflects previous values obtained in previous studies using TOPMODEL, in which the m varied from 2-5 mm in areas of heavy and organic-rich soils to as much as 30 mm for readily draining brown earths (Beven et al., 1984). For the heavy grazing scenarios, the overland flow velocity parameter in the model was set as twice that of Eriophorum to represent the impact of vegetation loss on overland flow movement (the velocity parameter on bare peat soil is five times that on the
Burning
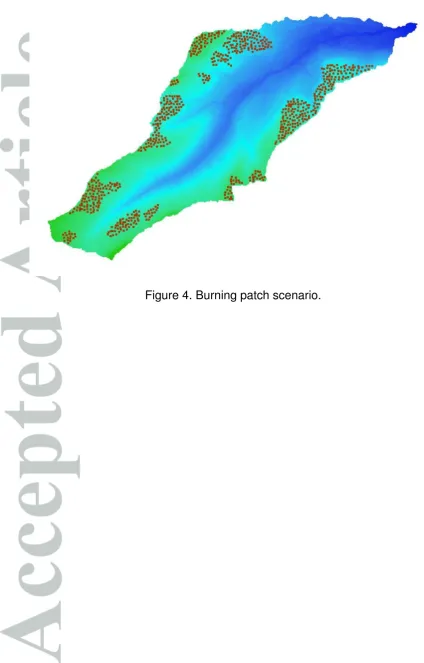
Parts of Coverdale have undergone prescribed burning for several decades although the exact burning history is not known. Rotational burning regions were determined from aerial photos. For the scenario of prescribed burning in the catchment, it is assumed that all burning areas undergo a 10-year rotational burn and 40% of the burning patch area is recently burnt (7.3 km2, 8.8% of the catchment). The surface roughness of the recently burnt area was reduced by 50% compared to the normal surface in the catchment and the hydraulic conductivity was decreased by 50% compared to the normal conditions without burning in line with the field studies by (Holden et al., 2014).
Figure 4 illustrates the burning patch scenario and the size of each patch was set as 100m×100m. It is already known that variation in patch size at this scale does not affect peak flow in flood events (principle 2 of Gao et al. (2016)), so what will be important to understand is how the occurrence of burning and its location influences flow peaks.
Revegetation
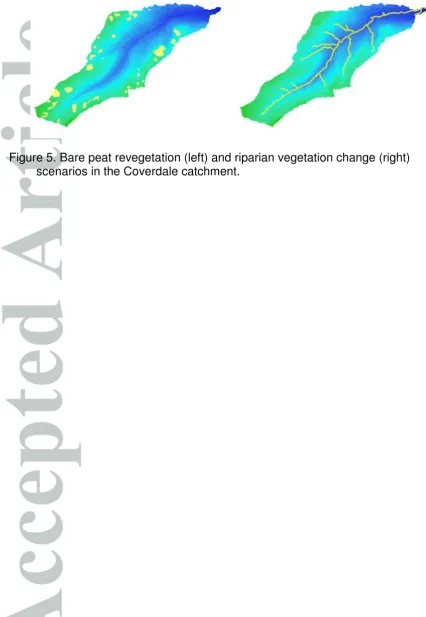
The bare areas were digitized using aerial photos. Most bare areas were
concentrated in the headwaters and they covered 5.8 % of the catchment (Figure 5). To explicitly evaluate the impact of bare soil restoration on river flow, two scenarios representing re-vegetating all of these areas with either Eriophorum or Sphagnum
were simulated and compared to the simulations undertaken when retaining the bare peat.
The hilltoe and riparian zone is considered to be a highly sensitive area for land-cover impacts on flood peaks in peatland catchments (Gao et al., 2016). Vegetation restoration in these areas could attenuate flood peaks more effectively than other locations in the catchment. A further scenario was therefore designed (Figure 5) to represent riparian zone vegetation change from Eriophorum to Sphagnum. The same proportion of the catchment land cover was changed as above (i.e. 5.8% of the catchment), but the bare areas elsewhere in the catchment were left unrestored.
3.3 Modelling runs
land cover change scenarios on river flow in different rainfall conditions. Using simple patterns of precipitation in this way enabled us to track possible small differences in modelled response between the scenarios.
The size of the DEM grid cell used in the study was 20m by 20m. The time step was set as 0.1 hr in the scenario modelling runs to identify possible minor differences between scenario results. A 10-time step (1 hour) warming-up stage for the model occurred at the beginning of each scenario run before precipitation was input. Following 10 steps of uniform rainfall, there were another 80 time steps in the entire modelling period. Focusing on the rising and falling limbs around peak time, the resulting hydrographs of land management scenarios are shown within the figures below. It was assumed that there was no overland flow on the hillslope at the starting time step.
Due to the lack of river flow data in the Coverdale catchment, it is difficult to optimize the parameters of the distributed TOPMODEL in this catchment. A nearby catchment within the upper Ure, Snaizeholme Beck (54 17’ N, 215’ W), was employed to
optimize the parameter set of the catchment hydrological model. The Snaizeholme Beck catchment is close to the Coverdale catchment (15 km away) and its land cover is similar to Coverdale. Long term flow data is available (2003-2014, 15-min interval) for the Snaizeholme Beck catchment.
Two 3-day periods in summer were picked as calibration and validation periods in order to avoid confusion due to the possible impact of snow and its melt in winter, and the two periods (i.e. 0:00 17th Aug 2012 – 23:59 19th Aug 2012 and 0:00 8th June 2011 - 23:59 10th June 2011) contain the largest hourly rainfall intensities in the rainfall record. The key features of moorland vegetation and soil condition affecting peak river flow in floods do not vary largely in winter when compared to summer, such as surface roughness and soil hydraulic conductivity. Flashy discharge occurs throughout the year as these upland systems respond quickly to rainfall events in all seasons and water table remains shallow even in summer.Thus use of summer records is reasonable. Each period has 288 time steps with 15 min intervals which matches the interval of rainfall and river flow records. Around 50 test runs of the model were operated through the calibration period to identify a good performing set of parameters (m = 14 mm, K = 100 m/hr, kv = 30). There was good correspondence
were not quite captured by the model, most importantly the flow peaks were well simulated in both periods. Thus the model has a good performance in the
Snaizeholme catchment, and the parameter set acquired in the calibration and validation process was used in the scenario study in the Coverdale catchment. All parameter sets used in the modelling runs of the land management scenarios are presented in Error! Reference source not found..
4 Results
4.1 Grazing
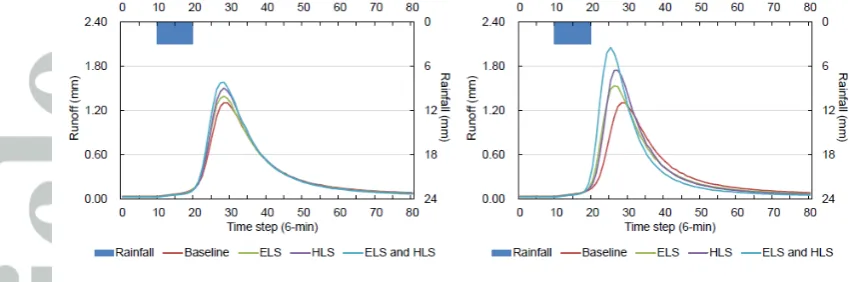
All grazing scenarios resulted in larger flow peaks and earlier rising limbs of the peaks compared to the hydrograph of the baseline scenario (Figure 7 and Figure 8). The hydrograph comparison between the grazing scenarios and the baseline
scenario can be seen in Error! Reference source not found.. Grazing on HLS land results in more than twice the relative change to the baseline condition compared to grazing on ELS land. The scenario with both ELS and HLS regions grazed has a large impact on river flow peaks with, for example, even just for the light grazing scenario, a predicted 18-min earlier flow peak and a 32.9 % increase in peak discharge for the 15 mm storm event. Heavy grazing scenarios had much greater influence on flow peaks than light grazing; for the same 15 mm storm with grazing across the ELS and HLS regions the peak was 42-min earlier and 82.2 % higher than baseline (Figure 7, Error! Reference source not found.).
4.2 Burning
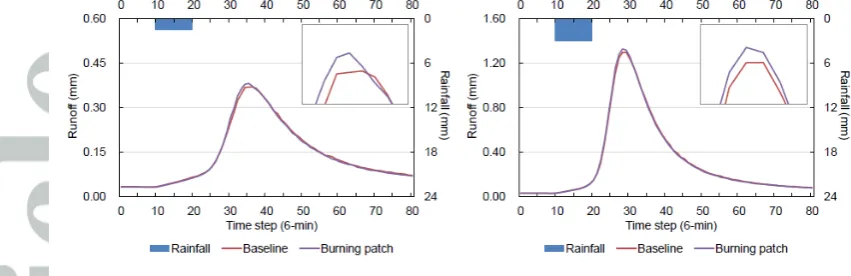
The modelling results for the burning scenario indicate that burn patches in the headwaters slightly raise the flow peaks under each storm event compared to baseline conditions (Figure 9). The peaks were increased by 3.2 % (2.80 m3/s) and 2.3 % (7.00 m3/s) under the 15 mm and 30 mm storm events respectively, and there was not large impact on flow peak timing (Error! Reference source not found.).
4.3 Revegetation
scenario in the grazing and burning scenario sets above. The scenario of no-revegetation was the ‘standard’ scenario for this comparison. Riparian vegetation change to Sphagnum produced much lower flow peaks and strongly delayed the hydrograph peak under both rainfall events (Error! Reference source not found.).
We compared the extreme cases for the catchment. The first is a scenario with heavy grazing in ELS and HLS areas combined with burning (the intensive
management scenario). The second is no grazing and burning combined with bare soil revegetation with Eriophorum plus riparian areas vegetated with Sphagnum (the conservationscenario). The modelling results showed that the intensive
managementscenario raised river flow peaks by 86.3% and 59.2% respectively under 15 mm and 30 mm storm events compared to the baseline scenario and the peaks were 7 time steps and 3 time steps earlier. The flow peaks for the
conservation scenario decreased by 12.1% and 10.8% and the peaks were both 3 time steps later for the two events compared to the baseline scenario.
5 Discussion
Modelling results suggest that grazing regimes and riparian vegetation change in the Coverdale catchment could have a large impact on flow peaks. In relative terms, using the particular spatial configuration that exists within Coverdale, prescribed burning and bare peat revegetation may have smaller influences on the flood
hydrographs than grazing density and riparian vegetation change. That is not to say that prescribed burning and revegetation had no effect on flood risk. Rather their effect in this catchment was smaller than other management effects studied. It may be that in other catchments, burning and revegetation have greater influence on flood peaks due to the location of the burning or revegetation. It should also be noted that land management could change other hydrological elements and processes in peat catchments, such as evapotranspiration, interception and water-table depths. However, it is thought that during storm events on blanket peat these effects could be minor and here we have considered peak flows during storm events as our focus. Indeed 1 mm of rainfall can raise the peat water table by several cm and bring it quickly to the surface (Evans et al., 1999).
In this study, a well-performing parameter set from the calibration and validation was applied in the baseline scenario rather than a cluster of parameter sets for the GLUE (generalized likelihood uncertainty estimation) method (Beven and Binley, 1992). The uncertainty of this single parameter set could affect the results of land
computational time (more than 2 hours for a calibration and validation or scenario run for Coverdale using an i5-CPU desktop PC), the GLUE method was not affordable for direct application in this study. However, uncertainties in the model have previously been investigated by Gao et al. (2016). The GLUE method was employed by Gao et al. (2016) and 50 parameter sets (each set included 3 parameters, i.e. m, K, kv) were randomly selected for three different study
catchments in its representative parameter space and used to run the model in the calibration period 50 times. The top five parameter sets with the highest Nash-Sutcliffe efficiencies (all >0.82) were obtained for each catchment that they studied (the five sets performed well also in validation periods). They were then used in land-cover scenario runs (only kv was changed in the land cover change areas of the land
cover scenarios). The results were entirely consistent with the results which were obtained by using one parameter set. Thus, based on GLUE results obtained by Gao
et al. (2016) using our model, we think that, for Snaizeholme and Coverdale, the one well-performing parameter set chosen was appropriate.
Grazing
Grazing in the current areas of subsidies covered by ELS and HLS schemes may increase flood risk produced by the Coverdale catchment. A large proportion of the ELS area in the catchment is concentrated in the downslope and riparian zones (which is typical of many upland schemes in other catchments in the UK). Change in these zones are thought to mainly influence the rising limbs of the flow peaks.
Conversely most HLS areas are located in the upper parts of the catchment. Thus, the peaks of ELS scenario hydrographs occur earlier than the same scenarios
applied only to the HLS areas, although the peaks of HLS scenarios are much higher than the ELS ones. The results also show that if vegetation loss and soil compaction resulting from heavy grazing has happened in the system, then vegetation
benefits on top of those resulting from changes in surface vegetation roughness, through reduced compaction in the years after grazing has been removed, although there is a lack of empirical data for UK upland soils.
Burning
The impact of burning patches on flow peaks was relatively limited in our study. This may be because the total area of the burning patches was only 8.7% of the
catchment area and, more importantly, most burning was located on the headwater locations which have been found to be low-effect areas for river flow peaks (Gao et al., 2016). In recent years, managed burning in UK upland peatlands has been widespread (Yallop et al., 2006; Douglas et al., 2015; Holden et al., 2015). For upland peat catchments like Coverdale, if burning areas extend further downslope in the future and into riparian areas, then this may have a greater influence on river flow during storm events.
Vegetation restoration
Restoration with denser vegetation (e.g. Sphagnum) on bare soil can reduce flood risk more effectively than coarser vegetation (e.g. Eriophorum) in storm events. However, for the Coverdale case, because bare areas were restricted to relatively insensitive parts of the catchment, there would be limited impacts on flood peaks by revegetating those zones. Instead, encouraging vegetation change towards rougher conditions in riparian zones, which is considered to be one of the best regions for management practices of surface water protection in catchments (Lyons et al., 2000; Henault-Ethier et al., 2017), will yield greater benefits on reducing flood peaks from the catchment. This is because riparian zones are more efficient areas impacting overland flow delivery due to the converging shape of river catchments and the accompanying overland flow concentration (Gao et al., 2016).
Different spatial distributions of vegetation change result in very different outcomes for flood peaks even when the proportion of the catchment which undergoes
Storm size
For all sets of land management scenarios studied, as rainfall intensity increased from 15 mm/hr to 30mm/hr, the relative change in the flood peaks of the land
management scenarios decreased compared to the baseline scenario. However, the absolute change in flood peak became greater. This means that loss of vegetation cover and soil compaction can increase flood peaks by a larger absolute value in heavier rainfall than in smaller storms. However, effects of rainfall intensity and its temporal and spatial distributions on river flow in floods would require further research.
6. Conclusion
Using the distributed TOPMODEL, this paper presented modelling to evaluate impacts of typical UK upland management activities (grazing, burning and potential vegetation restoration) on river flow in flood events in a headwater peat catchment (Coverdale). Management was found to greatly shape the flood flow peaks.
Grazing in ELS and HLS areas in the catchment can enhance flood risk in Coverdale due to vegetation cover loss and soil compaction. The degradation of vegetation cover induced by heavy grazing may produce greater impacts on flood hydrographs in the peat catchment than light grazing which only results in soil compaction. For instance, under a 15mm rainfall event, heavy grazing in the areas of both ELS and HLS increases the flow peak by 82.2%; while light grazing (no vegetation loss) raises the peak by 32.9%. Burning patches gave slight impacts (around 3%) on flood peaks at the catchment outlet due to the low coverage across the whole catchment (8.8%) and the upslope location of the burning patch distribution. Re-vegetation with
Sphagnum in bare soil areas (mostly in headwaters of the catchment) in Coverdale could reduce peak flow by over 5% in 15 mm hr-1 and 30 mm hr-1 rainfall events even though the bare soil area is not large (5.8 % of the catchment). However, if
revegetation (Eriophorum to Sphagnum) occurred in an identically sized area (5.8 %) of the riparian zone along river channels, the reduction of flood peaks would be much larger (15.0% and 14.0% decreases of flow peaks in the two storms) than the bare soil revegetation scenario. From a management perspective, efficiency savings can be made by investing in riparian buffer zones.
2005; Rogger et al., 2017). For grazing and burning scenarios, there are earlier rising and falling limbs than the baseline scenario; conversely the delayed rising and falling limbs are retained by re-vegetation scenarios. Heavy grazing in ELS and HLS areas induced the largest timing change in all scenarios, in which a seven-time step (42 min) earlier flood peak was produced under the 30 mm storm compared to the baseline scenario. Revegetation with Eriophorum in riparian areas delayed flow peaks by 18 min and 12 min respectively under the 15 mm and 30 mm rainfall events.
Our application of the distributed TOPMODEL in the Coverdale catchment shows how the method could be an effective and efficient tool to help land managers evaluate how changes in agricultural practice would affect flood risk in upland catchments. Further work is now required to measure soil properties and surface roughness on the organo-mineral soils that often occur further down the catchment below blanket peat headwaters. This would enable the model to be run over larger spatial scales covering several soil types and providing an integrating tool for land
managers seeking to derive ‘nature-based solutions’ to flooding.
Acknowledgements
References
Ballard CE, McIntyre N, Wheater HS. 2012. Effects of peatland drainage
management on peak flows. Hydrology and Earth System Sciences, 16: 2299-2310. DOI: 10.5194/hess-16-2299-2012.
Beven K, Binley A. 1992. The future of distributed models - model calibration and uncertainty prediction. Hydrological Processes, 6: 279-298. DOI:
10.1002/hyp.3360060305.
Beven KJ, Kirkby MJ. 1979. A physically-based variable contributing area model of basin hydrology. Hydrological Sciences Bulletin, 24: 43-69.
Beven KJ, Kirkby MJ, Schofield N, Tagg AF. 1984. Testing a physically-based flood forecasting-model (Topmodel) for 3 UK catchments. Journal of Hydrology, 69: 119-143. DOI: 10.1016/0022-1694(84)90159-8.
Boll J, Brooks ES, Crabtree B, Dun S, Steenhuis TS. 2015. Variable source area hydrology modeling with the water erosion prediction project model. Journal of the American Water Resources Association, 51: 330-342. DOI: 10.1111/1752-1688.12294.
Davies GM, Gray A, Rein G, Legg CJ. 2013. Peat consumption and carbon loss due to smouldering wildfire in a temperate peatland. Forest Ecology and
Management, 308: 169-177. DOI: 10.1016/j.foreco.2013.07.051.
Douglas DJT, Buchanan GM, Thompson P, Amar A, Fielding DA, Redpath SM, Wilson JD. 2015. Vegetation burning for game management in the UK uplands is increasing and overlaps spatially with soil carbon and protected areas. Biological Conservation, 191: 243-250. DOI:
10.1016/j.biocon.2015.06.014.
Evans MG, Burt TP, Holden J, Adamson JK. 1999. Runoff generation and water table fluctuations in blanket peat: evidence from UK data spanning the dry summer of 1995. Journal of Hydrology, 221: 141-160. DOI: 10.1016/s0022-1694(99)00085-2.
Gao J, Holden J, Kirkby M. 2015. A distributed TOPMODEL for modelling impacts of land-cover change on river flow in upland peatland catchments. Hydrological Processes, 29: 2867-2879. DOI: 10.1002/hyp.10408.
Gao J, Holden J, Kirkby M. 2016. The impact of land-cover change on flood peaks in peatland basins. Water Resources Research, 52: 3477-3492. DOI:
10.1002/2015WR017667.
Grayson R, Holden J, Rose R. 2010. Long-term change in storm hydrographs in response to peatland vegetation change. Journal of Hydrology, 389: 336-343. DOI: 10.1016/j.jhydrol.2010.06.012.
Hejnowicz AP, Rudd MA, White PCL. 2016. A survey exploring private farm advisor perspectives of agri-environment schemes: The case of England's
Environmental Stewardship programme. Land Use Policy, 55: 240-256. DOI: 10.1016/j.landusepol.2016.04.005.
Hobbs RJ, Gimingham CH. 1987. Vegetation, fire and herbivore interactions in heathland. Advances in Ecological Research, 16: 87-173. DOI:
10.1016/s0065-2504(08)60088-4.
Hodge I, Reader M. 2010. The introduction of Entry Level Stewardship in England: Extension or dilution in agri-environment policy? Land Use Policy, 27: 270-282. DOI: 10.1016/j.landusepol.2009.03.005.
Holden J. 2005. Peatland hydrology and carbon release: why small-scale process matters. Philosophical Transactions of the Royal Society a-Mathematical Physical and Engineering Sciences, 363: 2891-2913. DOI:
10.1098/rsta.2005.1671.
Holden J, Burt TP. 2002. Infiltration, runoff and sediment production in blanket peat catchments: implications of field rainfall simulation experiments. Hydrological Processes, 16: 2537-2557. DOI: 10.1002/hyp.1014.
Holden J, Burt TP. 2003. Runoff production in blanket peat covered catchments. Water Resources Research, 39: 257-271. DOI: 10.1029/2002wr001956. Holden J, Chapman PJ, Palmer SM, Kay P, Grayson R. 2012. The impacts of
prescribed moorland burning on water colour and dissolved organic carbon: A critical synthesis. Journal of Environmental Management, 101: 92-103. DOI: 10.1016/j.jenvman.2012.02.002.
Holden J, Kirkby MJ, Lane SN, Milledge DG, Brookes CJ, Holden V, McDonald AT. 2008a. Overland flow velocity and roughness properties in peatlands. Water Resources Research, 44: 663-671. DOI: 10.1029/2007wr006052.
Holden J, Palmer SM, Johnston K, Wearing C, Irvine B, Brown LE. 2015. Impact of prescribed burning on blanket peat hydrology. Water Resources Research,
51: 6472-6484. DOI: 10.1002/2014wr016782.
Holden J, Shotbolt L, Bonn A, Burt TP, Chapman PJ, Dougill AJ, Fraser EDG, Hubacek K, Irvine B, Kirkby MJ, Reed MS, Prell C, Stagl S, Stringer LC, Turner A, Worrall F. 2007. Environmental change in moorland landscapes. Earth-Science Reviews, 82: 75-100. DOI: 10.1016/j.earscirev.2007.01.003. Holden J, Walker J, Evans MG, Worrall F, Bonn A. 2008b. A Compendium of Peat
Restoration and Management Projects. Defra report SP0556.
Holden J, Wearing C, Palmer S, Jackson B, Johnston K, Brown LE. 2014. Fire decreases near-surface hydraulic conductivity and macropore flow in blanket peat. Hydrological Processes, 28: 2868-2876. DOI: 10.1002/hyp.9875. Kirkby MJ. 1997. TOPMODEL: A personal view. Hydrological Processes, 11:
1087-1097. DOI: 10.1002/(sici)1099-1085(199707)11:9<1087::aid-hyp546>3.0.co;2-p.
Lane SN. 2003. More floods, less rain? Changing hydrology in a Yorkshire context. . In: Global Warming in a Yorkshire Context, Atherden M (ed.) PLACE
Research Centre.
Lane SN, Milledge DG. 2013. Impacts of upland open drains upon runoff generation: a numerical assessment of catchment-scale impacts. Hydrological Processes,
27: 1701-1726. DOI: 10.1002/hyp.9285.
Lyons J, Trimble SW, Paine LK. 2000. Grass versus trees: Managing riparian areas to benefit streams of central North America. Journal of the American Water Resources Association, 36: 919-930. DOI:
10.1111/j.1752-1688.2000.tb04317.x.
management on flooding: results from an improved pasture hillslope. Hydrological Processes, 23: 464-475. DOI: 10.1002/hyp.7157.
Meyles EW, Williams AG, Ternan JL, Anderson JM, Dowd JF. 2006. The influence of grazing on vegetation, soil properties and stream discharge in a small
Dartmoor catchment, southwest England, UK. Earth Surface Processes and Landforms, 31: 622-631. DOI: 10.1002/esp.1352.
Parry LE, Holden J, Chapman PJ. 2014. Restoration of blanket peatlands. Journal of Environmental Management, 133: 193-205. DOI:
http://dx.doi.org/10.1016/j.jenvman.2013.11.033.
Quillerou E, Fraser R. 2010. Adverse Selection in the Environmental Stewardship Scheme: Does the Higher Level Stewardship Scheme Design Reduce Adverse Selection? Journal of Agricultural Economics, 61: 369-380. DOI: 10.1111/j.1477-9552.2010.00240.x.
Quillerou E, Fraser R, Fraser I. 2011. Farmer Compensation and its Consequences for Environmental Benefit Provision in the Higher Level Stewardship Scheme. Journal of Agricultural Economics, 62: 330-339. DOI:
10.1111/j.1477-9552.2011.00291.x.
Quinn P, Beven K, Chevallier P, Planchon O. 1991. The prediction of hillslope flow paths for distributed hydrological modeling using digital terrain models. Hydrological Processes, 5: 59-79. DOI: 10.1002/hyp.3360050106. Rogger M, Agnoletti M, Alaoui A, Bathurst JC, Bodner G, Borga M, Chaplot V,
Gallart F, Glatzel G, Hall J, Holden J, Holko L, Horn R, Kiss A, Kohnová S, Leitinger G, Lennartz B, Parajka J, Perdigão R, Peth S, Plavcová L, Quinton JN, Robinson M, Salinas JL, Santoro A, Szolgay J, Tron S, van den Akker JJH, Viglione A, Blöschl G. 2017. Land use change impacts on floods at the catchment scale: Challenges and opportunities for future research. Water Resources Research. DOI: 10.1002/2017WR020723.
Saghafian B, Khosroshahi M. 2005. Unit response approach for priority
determination of flood source areas. Journal of Hydrologic Engineering, 10: 270-277. DOI: 10.1061/(asce)1084-0699(2005)10:4(270).
Shaw SC, Wheeler BD, Kirby P, Phillipson P, Edmunds R. 1996. Literature Review of the Historical Effects of Burning and Grazing of Blanket Bog and Upland Wet Heath. English Nature.
Thompson DBA, Hester AJ, Usher MB. 1995. Heaths and Moorland: cultural landscapes. HMSO.
Yallop AR, Thacker JI, Thomas G, Stephens M, Clutterbuck B, Brewer T, Sannier CAD. 2006. The extent and intensity of management burning in the English uplands. Journal of Applied Ecology, 43: 1138-1148. DOI: 10.1111/j.1365-2664.2006.01222.x.
Table 1. Parameter sets of different types of land management used in the scenario runs.
Parameter set
m (mm) K (m/hr) kv (-)
Baseline 14 100 30
Grazing
light 7 100 30
heavy 7 100 60
Burning 14 50 60
Revegetation
Bare soil 14 100 150
Eriophorum 14 100 30
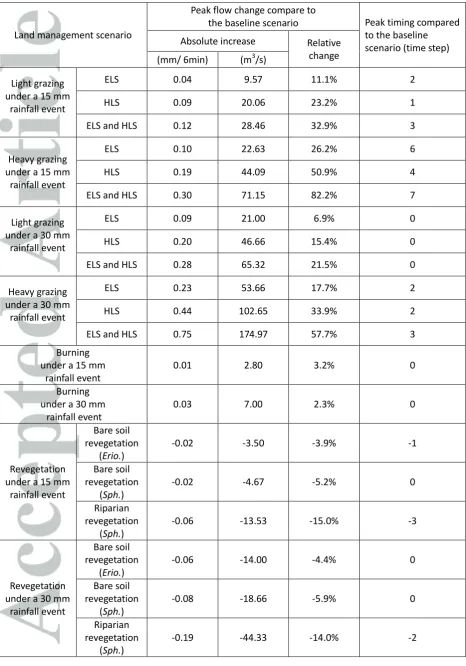
Table 2. Modelling comparison of the land management scenarios.
Land management scenario
Peak flow change compare to
the baseline scenario Peak timing compared to the baseline scenario (time step) Absolute increase Relative
change (mm/ 6min) (m3/s)
Light grazing under a 15 mm
rainfall event
ELS 0.04 9.57 11.1% 2
HLS 0.09 20.06 23.2% 1
ELS and HLS 0.12 28.46 32.9% 3
Heavy grazing under a 15 mm
rainfall event
ELS 0.10 22.63 26.2% 6
HLS 0.19 44.09 50.9% 4
ELS and HLS 0.30 71.15 82.2% 7
Light grazing under a 30 mm
rainfall event
ELS 0.09 21.00 6.9% 0
HLS 0.20 46.66 15.4% 0
ELS and HLS 0.28 65.32 21.5% 0
Heavy grazing under a 30 mm
rainfall event
ELS 0.23 53.66 17.7% 2
HLS 0.44 102.65 33.9% 2
ELS and HLS 0.75 174.97 57.7% 3
Burning under a 15 mm
rainfall event
0.01 2.80 3.2% 0
Burning under a 30 mm
rainfall event
0.03 7.00 2.3% 0
Revegetation under a 15 mm
rainfall event
Bare soil revegetation
(Erio.)
-0.02 -3.50 -3.9% -1
Bare soil revegetation
(Sph.)
-0.02 -4.67 -5.2% 0
Riparian revegetation
(Sph.)
-0.06 -13.53 -15.0% -3
Revegetation under a 30 mm
rainfall event
Bare soil revegetation
(Erio.)
-0.06 -14.00 -4.4% 0
Bare soil revegetation
(Sph.)
-0.08 -18.66 -5.9% 0
Riparian revegetation
(Sph.)