Correspondence
Adaptive Beamforming and Adaptive Modulation-Assisted Network Performance of Multiuser Detection-Aided
FDD and TDD CDMA Systems
S. Ni, Jonathan S. Blogh,Member, IEEE, and Lajos Hanzo,Fellow, IEEE
Abstract—The network performance of a frequency division duplex and time division duplex (TDD) code division multiple access (CDMA)-based system is investigated using system parameters similar to those of the Universal Mobile Telecommunication System. The new call blocking and call dropping probabilities, the probability of low-quality access, and the required average transmit power are quantified both with and without adaptive antenna arrays (AAAs), as well as when subjected to shadow fading. In some of the scenarios investigated, the system’s user capacity is doubled with the advent of adaptive antennas. The employment of adaptive modulation techniques in conjunction with AAAs resulted in further significant network capacity gains. This is particularly so in the context of TDD CDMA, where the system’s capacity becomes poor without adaptive antennas and adaptive modulation owing to the high base station (BS) to BS interference inflicted as a consequence of potentially using all time slots in both the uplink and downlink of the emerging wireless Internet.
Index Terms—Adaptive beamforming, adaptive modulation, code division multiple access (CDMA) systems, Universal Mobile Telecom-munication System Terrestrial Radio Access (UTRA), wireless network performance.
I. INTRODUCTION
At the time of writing, the third-generation (3G) mobile systems termed as International Mobile Telecommunications-2000 (IMT-2000) by the International Telecommunications Union [1]–[4] have been rolled out in various parts of the globe. The IMT-2000 standard frame-work is in fact constituted by a loose conglomerate of five different standards. These are the Universal Mobile Telecommunication System Terrestrial Radio Access (UTRA) frequency division duplex (FDD) wideband code division multiple access (WCDMA) mode [3]–[6] and the UTRA time division duplex (TDD) CDMA mode [3]–[6]. Hence, the FDD/TDD dual mode operation is facilitated, which pro-vides a basis for the development of low-cost terminals. Further-more, the interworking of UTRA with the Global System for Mobile Communications [3]–[5] is ensured. In UTRA, the different service needs are supported in a spectrally efficient way by a combination of FDD and TDD. The FDD mode is intended for applications in both macrocellular and microcellular environments, supporting data rates of up to 384 kb/s and high mobility. The TDD mode, on the other hand, is more suited for microcellular and picocellular environments and for licensed and unlicensed cordless and wireless local loop applications. It was designed for exploiting the unpaired spectrum, for example, in wireless Internet applications, where the teletraffic is not necessarily identical in the uplink (UL) and downlink (DL).
Manuscript received January 17, 2002; revised April 1, 2005, June 23, 2006, and February 14, 2007. The review of this paper was coordinated by Dr. Y. Yoon.
The authors are with the School of Electronics and Computer Science, University of Southampton, SO17 1BJ Southampton, U.K. (e-mail: lh@ecs. soton.ac.uk).
Digital Object Identifier 10.1109/TVT.2007.895470
A. State-of-the-Art Studies
A number of studies have been conducted in the literature in order to characterize the teletraffic capacity of WCDMA-assisted 3G networks [7]–[14]. Against this backdrop [7]–[14], the novelty of this paper is that it jointly investigates the performance benefits of adaptive anten-nas [3], adaptive modulation [15], and multiuser detection [15]–[17] while jointly optimizing the physical and network layers in both FDD and TDD contexts. Our approach is based on extensive network simulations, since the joint analytical treatment of such a complex system is unrealistic. We will show that these advanced techniques have the potential of doubling the achievable network capacity of both FDD and TDD CDMA. Furthermore, we will demonstrate that the capacity of TDD CDMA is rather poor without adaptive antennas and adaptive modulation owing to the high base station (BS) to BS interference inflicted as a consequence of potentially using all time slots in both UL and DL. In this context, we note that we are unaware of any similarly advanced 3G network simulator that is capable of similarly accurately modeling the complex interplay of the follow-ing sophisticated system components: minimum mean squared error block decision feedback equalized (MMSE-BDFE) multiuser detector (MUD); adaptive quadrature amplitude modulation (AQAM); adaptive beamforming; power control; and soft handover. Explicitly, we will demonstrate that the capacity of the FDD mode is substantially in-creased by both beamforming and AQAM but, in particular, when the two techniques are combined. We will then also show that the capacity of the TDD mode becomes poor unless the proposed beamforming and AQAM schemes are invoked.
The outline of this paper is as follows: In Section II, we briefly describe the system investigated and the performance metrics as well as the system parameters used. The adaptive antenna [3] assisted network performance is quantified in Section III, while the additional performance benefits of using adaptive modulation [15] in a pedestrian scenario are quantified in Section IV. We conclude in Section VI.
II. SYSTEMCOMPONENTS ANDPERFORMANCEMETRICS
Accurate power control is essential in CDMA in order to mitigate the near–far problem, which affects network capacity and coverage [18]. Closed-loop power control is employed on both UL and DL. The mobile stations (MSs) and BSs estimate the signal-to-interference ratio (SIR) every 0.667 ms, or in each timeslot, and compare this estimated SIR to a target SIR. If the estimated SIR is higher than the target SIR, then the relevant transmitter is instructed to reduce its transmit power. Likewise, if the estimated SIR is lower than the target SIR, the associated transmitter is instructed to increase its transmit power. If the MS is in soft handover, and therefore BS diversity combining is performed at the MS in the DL, then the transmit powers of the BSs are controlled independently. Hence, the MS may receive different power control commands from the BSs in its active basestation set (ABS). Thus, the MS only increases its transmit power if all of the BSs in the ABS instruct it to do so. However, if any one of the BSs in the ABS instructs the MS to decrease its power, then the MS will reduce its transmit power. This method ensures that the multiuser interference is kept to a minimum, since at least one BS has a sufficiently high quality link.
New call channel allocation requests were placed in a resource allocation queue for up to 5 s. If during this period a call was not
TABLE I SIMULATIONPARAMETERS
serviced, it was classed as blocked. The MSs moved freely, in random directions, at a speed of 3 mi/h within the simulation area, which consisted of 49 cells. This area was then converted to an infinite mesh of cells using the so-called cell wrap-around technique of [3]. The cell radius was 150 m. The call duration and intercall periods were Poisson distributed with the mean values shown in Table I. For our initial investigations, we have assumed that the BSs and MSs form a synchronous network in both UL and DL.
Furthermore, the BSs are assumed to be equipped with the MMSE-BDFE-based MUD [16], [19]. The post-despreading signal-to-interference-plus-noise ratios (SINRs) required by this MUD for obtaining the target bit error ratios (BERs) were determined with the aid of physical-layer simulations using a 4-QAM modulation scheme in conjunction with 1/2 rate turbo coding [20] and MUD [19], [21] over a COST 207 seven-path Bad Urban channel [15], [21]. Using this turbo-coded MUD-assisted transceiver and a spreading factor of 16, the post-despreading SINR required for maintaining the target BER of 1×10⁻³ was 8.0 dB. The BER corresponding to low-quality (LQ)
access was stipulated at5×10−3. This BER was exceeded for SINRs
below 7.0 dB. Furthermore, an LQ outage was declared when the BER of1×10−2 was exceeded, namely for SINRs below 6.6 dB. These
values can be seen along with the other system parameters in Table I. There are several performance metrics that can be used for quanti-fying the performance or quality of service provided by an MS cellular network. The following performance metrics have been widely used in the literature and were also advocated by Chuang [22]:
• new call blocking probabilityPB;
• call dropping or forced termination probabilityPFT. A call is
dropped when the low UL and DL SINR dips consecutively below the outage SINR, where the BER exceeds 1% a given number of times;
• probability of an LQ accessPlowquantifies the chances of either
the UL or DL signal quality being sufficiently poor, which results in an LQ access, where the BER exceeds 0.5%;
• probability of outagePoutis defined as the probability that the
SINR is below the value at which the call is deemed to be in outage.
• Grade-Of-Service (GOS) was defined by Cheng and Chuang [22] as
GOS=P{unsuccessful or LQ call accesses}
=P{call is blocked}+P{call is admitted}
×P{low signal quality and call is admitted}
=PB+ (1−PB)Plow. (1)
In order to determine the number of users that may be supported with adequate call quality by the network, we have defined a conser-vative and lenient scenario that is formed from a combination of the performance metrics, as follows [23]:
• Conservative scenario
PB ≤3%, PFT≤1%, Plow≤1%, and GOS≤4%. (2)
• Lenient scenario
PB ≤5%, PFT≤1%, Plow≤2%, and GOS≤6%. (3)
As argued above, employing relative received pilot power-based han-dover thresholds is important in realistic propagation environments ex-posed to shadow fading. More explicitly, in contrast to using absolute handover thresholds, which were expressed in terms of dBm, i.e., with respect to 1 mW in [24], we also investigated the employment of a pair of relative handover thresholds. Accordingly, both the call acceptance thresholdTaccand the call dropping thresholdTdropwere expressed
in terms of decibels relative to the received pilot strength of the BSs in the ABS. The employment of these relative thresholds also caters to situations where the absolute pilot power may be too low for use in conjunction with fixed thresholds but nonetheless sufficiently high for reliable communications.
was proposed for employment in 3G systems [6]. The pilot to DL interference ratio, orEc/Io, may thus be calculated as [25]
Ec Io
=N Ppilot
cells
k=1 PkTk+N0
(4)
wherePkis the total transmit power of cellk,Tkis the transmission gain that includes antenna gain and path loss as well as shadowing, N0 is the thermal noise, and Ncells is the number of cells in the
network. The advantage of using such a scheme is that it is not the absolute measurement that is used but the ratio of the pilot power to the interference power. Thus, if fixed thresholds were used, a form of admission control may be employed for new calls if the interference level became too high. A further advantage of this technique is that it takes into account the time-varying nature of the interference level in a shadowed environment.
In [24], we concluded that it was beneficial to combine the em-ployment of the receivedEc/Io ratio and the relative soft handover thresholds, thus ensuring that variations in both the received pilot signal strength and the interference levels were monitored during the soft handover process.
Since, in [3] and [24], we identified an attractive handover algo-rithm, in this contribution, we focus our attention on the impact of adaptive modulation [15] and adaptive antenna arrays (AAAs) [3] on an UTRA-like network’s performance in a pedestrian scenario. Specif-ically, our investigations were conducted using the relative Ec/Io -based soft handover algorithm in conjunction with Tacc=−10 dB
andTdrop=−18dB using a spreading factor of 16. Given that the
chip rate of UTRA is 3.84 Mchips/s, this spreading factor corresponds to a channel data rate of3.84×106/16 = 240kb/s. Applying 1/2 rate
error correction coding would result in an effective data throughput of 120 kb/s, whereas utilizing a 2/3 rate error correction code would provide a useful throughput of 160 kb/s. Again, a cell radius of 150 m was assumed, and a pedestrian walking velocity of 3 mi/h was used, while the remaining system characteristics—including the power con-trol scheme, the orthogonal variable spreading factor (OVSF) code allocation algorithm [5], and the MUD [16]—were identical to those used in [24], which are also summarized in Table I. The average call duration and intercall duration are 60 and 300 s, which result in maximum 0.2 Erlang/user traffic during the busy hour. The UTRA system’s bandwidth is 5 MHz, the SF is 16, and, given the cell radius of 150 m as well as the 49-cell simulation area, theErlangcapacity is computed by recording all the users’ call durations and dividing it by the total duration of the time interval over which the statistics were collected while satisfying the network quality constraints of (2).
III. ADAPTIVEANTENNA-ASSISTEDNETWORKPERFORMANCE
[image:3.594.317.533.65.229.2]In our previous investigations employing AAAs at the BS [23], we observed quite significant performance gains as a direct result of the interference rejection capabilities of the AAAs invoked. Since the CDMA-based network considered here has a frequency reuse of 1, the levels of cochannel interference are significantly higher than in [23], and hence, the adaptive antennas may be able to null the interference more effectively. On the other hand, the high number of interference sources may limit the achievable interference rejection. It is unrealistic to null a high number of users with the aid of beamforming, even if the BS is capable of accommodating a high number of array elements. However, given anN-element beamformer, the benefit of beamform-ing is that it is capable of nullbeamform-ing up to(N−1)dominant interferers, while the low-power users essentially contribute an increased amount of noise. Furthermore, it was shown in [26] and [27] that a family of sophisticated beamformers referred to as minimum BER schemes or
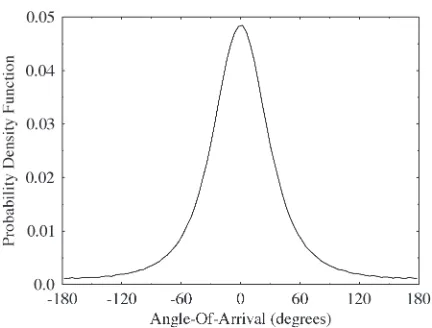
Fig. 1. PDF of of-arrival of the multipath rays centered about the angle-of-arrival of the line-of-sight path.
the so-called radial-basis-function-aided beamformers [28] are capable of nulling up to twice the number of users in comparison to the number of antenna elements.
In order to render the simulations realistic, we used two multipath rays in addition to the line-of-sight ray, each having a third of the power of the direct path. The angle-of-arrival of each multipath ray was determined using the so-called geometrically based single-bounce elliptical model (GBSBEM)1 of [30] and [31] with the parameters
chosen such that the multipath rays had one-third of the received power of the direct ray. The probability density function (pdf) of the angle-of-arrival distribution used in the simulations generated using GBSBEM is shown in Fig. 1. It was assumed that the multipath rays arrived with no time delay relative to the line-of-sight (LOS) path. However, in a practical system, a space–time equalizer [32], [33] would be required to prevent the nulling of the delayed paths.
The network performance results were obtained using two- and four-element AAAs both in the absence of shadow fading and in the presence of 0.5- and 1.0-Hz frequency shadow fading exhibiting a standard deviation of 3 dB. The adaptive beamforming algorithm used was the sample matrix inversion (SMI) algorithm [3]. Below, the specific adaptive beamforming implementation used for calculating the AAA weights in the CDMA-based network studied here is briefly highlighted as follows [23].
Specifically, one of the eight possible 8-bit binary phaseshift keying (BPSK) reference signals was used for identifying the desired user, and the remaining interfering users were assigned the other seven 8-bit reference signals. The received signal’s autocorrelation matrix was then calculated, and from the knowledge of the desired user’s reference signal, the receiver’s optimal antenna array weights were determined with the aid of the SMI algorithm [3]. Since this imple-mentation of the algorithm only calculated the BS receiver’s antenna array weights, i.e., the antenna array weights used by the BS in the UL, these weights may not be suitable for use in the DL when independent UL/DL shadow fading is experienced. Hence, investigations were con-ducted in two specific scenarios, namely where the UL and DL AAA weights were identical and when they were separately determined for UL and DL.
1The authors are grateful to the anonymous reviewer for the following
TABLE II
MAXIMUMMEANCARRIEDTRAFFIC ANDMAXIMUMNUMBER OFMS USERSTHATCANBESUPPORTED BY THENETWORKWHILEMEETING THE
CONSERVATIVEQUALITYCONSTRAINTS. THECARRIEDTRAFFICISEXPRESSED INTERMS OFNORMALIZEDERLANGS(Erlang/km2/MHz)FOR THE
[image:4.594.61.336.112.531.2] [image:4.594.57.279.277.521.2]NETWORKDESCRIBED INTABLEI BOTHWITH ANDWITHOUTBEAMFORMING(ASWELL ASWITH ANDWITHOUTINDEPENDENTUL/DL BEAMFORMING),ANDWITH ANDWITHOUTSHADOWFADINGHAVING ASTANDARDDEVIATION OF3 dBFORSF= 16
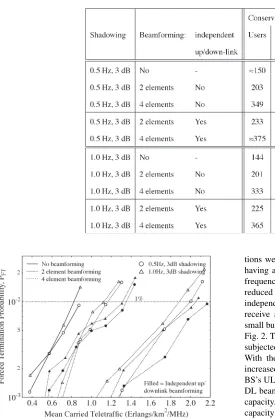
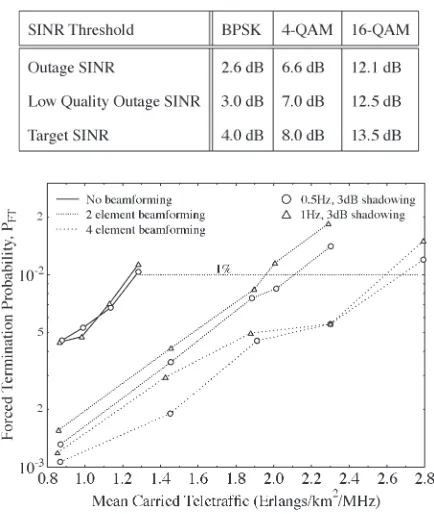
Fig. 2. Call dropping probability versus mean carried traffic of a CDMA-based cellular network using the relative receivedEc/Io-based soft handover thresholds with and without beamforming and with shadowing having a stan-dard deviation of 3 dB for SF= 16.
The two separate UL and DL AAA weight calculation scenarios al-lowed us to determine the potential extra performance gain that may be achieved by separately calculating the AAA weights to be used in DL. The AAA weights were recalculated for every power control step, i.e., 15 times per UTRA data frame, due to the potential significant changes in terms of the desired signal and interference powers that may occur during one UTRA frame as a result of the maximum possible 15-dB change in power transmitted by each user. The performance of both of these scenarios will be characterized in Table II during our further discourse.
The impact of AAAs in a propagation environment subjected to shadow fading was then investigated. The associated call dropping performance is shown in Fig. 2, which illustrates the substantial network capacity gains achieved with the aid of both two- and four-element AAAs under shadow fading propagation conditions.
Simula-tions were conducted in conjunction with log-normal shadow fading having a standard deviation of 3 dB and with maximum shadowing frequencies of 0.5 and 1.0 Hz. As expected, the network capacity was reduced at higher shadow fading frequency. The effect of performing independent UL and DL beamforming, as opposed to using the BS’s receive antenna array weights in the DL, was also studied, and a small but significant call dropping probability reduction can be seen in Fig. 2. The network supported just over 150 users and 144 users when subjected to 0.5- and 1.0-Hz frequency shadow fading, respectively. With the application of two-element AAAs, these capacities were increased by 35% and 40% to 203 and 201 users when reusing the BS’s UL receiver weights on the DL. Performing independent UL and DL beamforming resulted in a further 13% increase of the network’s capacity. The implementation of four-element AAAs led to a network capacity of 349 users at a 0.5-Hz shadowing frequency and 333 users at a 1.0-Hz shadowing frequency. This corresponded to relative gains of 133% and 131% over the capacity provided without beamforming. Invoking independent UL and DL beamforming provided another 7% and 10% boost of the network capacity for the 0.5- and 1.0-Hz frequency shadowing environments, respectively, which give final network capacities of just over 375 and 365 users.
Similar trends were observed regarding the probability of LQ outage to those found in nonshadowing scenarios. However, the trend was much more prevalent under shadowing, due to the higher variation of the received signal strengths, as a result of shadow fading, as shown in Fig. 3. The figure indicates that the trend is also evident when using two-element AAAs in conjunction with shadow fading. As expected, the performance deteriorated as the number of antenna elements increased and when the maximum shadow fading frequency was increased from 0.5 to 1.0 Hz. It should be noted, however, that the probability of LQ access always remained below the 1% constraint of the conservative scenario, and the call dropping probability was considerably reduced by the AAAs.
Fig. 3. Probability of LQ access versus mean carried traffic of a CDMA-based cellular network using the relative receivedEc/Io-based soft handover thresh-olds with and without beamforming and with shadowing having a standard deviation of 3 dB for SF= 16.
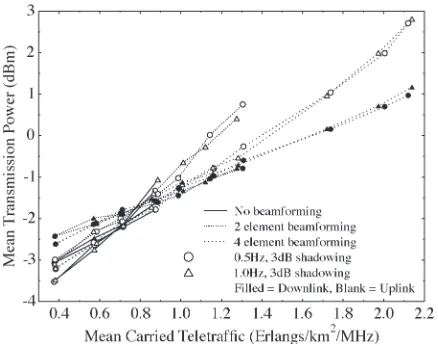
Fig. 4. Mean transmission power versus mean carried traffic of a CDMA-based cellular network using the relative receivedEc/Io-based soft handover thresholds with and without beamforming and shadowing having a standard deviation of 3 dB for SF= 16.
some reduction in the MSs’ mean transmission power. The mean transmission powers required when using independent UL and DL beamforming are not explicitly shown but were slightly less than those presented here, with a mean reduction of about 0.4 dB.
A summary of the maximum achievable network capacities both with and without shadowing, which employs beamforming using two-and four-element arrays, is given in Table II, along with the teletraffic carried and the mean MS and BS transmission powers required. In the next section, we will show the benefits of employing adaptive modulation [15].
IV. PERFORMANCE OFADAPTIVEARRAYS ANDADAPTIVE MODULATION IN AHIGH-DATA-RATE
PEDESTRIANENVIRONMENT
In this section, we build upon the results presented in the previous section by applying AQAM techniques [15]. There are two main objectives when employing AQAM, namely counteracting the effects of time-variant channel quality fluctuations and the effects of the time-variant interference load imposed by the time-variant number of
variable-rate users supported.2The various scenarios and channel
con-ditions investigated were identical to those of the previous section ex-cept for the application of AQAM [15]. Since, in the previous section, an increased network capacity was achieved due to using independent UL and DL beamforming, this procedure was invoked in these sim-ulations. AQAM involves the selection of the appropriate modulation mode in order to maximize the achievable data throughput over a chan-nel while minimizing the BER. More explicitly, the philosophy behind AQAM is the most appropriate selection of a modulation mode accord-ing to the instantaneous radio channel quality experienced [15], [34]. Therefore, if the SINR of the channel is high, then a high-order modu-lation mode may be employed, thus exploiting the temporal fluctuation of the radio channel’s quality. Similarly, if the channel is of LQ, ex-hibiting a low SINR, a high-order modulation mode would result in an unacceptably high BER or frame error rate (FER), and hence, a more robust but lower throughput modulation mode would be employed. Therefore, AQAM combats the effects of time-variant channel quality while also attempting to maximize the achieved data throughput and maintaining a given BER or FER. In the investigations conducted, the modulation modes of the UL and DL were determined independently, thus taking advantage of the lower levels of cochannel interference on the UL or of the potentially higher transmit power of the BSs.
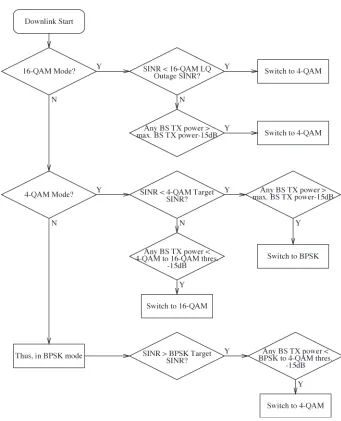
The particular implementation of AQAM used in these investiga-tions is illustrated in Fig. 5. This figure describes the algorithm in the context of the DL, but the same implementation was also used in the UL. The first step in the process was to establish the current modulation mode. If the user was invoking 16-QAM, and the SINR was found to be below the LQ outage SINR threshold after the completion of power control iterations, then the modulation mode for the next data frame was 4-QAM. Alternatively, if the SINR was above the LQ outage SINR threshold, but any of the BSs in the ABS was using a transmit power within 15 dB of the maximum transmit power, then the 4-QAM modulation mode was selected. This transmit power “headroom” was introduced in order to provide a measure of protection, since if the interference conditions degraded, then at least 15 dB of increased transmit power would be available in order to mitigate the consequences of the SINR reduction experienced.
A similar procedure was invoked when switching to other legitimate AQAM modes from the 4-QAM mode. If the SINR was below the 4-QAM target SINR and any one of the BSs in the ABS was within 15 dB (the maximum possible power change during a 15-slot UTRA data frame) of the maximum transmit power, then the BPSK modu-lation mode was employed for the next data frame. However, if the SINR exceeded the 4-QAM target SINR and there would be 15 dB of headroom in the transmit power budget in excess of the extra transmit power required for switching from 4-QAM to 16-QAM, then the 16-QAM modulation mode was invoked.
Finally, when in BPSK mode, the 4-QAM modulation mode was selected if the SINR exceeded the BPSK target SINR and if the transmit power of any of the BSs in the ABS was less than the power required for transmitting reliably using 4-QAM while being at least 15 dB below the maximum transmit power. The algorithm was acti-vated at the end of each 15-slot UTRA data frame after the power control algorithm had performed its 15 iterations per data frame, and thus, the AQAM mode selection was performed on an UTRA transmission frame-by-frame basis. Similarly, when changing from a lower order modulation mode to a higher order mode, the lower order mode was retained for an extra frame duration in order to ramp up the transmit power to the required level, as shown in Fig. 6(a). Conversely,
2Unless otherwise stated, for the sake of simplicity, we will refer to
[image:5.594.53.272.295.468.2]Fig. 5. AQAM mode switching algorithm used in the DL of the CDMA-based cellular network.
Fig. 6. Power ramping requirements while switching modulation modes. (a) Ramping up the transmit power while remaining in the lower order modulation mode. (b) Ramping down the transmit power while switching to the lower order modulation mode.
when changing from a higher order modulation mode to a lower order modulation mode, the lower order modulation mode was employed while ramping the power down in order to avoid excessive outages in the higher order modulation mode due to the reduction of the transmit power, as illustrated in Fig. 6(b).
Table III shows the BPSK, 4-QAM, and 16-QAM reconfiguration SINR thresholds used in the simulations. The BPSK SINR thresholds were 4 dB lower than those necessary when using 4-QAM, while the
TABLE III
TARGETSINR, LQ OUTAGESINR,ANDOUTAGESINR THRESHOLDS
USED FORBPSK, 4-QAM,AND16-QAM MODULATION
[image:7.594.53.270.106.363.2]MODES OF THEADAPTIVEMODEM
Fig. 7. Call dropping probability versus mean carried traffic of a CDMA-based cellular network using the relative receivedEc/Io-based soft handover thresholds both with and without beamforming in conjunction with AQAM as well as with shadowing having a standard deviation of 3 dB for SF= 16. See Fig. 2 for corresponding results without adaptive modulation.
outages due to sudden dramatic channel-induced variations in the SINR levels.
Fig. 7 shows the significant reduction in the probability of a dropped call that is achieved by employing AAAs in conjunction with AQAM in a log-normal shadow-faded environment. The figure demonstrates that, even with the aid of a two-element AAA and its limited degrees of freedom, a substantial call dropping probability reduction was achieved. The performance benefit of increasing the array’s degrees of freedom, which is achieved by increasing the number of antenna elements, becomes explicit from the figure, which results in a further call dropping probability reduction. Simulations were conducted in conjunction with log-normal shadow fading having a standard devi-ation of 3 dB and maximum shadowing frequencies of 0.5 and 1.0 Hz. As expected, the call dropping probability was generally higher at higher shadow fading frequency, as demonstrated in Fig. 7. The network was found to support 223 users, which correspond to a traffic load of 1.27 Erlang/km2/MHz, when subjected to 0.5-Hz frequency shadow fading. The capacity of the network was reduced to 218 users, or 1.24 Erlang/km2/MHz, upon the increase of the maximum shadow
fading frequency to 1.0 Hz. On employing two-element AAAs, the network capacity increased by 64% to 366 users, or to an equivalent traffic load of 2.11 Erlang/km2/MHz, when subjected to 0.5-Hz fre-quency shadow fading. When the maximum shadow fading frefre-quency was raised to 1.0 Hz, the number of users supported by the network was 341, which carries a traffic load of 1.98 Erlang/km2/MHz and
represents an increase of 56% in comparison to the network without AAAs. Increasing the number of antenna elements to four while imposing shadow fading with a maximum frequency of 0.5 Hz resulted in a network capacity of 2.68 Erlang/km2/MHz or 476 users, which
corresponds to a gain of an extra 30% with respect to the network
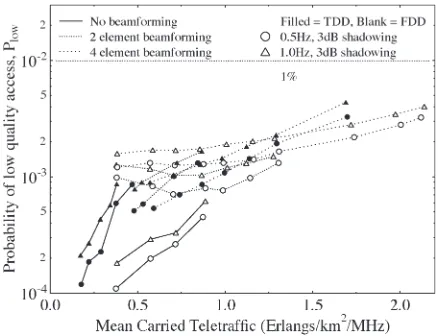
Fig. 8. Probability of LQ access versus mean carried traffic of a CDMA-based cellular network using the relative receivedEc/Io-based soft handover thresholds both with and without beamforming in conjunction with AQAM as well as with shadowing having a standard deviation of 3 dB for SF= 16. See Fig. 3 for corresponding results without adaptive modulation.
employing two-element arrays and of 113% in comparison to the network employing no AAAs. In conjunction with a maximum shadow fading frequency of 1.0 Hz, the network capacity was 460 users or 2.59 Erlang/km2/MHz, which represented an increase of 35% with respect to the network invoking two-element antenna arrays or 111% relative to the identical network without AAAs.
The probability of LQ outage, which is presented in Fig. 8, did not benefit from the application of AAAs or from the employment of AQAM. Fig. 3 depicts the probability of LQ outage without AQAM, and upon comparing these results with those obtained in conjunction with AQAM in Fig. 8, the performance degradation due to AQAM can be explicitly seen. However, the increase in the probability of LQ access can be attributed to the employment of less robust, but higher throughput, higher order modulation modes invoked by the AQAM scheme. Hence, under given propagation conditions and using the fixed 4-QAM modulation mode, an LQ outage may not occur, yet when using AQAM and a higher-order modulation mode, the same propagation conditions may inflict an LQ outage. This phenomenon is further exacerbated by the AAAs, where the addition of a new source of interference, which is constituted by a user initiating a new call, results in an abrupt change in the gain of the antenna in the direction of the desired user. This, in turn, leads to LQ outages, which are more likely to occur for prolonged periods of time, when using a higher order modulation mode. Again, increasing the number of antenna elements from two to four results in an increased probability of an LQ outage due to the sharper antenna directivity. This results in a higher sensitivity to changes in the interference incident upon it.
Fig. 9. Mean transmission power versus mean carried traffic of a CDMA-based cellular network using the relative receivedEc/Io-based soft handover thresholds both with and without beamforming in conjunction with AQAM as well as with shadowing having a standard deviation of 3 dB for SF= 16. See Fig. 4 for corresponding results without adaptive modulation.
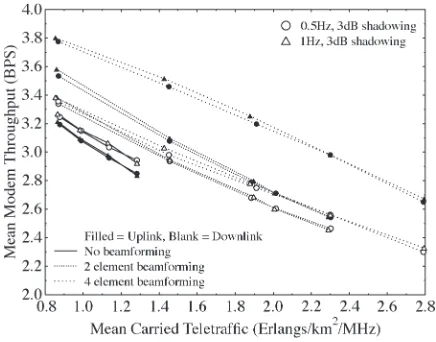
Fig. 10. Mean modem throughput versus mean carried traffic of a CDMA-based cellular network using the relative receivedEc/Io-based soft handover thresholds both with and without beamforming in conjunction with AQAM as well as with shadowing having a standard deviation of 3 dB for SF= 16.
more significant at higher traffic loads. In the DL scenario, however, increasing the number of AAA elements led to an increased mean DL transmission power, with the benefit of a substantially improved mean DL modem throughput. This suggests that there was some interaction between the AAAs, the AQAM mode switching algorithm, and the maximal ratio combining performed at the MSs. By contrast, simple switched diversity was performed by the BSs on the UL, thus avoiding such a situation. However, the increase in the mean DL transmission power resulted in a much more substantial increase in the mean DL modem throughput, especially with the advent of the four-element antenna arrays, which exhibited an approximately 0.5 bit per symbol (BPS) throughput gain over the two-element arrays for similar high-traffic loads, as shown in Fig. 10.
A summary of the maximum user capacities of the networks con-sidered in this section both with and without employing beamforming using two- and four-element arrays is given in Table IV. The teletraffic carried, the mean MS and BS transmission powers required, and the mean UL and DL modem data throughputs achieved are also shown in Table IV. Similarly, the lower bounds of the maximum network capacities obtained under identical scenarios in conjunction with a
spreading factor of 256, which lead to a bit rate of 15 kb/s and is suitable for speech rate users, are presented in Table V. The network capacity calculations were performed by scaling the number of users supported, as presented in Table IV, by the ratio of their spreading factors, i.e., by256/16 = 16.
V. ADAPTIVEARRAYS ANDADAPTIVE MODULATION INTDD/CDMA
TDD is attractive in terms of facilitating the allocation of asym-metric or uneven resources to the UL and DL, which supports a more efficient exploitation of the frequency bands available. However, the associated interference scenario is markedly different from that experienced in FDD, as shown in Fig. 11. Mobile to mobile (MS-to-MS) interference occurs in the situation displayed in Fig. 11 if MS1is
transmitting while MS0 is receiving in a specific timeslot mapped to
the same carrier frequency in an adjacent cell. The MS-to-MS inter-ference cannot be completely avoided by network planning, since the geographic location of MSs cannot be controlled. TDD/CDMA is also prone to BS-to-BS interference. In fact, as will be shown later, it is the most serious source of intercell interference in a TDD/CDMA cellular scenario. As seen in Fig. 11, if BS1is transmitting and BS0is receiving
at the same time in a given timeslot, BS-to-BS interference takes place provided that these BSs are in adjacent cells. The severity of the BS-to-BS interference depends heavily on the path loss between the two BSs; hence, it can be reduced with the aid of careful network planning. In [35], we analytically studied the achievable network performance of UTRA-like TDD/CDMA systems, where conventional fixed-mode modulation was assumed. By contrast, in [3], the performance of an UTRA-like FDD/CDMA system was quantified when supported by adaptive beam steering and adaptive modulation [15]. These per-formance improvements have approximately doubled the network capacity of the system.
Our current research is building on our previous findings recorded in the context of an UTRA-like FDD system [3], [36], where we found that invoking adaptive modulation and beam steering proved to be a powerful means of enhancing the capacity of FDD/CDMA. Hence, they are expected to be even more powerful in the context of TDD/CDMA, where the capacity of TDD/CDMA is poor as a consequence of the excessive BS-to-BS interference experienced.
[image:8.594.58.276.310.481.2]TABLE IV
MAXIMUMMEANCARRIEDTRAFFIC ANDMAXIMUMNUMBER OFMS USERSTHATCANBESUPPORTED BY THENETWORKWHILEMEETING THE
CONSERVATIVEQUALITYCONSTRAINTS. THECARRIEDTRAFFICISEXPRESSED INTERMS OFNORMALIZEDERLANGS(Erlang/km2/MHz)FOR THENETWORKDESCRIBED INTABLEI BOTHWITH ANDWITHOUTBEAMFORMING(USINGINDEPENDENTUL/DL BEAMFORMING)
INCONJUNCTIONWITHSHADOWFADINGHAVING ASTANDARDDEVIATION OF3 dB WHILEEMPLOYING
ADAPTIVEMODULATIONTECHNIQUES FORSF= 16
TABLE V
LOWERBOUNDESTIMATE OF THEMAXIMUMMEANCARRIEDTRAFFIC ANDMAXIMUMNUMBER OFMS SPEECHRATEUSERSTHATCANBE
SUPPORTED BY THENETWORKWHILEMEETING THECONSERVATIVE
QUALITYCONSTRAINTS FOR THENETWORKDESCRIBED INTABLEI BOTHWITH ANDWITHOUTBEAMFORMING(USINGINDEPENDENT
UL/DL BEAMFORMING)INCONJUNCTIONWITHSHADOWFADING
HAVING ASTANDARDDEVIATION OF3 dB WHILEEMPLOYING
AQAMANDSF= 256. THENUMBER OFUSERSSUPPORTED INCONJUNCTIONWITH ASPREADINGFACTOR OF256 WAS
CALCULATED BYMULTIPLYING THECAPACITIES
OBTAINED INTABLEIVBY256/16 = 16
data frame, owing to the potential significant changes in terms of the desired signal and interference powers that may occur during one UTRA frame as a result of the maximum possible 15-dB change in the power transmitted by each user.
The impact of AAAs recorded in a propagation environment sub-jected to shadow fading was then investigated. The associated call dropping performance is shown in Fig. 12, which illustrates the substantial network capacity gains achieved with the aid of both two-and four-element AAAs under shadow fading propagation conditions. As expected, the network capacity was reduced at higher shadow fading frequency. Without employing AAAs, the network supported just over 71 and 62 users when subjected to 0.5- and 1.0-Hz frequency shadow fading, respectively. With the application of two-element AAAs, these capacities increased by 111% and 113% to 151 and 131 users, respectively. The employment of four-element AAAs led to a network capacity of 245 users at a 0.5-Hz shadowing frequency
and 234 users at a 1.0-Hz shadowing frequency. This corresponded to relative gains of 62% and 78% over the capacity provided with the aid of two-element AAAs.
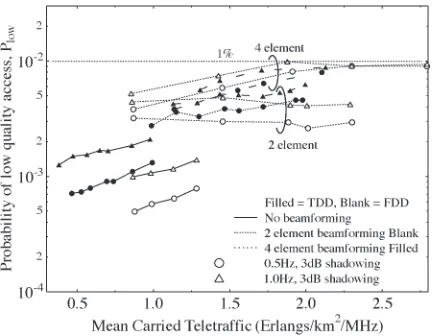
The probability of LQ access performance is depicted in Fig. 13. As expected, a givenPlowvalue was associated with a higher traffic load
as the number of antenna elements increased. When the maximum shadow fading frequency was increased from 0.5 to 1.0 Hz, Plow
also increased. The probability of LQ seen in Fig. 13 is similar to the scenarios employing AAAs in UTRA TDD and FDD CDMA systems. It should be noted however that the probability of LQ access always remained below the 1% constraint of the conservative scenario under the scenarios studied, and the call dropping probability was considerably reduced by the AAAs, as shown in Fig. 14.
More explicitly, Fig. 14 shows the significant reduction in the probability of a dropped call, which is achieved by employing AAAs in conjunction with adaptive modulation [3], [15] in a log-normal shadow-faded environment. The figure demonstrates that, even with the aid of a two-element AAA, a substantial call dropping probabil-ity reduction was achieved. The single-antenna-based network was found to support 153 users, which correspond to a traffic load of 0.875 Erlang/km2/MHz, when subjected to 0.5-Hz frequency shadow
fading. The capacity of the single-antenna-aided network was slightly reduced to 152 users, or 0.874 Erlang/km2/MHz, upon increasing
the maximum shadow fading frequency to 1.0 Hz. Upon employ-ing two-element AAAs, the network capacity increased by 109% to 320 users, or to an equivalent traffic load of 1.834 Erlang/km2/MHz,
when subjected to 0.5-Hz frequency shadow fading. When the maxi-mum shadow fading frequency was increased to 1.0 Hz, the number of users supported by the network was 307, or 1.82 Erlang/km2/MHz,
which represent an increase of 102% in comparison to the network refraining from using AAAs. It is seen in Fig. 14 that the forced termination probability of the UTRA-like TDD/CDMA scenarios is close to that of the FDD/CDMA scenarios when employing AAAs in conjunction with adaptive modulation.
Fig. 11. Intercell interference.
Fig. 12. Call dropping probability versus mean carried traffic of the UTRA-like TDD/CDMA-based cellular network both with as well as without beam-forming and with shadowing for SF= 16.
[image:10.594.322.540.335.504.2]Fig. 13. Probability of LQ access versus mean carried traffic of the UTRA-like TDD/CDMA-based cellular network both with and without beamforming and with shadowing for SF= 16.
Fig. 14. Call dropping probability versus mean carried traffic of the UTRA-like TDD/CDMA-based cellular network both with and without beamforming in conjunction with AQAM as well as with shadowing having a standard deviation of 3 dB for SF= 16.
to the employment of less robust but higher throughput higher or-der modulation modes invoked by the adaptive modulation scheme. Hence, under given propagation conditions and using the interference-resilient fixed 4-QAM modulation mode, as in Fig. 13, an LQ outage may not occur. By contrast, when using adaptive modulation invoking a less resilient but higher throughput and higher order modulation mode, the same propagation conditions may inflict an LQ outage.
VI. SUMMARY ANDCONCLUSION
[image:10.594.58.279.553.721.2]Fig. 15. Probability of LQ access versus mean carried traffic of the UTRA TDD/CDMA-based cellular network both with and without beamforming in conjunction with AQAM as well as with shadowing having a standard deviation of 3 dB for SF= 16.
facilitated the doubling of the network’s capacity in some of the investigated scenarios. Furthermore, invoking AQAM increased both the average throughput and the robustness of the network, since a sudden channel quality reduction did not result in dropping the call supported. Rather, it activated a lower-throughput modulation mode.
The network performance of UTRA FDD and TDD systems was also compared. It was shown that the employment of adaptive arrays in conjunction with AQAM limited the detrimental effects of cochannel interference on the TDD system and resulted in performance improve-ments in terms of both the achievable call quality and the system’s capacity. Further research will quantify the design tradeoffs associated with the joint employment of AQAM and space–time coding as well as their impact on the network’s capacity.
REFERENCES
[1] M. Zeng, A. Annamalai, and V. K. Bhargava, “Recent advances in cellular wireless communications,”IEEE Commun. Mag., vol. 37, no. 9, pp. 128–138, Sep. 1999.
[2] P. Chaudhury, W. Mohr, and S. Onoe, “The 3GPP proposal for IMT-2000,”IEEE Commun. Mag., vol. 37, no. 12, pp. 72–81, Dec. 1999. [3] J. S. Blogh and L. Hanzo,Third-Generation Systems and Intelligent Wire-less Networking—Smart Antennas and Adaptive Modulation. Hoboken, NJ: Wiley, Jan. 2002. [Online]. Available: http://www-mobile.ecs. soton.ac.uk
[4] L. Hanzo, P. Cherriman, and J. Streit,Wireless Video Communications: Second to Third Generation and Beyond. Piscataway, NJ: IEEE Press, 2001. [Online]. Available: http://www-mobile.ecs.soton.ac.uk
[5] R. Steele and L. Hanzo, Mobile Radio Communications, 2nd ed. Piscataway, NJ: IEEE Press, 1999. [Online]. Available: http://www-mobile.ecs.soton.ac.uk
[6] H. Holma and A. Toskala, Eds.,WCDMA for UMTS: Radio Access for Third Generation Mobile Communications. Hoboken, NJ: Wiley, 2000. [7] J. Laiho-Steffens, A. Wacker, and P. Aikio, “The impact of the radio net-work planning and site configuration on the WCDMA netnet-work capacity and quality of service,” inProc. IEEE Veh. Technol. Conf., Tokyo, Japan, 2000, pp. 1006–1010.
[8] K. Hiltunen and R. de Bernardi, “WCDMA DL capacity estimation,” in Proc. IEEE Veh. Technol. Conf., Tokyo, Japan, 2000, pp. 992–996. [9] K. Sipilä, Z.-C. Honkasalo, J. Laiho-Steffens, and A. Wacker, “Estimation
of capacity and required transmission power of WCDMA DL based on a DL pole equation,” inProc. IEEE Veh. Technol. Conf., Tokyo, Japan, 2000, pp. 1002–1005.
[10] M. Casoni and M. L. Merani, “Erlang capacity of a TDD-TD/CDMA ar-chitecture supporting heterogeneous traffic,”IEEE Commun. Lett., vol. 5, no. 12, pp. 468–470, Dec. 2001.
[11] T. Rouse, S. McLaughlin, and I. Band, “Congestion-based routing strate-gies in multihop TDD-CDMA networks,”IEEE J. Sel. Areas Commun., vol. 23, no. 3, pp. 668–681, Mar. 2005.
[12] W. Cooper, J. R. Zeidler, and R. R. Bitmead, “Modeling dynamic channel-allocation algorithms in multi-BS TDD wireless networks with Internet-based traffic,”IEEE Trans. Veh. Technol., vol. 53, no. 3, pp. 783–804, May 2004.
[13] X. Wang, “An FDD wideband CDMA MAC protocol with minimum-power allocation and GPS-scheduling for wireless wide area multime-dia networks,”IEEE Trans. Mobile Comput., vol. 4, no. 1, pp. 16–28, Jan./Feb. 2005.
[14] J. O. Carnero, K. I. Pedersen, and P. E. Mogensen, “Capacity gain of an UL-synchronous WCDMA system under channelization code con-straints,”IEEE Trans. Veh. Technol., vol. 53, no. 4, pp. 982–991, Jul. 2004. [15] L. Hanzo, C. H. Wong, and M. S. Yee,Adaptive Wireless Transceivers: Turbo-Coded, Turbo-Equalised and Space–Time Coded TDMA, CDMA and OFDM Systems. Hoboken, NJ: Wiley, 2002. [Online]. Available: http://www-mobile.ecs.soton.ac.uk
[16] S. Verdú, Multiuser Detection. Cambridge, U.K.: Cambridge Univ. Press, 1998.
[17] M. Vollmer, M. Haardt, and J. Gotze, “Comparative study of joint-detection techniques for TD-CDMA based mobile radio systems,”IEEE J. Sel. Areas Commun., vol. 19, no. 8, pp. 461–1475, Aug. 2001. [18] L. Wang and A. H. Aghvami, “Optimal power allocation based on QoS
balance for a multi-rate packet CDMA system with multi-media traffic,” inProc. Globecom, Rio de Janeiro, Brazil, Dec. 1999, pp. 2778–2782. [19] L. Hanzo, L. L. Yang, E. L. Kuan, and K. Yen,Single- and Multi-Carrier
DS-CDMA. Hoboken, NJ: Wiley, 2003.
[20] L. Hanzo, T. H. Liew, and B. L. Yeap,Turbo Coding, Turbo Equalisation and Space–Time Coding. Hoboken, NJ: Wiley, 2002.
[21] E. L. Kuan and L. Hanzo, “Burst-by-burst adaptive multiuser detection CDMA: A framework for existing and future wireless standards,”Proc. IEEE, vol. 91, no. 2, pp. 275–302, Feb. 2003.
[22] M. M. L. Cheng and J. C. I. Chuang, “Performance evaluation of distributed measurement-based dynamic channel assignment in local wireless communications,”IEEE J. Sel. Areas Commun., vol. 14, no. 4, pp. 698–710, May 1996.
[23] J. S. Blogh, P. J. Cherriman, and L. Hanzo, “Dynamic channel allocation techniques using adaptive modulation and adaptive antennas,”IEEE J. Sel. Areas Commun., vol. 19, no. 2, pp. 305–311, Feb. 2001.
[24] J. S. Blogh and L. Hanzo, “The network performance of multi-rate FDD-mode UMTS,” inProc. VTC—Spring, Rhodes, Greece, Jun. 6–9, 2001, pp. 2455–2459.
[25] R. Owen, P. Jones, S. Dehgan, and D. Lister, “UL WCDMA capacity and range as a function of inter-to-intra cell interference: Theory and practice,” inProc. IEEE Veh. Technol. Conf., Tokyo, Japan, 2000, vol. 1, pp. 298–303.
[26] A. Wolfgang, N. N. Ahmad, S. Chen, and L. Hanzo, “Genetic algo-rithm assisted minimum bit error rate beamforming,” inProc. IEEE Veh. Technol. Conf., 2004, vol. 1, pp. 142–146.
[27] S. Chen, L. Hanzo, and A. Wolfgang, “Kernel-based nonlinear beam-forming construction using orthogonal forward selection with Fisher ratio class separability measure,”IEEE Signal Process. Lett., vol. 11, no. 5, pp. 478–481, May 2004.
[28] A. Wolfgang, S. Chen, and L. Hanzo, “Radial basis function network assisted space–time equalization for dispersive fading environments,” Electron. Lett., vol. 40, no. 16, pp. 1006–1008, Aug. 5, 2004.
[29] F. Alam, D. Shim, and B. D. Woerner, “Comparison of low complexity algorithms for MSNR beamforming,” inProc. IEEE 55th VTC—Spring, 2002, vol. 4, pp. 1776–1780.
[30] J. Liberti and T. Rappaport, “A geometrically based model for line-of-sight multipath radio channels,” inProc. VTC, 1996, pp. 844–848. [31] R. Ertel, P. Cardieri, K. Sowerby, T. Rappaport, and J. Reed, “Overview of
spatial channel models for antenna array communications systems,”IEEE Pers. Commun., vol. 5, no. 1, pp. 10–22, Feb. 1998.
[32] R. Kohno, “Wireless communications: TDMA versus CDMA,” inSpatial and Temporal Communication Theory Using Software Antennas for Wire-less Communications. Norwell, MA: Kluwer, 1997, ch. 1, pp. 293–321. [33] Y. Ogawa and T. Ohgane, “Adaptive antennas for future mobile radio,”
IEICE Trans. Fundam., vol. E79-A, no. 7, pp. 961–967, Jul. 1996. [34] L. Hanzo, S. X. Ng, W. T. Webb, and T. Keller,Quadrature Amplitude
Modulation: From Basics to Adaptive Trellis-Coded, Turbo-Equalised and Space-Time Coded OFDM, CDMA and MC-CDMA Systems. Hoboken, NJ: Wiley, Sep. 2004.
[35] X. Wu, L. L. Yang, and L. Hanzo, “UL capacity investigations of TDD/CDMA,” in Proc. VTC—Spring, Birmingham, AL, May 2002, vol. 2, pp. 997–1001.