Sodium Line Guide Star Laser using Optical
Parametric Oscillator
Khu Tri Vu
A thesis submitted for the degree of Bachelor of Science with Honours at The Australian National University
Declaration
This thesis is an account of research undertaken between February 2003 and November 2003 at the Laser Physics Centre, Research School of Physical Sciences and Engineering, The Australian National University, Canberra, Australia.
Except where acknowledged in the customary manner, the material presented in this thesis is, to the best of my knowledge, original and has not been submitted in whole or part for a degree in any university.
Khu Tri Vu
14 November, 2003
Acknowledgements
There has been so much help from everyone who I know and have met during the course that I would like to thank them deeply. Although I am trying to name some people that I can think of at the moment of writing, there are many others who I may fail to mention. First of all I would like to say thank you to my supervisor, Prof. Barry Luther-Davies. He is the best experimentalist and supervisor I have ever met and worked with. He has given me a great deal of enthusiasm from the first moment he described the project to the last minute. He has been the most encouraging person, who always spent a great amount of time with me during the year. He was always there willing to answer and guide me through any aspect of the project. He was actively thinking ahead of all from the smallest thing to the most important.
I would like to thank all the other Honours students for being such a nice and supportive group. My special gratitude to Kristen Feher, Steward Wilson, Trudy Peaty and Tom Argue for being the closest friends. With them I have had great moments of sharing and laughing. I also greatly appreciate the effort made by Craig Savage for being a very supportive coordinator.
I would like also express my deep gratitude to all staff and students at the Laser Physics Centre for the welcoming and exciting moments and help they have provided during the year. Life at the Research School of Physical Science and Engineering at Australian National University has been very exciting. I would like to thanks all support staff for making it such an interesting and welcoming place.
I also would like to thank Australian National University for supporting me with the Honours Scholarship. I am grateful to the Physics Department, specially Allan Baxters, for letting me demonstrate a first year physics class which has brought not only some financial support, but more importantly a lot of fun.
Most important of all, this is a tribute to my parents who are always my love and encouragement even at a very far distance. I am so grateful for every single thing that they have done for me. They are always the motivation for every thing I have done in my life.
Finally I would like to thank my girlfriend, Uyen Nguyen, for being so patient and loving. My life is so much happier and more fulfilled with her presence in my heart.
Abstract
The aim of this project is to develop a novel, high average power source of highly coherent radiation at the 589nm sodium D2 resonance line for use in creating a laser guide star
for use with adaptive optics systems such as astronomical telescopes and satellite ranging. Adaptive optics is used to improve the resolution of ground base telescope by compensating the atmospheric turbulence. To achieve this it is necessary to measure and correct the distortions caused by the atmosphere on the beam. A laser guide star provides a beacon which combined with a wavefront sensor allows the effect of the atmosphere to be quantified and mechanical corrections made to the adaptive optics in the telescope to cancel those distortions.
Whilst laser guide stars have been demonstrated as effective in a number of astronom-ical observatories, at present there is no laser technology that dominates this application. This project will demonstrate a novel approach to the creation of high average power optical sources for guide star applications. The aim of the project is to build a prototype of high average power, synchronously pumped optical parametric oscillators pumped by novel high power solid state laser technology.
The Magnesium Oxide doped periodically poled Lithium Niobate was used as the nonlinear crystal for the 532nm pumped singly resonant parametric oscillator. The oscil-lator was pumped by 1.4W of 532nm light which was created from a 3.5W mode-locked Nd:YVO4 laser by a Lithium Triborate second harmonic generator. With a grating period
of 12.05µm, the signal at the wavelength of 594nm was obtained at 150oC. There was
unexpected green absorption of the crystal, which undermined the performance of the os-cillator. However, from the experimental results of a Potassium Titanyl Phosphate optical parametric oscillator, it was demonstrated that highly efficient parametric oscillator can be built despite the idler absorption.
Contents
Declaration iii
Acknowledgements v
Abstract vii
1 Introduction 3
1.1 Motivation . . . 3
1.2 Review of Laser Guide Star . . . 5
1.3 Optical Parametric Oscillators: An Approach . . . 7
1.4 Summary of the Thesis . . . 9
2 Chapter 2: Nonlinear Optics 11 2.1 Introduction to nonlinear optics . . . 11
2.1.1 Wave equation . . . 11
2.1.2 Nonlinear Susceptibilities . . . 12
2.1.3 Properties of the Nonlinear Susceptibility . . . 12
2.1.4 Contracted Notation d-coefficient and effective susceptibility . . . . 14
2.2 Second Harmonic Generation . . . 15
2.3 Wave-Mixing . . . 17
2.4 Parametric Amplification . . . 18
2.5 Phase Matching . . . 20
2.5.1 Angle Tuning . . . 21
2.5.2 Temperature Tuning . . . 22
2.5.3 Quasi Phase Matching . . . 23
3 Chapter 3: Optical Parametric Oscillator 25 3.1 Parametric Amplification with Gaussian Beam . . . 25
3.1.1 Focused Gaussian Beam (Near-Field) . . . 25
3.1.2 Optimised Confocal Near-Field Gaussian Beam . . . 26
3.1.3 Common Confocal Parameter Gaussian Beams . . . 27
3.1.4 Arbitrary Focused Gaussian Beams . . . 27
3.2 Optical Parametric Oscillator . . . 28
3.3 Singly Resonant Parametric Oscillator . . . 29
3.3.1 Threshold . . . 29
3.3.2 Efficiency . . . 29
3.4 Synchronously Pumped OPOs . . . 30
3.5 Parametric Oscillator with Idler Absorption . . . 32
3.6 Magnesium Oxide doped Periodically Poled Lithium Niobate . . . 33
3.6.1 Lithium Niobate . . . 33
3.6.2 MgO:Periodically Poled Lithium Niobate . . . 34
3.6.3 PPLN with Ionic-Nonlinearity Enhanced Parametric Gain . . . 36
x Contents
4 Chapter 4: Design of Guide Star Optical Parametric Oscillator 39
4.1 Overview . . . 39
4.2 Threshold Calculation . . . 40
4.3 Grating Period of MgO:PPLN for Guide Star OPO . . . 41
4.4 Cavity Configuration . . . 44
4.5 Mode Matching the Pump Beam . . . 44
5 Chapter 5: Potassium Titanyl Phosphate Optical Parametric Oscillator Experiment 49 5.1 KTP OPO Overview . . . 49
5.2 Laser Source . . . 49
5.3 Laser Amplifier . . . 50
5.4 KTP OPO . . . 52
5.4.1 KTP crystal . . . 52
5.4.2 Cavity Configuration and Pump Focusing . . . 52
5.5 Threshold Calculation . . . 53
5.6 KTP OPO Measurement and Results . . . 54
5.6.1 Threshold . . . 54
5.6.2 Efficiency . . . 54
5.6.3 Cavity Detuning . . . 55
5.6.4 Signal Bandwidth . . . 55
5.7 Implications to Guide Star OPO . . . 56
6 Chapter 6: Performance of Prototype Guide Star Optical Parametric Oscillator 59 6.1 Overview . . . 59
6.2 Second harmonic generation . . . 60
6.3 MgO:PPLN crystal . . . 60
6.4 Cavity Configuration and Pump focusing . . . 61
6.5 Threshold Calculation . . . 62
6.6 Performance of Guide Star Prototype . . . 62
7 Conclusion 65
List of Figures
1.1 A typical set up for adaptive system, the wavefront sensor provide a feed-back to the deformation mirror, which corrects the distorted wavefront. A guide star is needed to provide high enough intensity for the wavefront
sensor (Source: Gemini adaptive telescope) . . . 4
1.2 A comparison between normal telescope image and adaptive optics telescope image. This is the image of a binary star: on the left is without adaptive optics, on the right adaptive optics is used. (Source: Keck Observatory) . . 4
2.1 Second harmonic generation . . . 16
2.2 Wave-mixing process in a nonlinear medium . . . 17
2.3 Parametric amplification of the signal and idler in plane wave, non-depleted pump approximation . . . 19
2.4 The dependence of second harmonic intensity against phase mismatch as a sinc function of ∆kz . . . 20
2.5 Dispersion of the refractive indices of a negative uniaxial crystal. . . 21
2.6 Angle phase matching for second harmonic generation . . . 22
2.7 Poling of crystal in QPM. . . 23
3.1 A near-field Gaussian beam. The confocal parameter b is longer than the crystal length L . . . 26
3.2 Parametric gain reduction factor as a function of focusing parameter ξ of both pump and signal beams . . . 27
3.3 Variation of the SRO function hsm as a function of focusing parameter ξs =l/bs, with k=1.5 and two values ofξp =l/bp = 1, 5 . . . 28
3.4 Singly resonant parametric oscillator . . . 29
3.5 Conversion efficiency as a function of the number of times the pump power exceeds threshold for the SRO with Gaussian beam. . . 31
3.6 a) Output signal efficiency as a function of effective detuning time at various peak pump intensity and b)Output efficiency as a function of peak pump intensity at various normalised effective detuning times . . . 32
3.7 Transmission through a 1-mm x-cut Lithium Niobate crystal at 28o and 130o [1] . . . 33
3.8 Refractive index of undoped congruently grown Lithium Niobate as a func-tion of wavelength . . . 35
4.1 Schematic layout of the guide star optical parametric oscillator . . . 39
4.2 Schematic of a cavity of the guide star SROPO. . . 45
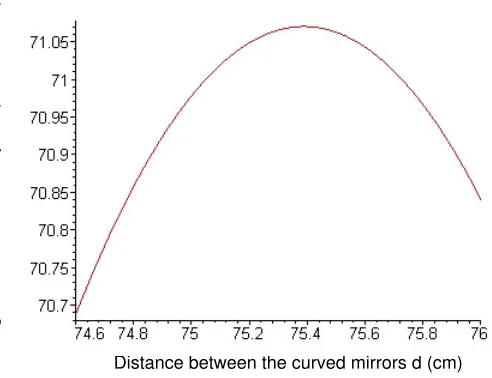
4.3 An equivalent model of the OPO cavity to calculate the beam parameters at crystal and mirrors . . . 45 4.4 Signal waist radius at the crystal as a function of two curved mirrors separation 46
xii LIST OF FIGURES
4.5 Signal waist radius at the end mirrors as a function of two curved mirrors
separation . . . 46
4.6 Schematic of pump beam focusing setup. A convergent lens is used to focus the pump beam to a suitable waist radii. The curved mirror of the cavity acts as a diverging lens . . . 47
4.7 Waist of the pump at the crystal using the convergent lens with f1=450mm as a function of the distance between the lens and the mirror . . . 47
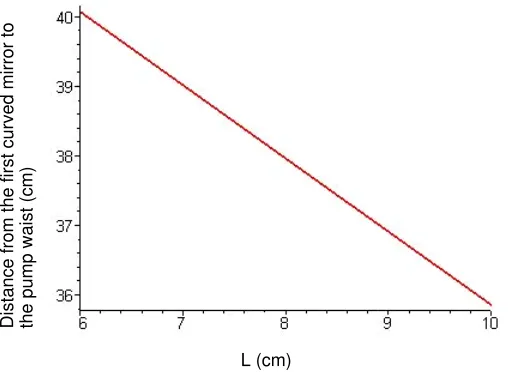
4.8 Distance from the pump waist to the first curved mirror of the cavity d against the distance L between the lens and the curved mirror . . . 47
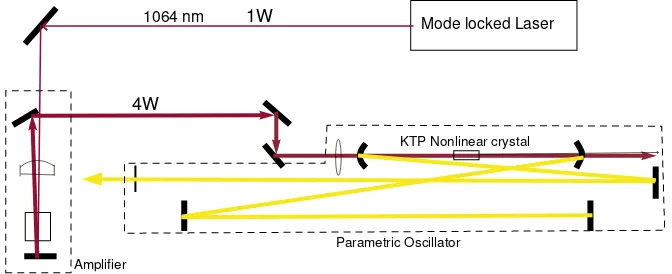
5.1 Layout of the KTP OPO: 1W Nd:YVO4 SESAM laser, an 3.5 gain double-pass amplifier, and a KTP OPO cavity . . . 50
5.2 Top and side view of the amplifying crystal side pumped by two diodes . . 51
5.3 Thermal lensing modified the horizontal profile of the output beam in single pass mode . . . 51
5.4 Double pass amplifier; left: side view (vertical plane), right: top view (hor-izontal plane) . . . 52
5.5 Layout of the KTP OPO cavity . . . 53
5.6 Pump beam profile at the crystal . . . 53
5.7 Measured and calculated threshold of the KTP OPO against the output coupler transmission . . . 55
5.8 Pump depletion and output power against pump power . . . 56
5.9 Pump depletion and output efficiency against number of times pump ex-ceeded threshold power . . . 57
5.10 The signal output power against the cavity length detuning. The effect was not symmetric due to the dispersion of the crystal . . . 58
5.11 The signal bandwidth as a function of number of times the pump power exceeded the threshold power . . . 58
6.1 Detailed experiment setup of the prototype guide star OPO. There were four main components: Nd:YVO4SESAM laser, amplifier, second harmonic generator and parametric oscillator . . . 59
6.2 Beam diameter at 13.5% intensity in vertical and horizontal direction at the crystal . . . 60
6.3 MgO:PPLN with three poling periods of 2.05µm, 12.15µm, and 12.25µm in z-direction . . . 61
6.4 Radii of the signal at the crystal and the end mirrors . . . 61
6.5 Temperature tuning of MgO:PPLN . . . 63
6.6 Threshold as a function of temperature . . . 64
List of Tables
1.1 The estimated efficiencies of the three schemes can be used to produce 589nm Sodium line. . . 8
2.1 Phase-matching methods for uniaxial crystals [2] . . . 21
3.1 Formulae for the steady-state threshold pump power for singly resonant optical parametric oscillator . . . 30 3.2 Optical properties of Lithium Niobate [3], [4] . . . 34 3.3 Sellmeier coefficients for congruently grown Lithium Niobate . . . 34 3.4 Sellmeier coefficients for congruently grown Lithium Niobate with 5 mol.%
MgO . . . 36
4.1 Sellmeier coefficients for congruently grown Lithium Niobate for Equation 4.8 . . . 42 4.2 Temperature-dependent Sellmeier coefficients for congruently grown
Lithium Niobate with 5 mol.% MgO . . . 43
Chapter 1
Introduction
1.1
Motivation
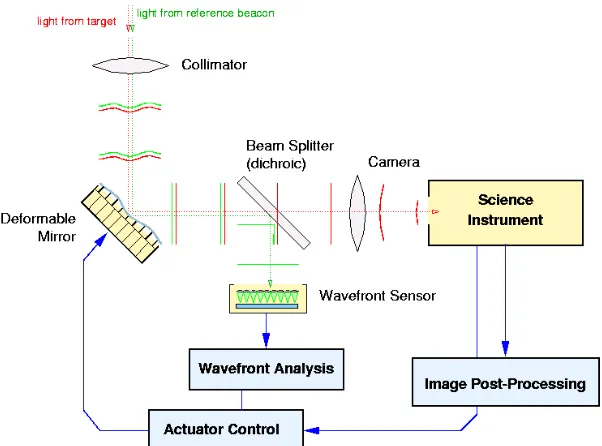
In 1953 the astronomer Horace Babcock proposed the concept of adaptive optics as a method for improving the resolution of an astronomical telescope by correcting distortions introduced by the atmosphere [5]. The idea was to insert a wavefront corrector between the output of the telescope and the imaging camera to alter the phase of the optical wave to exactly cancel the aberrations caused by the atmosphere. Since the atmospheric distortions are dynamic, the wavefront corrector must be adjustable on the 10-100ms time scale (See Figure 1.1). An example of the wavefront corrector is a deformable mirror where actuators can push or pull local regions of a thin glass plate that comprises the mirror surface, locally changing the optical phase [6].
In addition to developing methods of fabricating and adjusting such a mirror, the major challenge for adaptive optics is to determine the phase error on the beam at the positions of the actuators. To achieve this it is necessary to measure the aberrations dynamically and this requires an optical source, a beacon, outside the atmosphere as well as a local phase front sensor. This sensor essentially measures the phase of the incoming light from the beacon relative to a local reference plane wave, and generates an error signal that moves the actuators controlling the deformable mirror to eliminate that error.
The beacon itself can of course be a bright star, typically between 5th and 15th mag-nitude, but a significant problem arises because there are not enough stars to correct the atmospheric distortion over more than 1% of the sky. However, atmospheric distortions are very localised and hence even if one monitors the distortions in one direction, they will be different when observing an object in a direction only a few arc seconds away. As a result, an adaptive optics system will only work when the sky is sampled within about one arc-second of the primary observation direction. Artificial laser guide stars are needed to cover any position on the sky.
The most useful guide star mechanism involves resonant scattering from sodium atoms in the mesosphere between 85 and 95km above the earth’s surface. A high power laser operating at the sodium D2resonance line close to 589nm optically pumps the mesospheric
sodium layer exciting resonance fluorescence from that layer providing a bright, localised source that forms the artificial beacon. The position of this beacon can be moved to the direction the telescope is pointing to and hence, phase front correction can be made for any observation angle. The main challenge associated with laser guide star technology is to obtain sufficient photon flux from the guide star to provide good signal to noise ratio in the wavefront sensor. In the case of infrared astronomy the required photon flux is quite low at 100photons/cm2/s, whereas for visible satellite ranging the required flux is much larger at>1000photons/cm2/s [7]. Examples of the laser guide star on Keck Observatory
4 Introduction
Figure 1.1: A typical set up for adaptive system, the wavefront sensor provide a feedback to the deformation mirror, which corrects the distorted wavefront. A guide star is needed to provide high enough intensity for the wavefront sensor (Source: Gemini adaptive telescope)
and the improvement in resolution obtained for astronomical observations is shown in Figure 1.2.
AO on Ao off
Figure 1.2: A comparison between normal telescope image and adaptive optics telescope image. This is the image of a binary star: on the left is without adaptive optics, on the right adaptive optics is used. (Source: Keck Observatory)
Laser excitation of mesospheric sodium is a complex matter, but has now been the subject of extensive studies for guide star applications [8]. Since the sodium concentration is rather low (103-104 atoms/cm3) it is easy to saturate the transition and this means that careful attention needs to be paid to the operating mode of the laser to ensure that the highest fluorescence yields. The main D2 line consists of a manifold of 24 magnetic
§1.2 Review of Laser Guide Star 5
pumping over the full 3GHz line-width is desirable to increase the saturation intensity to around 5W/cm2. The radiative lifetime of the level is≈16ns suggesting that CW or long
pulse sources are preferred.
It is a complex matter to determine the laser power required to achieve particular levels of photon emission since it depends critically on the operating parameters of the laser. Milonni et al. [10] calculated the photon return for the Starfire Optical Ranging and Mauna Kea laser guide star systems with continuous wave, long pulse and short pulse duration. The main parameters here are the laser line-width and power. For astronomical observations, 10W lasers are required; for satellite ranging 100W lasers are required. These laser power requirements are very demanding, especially when the power needs to be delivered in diffraction limited optical beams.
1.2
Review of Laser Guide Star
Lasers providing 10-100W, frequency stable, diffraction limited beams are very rare. To complicate matters further, the system must be a reliable low maintenance industrial type laser preferably based on solid-state laser technology amenable to pumping by reliable semiconductor diode lasers.
Early guide stars used dye lasers that could be readily tuned to emit directly at the 589nm resonance line. These systems could be pumped with high average power copper vapour lasers or frequency doubled solid-state lasers. This technology was developed by Lawrence Livermore Laboratories in the USA to create a 15W average power at 11kHz repetition rate and 100ns pulse source used at the Shane Telescope at the Lick observatory [11]. This was a very complex laser, and difficult to scale to higher average powers. Even if the systems’s average power were increased by an order of magnitude, the pulse format was such that strong saturation was encountered, lowering the fluorescence yields from the mesospheric sodium. Hence, on engineering grounds and from the saturation considerations, alternative format sources are desirable.
No known solid-laser system can emit directly at the 589nm line and hence, a number of approaches using nonlinear optical processes to convert the emission from the common solid-state lasers have been studied. These include Raman shifting of the 1064nm line from Nd:YAG laser to 1178nm using Calcium Tungstate and then frequency doubling that emission to 589nm as has been demonstrated by Cheunget al.[12].
A second process uses a fluke of nature in that two strong gain lines in Nd:YAG, the 1064nm and 1319nm lines, are nearly perfect for sum frequency generation to produce 589nm emission [13]. This forms the basis of an all solid-state system amenable to diode laser pumping using of of the best developed laser materials. It is, therefore, quite at-tractive for this application. Since in either of these schemes (and other variations of them which have been studied) nonlinear conversion is essential, it is important to achieve the maximum conversion efficiency in the nonlinear process. In general the higher the peak intensity in the pulse, the better the conversion efficiency. For processes such as sum frequency generation or second harmonic generation using readily available nonlinear crystals, intensities around 1GW/cm2 will lead to conversion efficiencies of >80%.
6 Introduction
this problem much shorter pulses should be used. For example, for the pulses around 100ps duration, intensities of ≈1GW/cm2 can be achieved at fluences corresponding to
only 10-20% of the damage threshold for the nonlinear crystal and this allows the nonlinear process to be very efficient.
As a result, most schemes based on nonlinear conversion use pulses of a few hundred picoseconds in duration, which are often delivered as so-called micro-macro pulses-trains of few hundred 100ps duration pulses separated by 10-20ns within a macro-pulse envelope of a few hundred microseconds long. The additional advantage of such a pulse format is that it is very resistant to saturation and returns more signal per watt of transmitted power than obtained using longer 100ns pulses. The shortest possible pulse that can be employed in a guide star is determined by the line-width of the Na D2 transition, which is
3GHz. For a pulse with a Gaussian temporal profile, the time-bandwidth product is 0.44, which means that the pulse duration should be 146ps. Pulses of this duration are readily produced from mode-locked solid-state lasers.
A diode-pumped solid state Nd laser system based on sum frequency generation has been successfully applied to a LGS system at the NOAO Vacuum Telescope Tower at Sac Peak [14]. 12W of emitted power produced a beacon equivalent to a magnitude 9.2 star. Whilst this system is scalable to higher power, there are still considerable challenges to produce well-polarised, diffraction-limited beams from YAG lasers at powers in the 20-100W range. Nd:YAG is an isotropic material with no natural birefringence. As a result, at high pump powers, thermal loading in the crystal results in induced birefringence and this degrades the performance of the laser, especially for the nonlinear optics applications (where the pump laser must be well-polarised).
In addition, the scheme based on sum frequency generation requires two time synchro-nised pulsed mode-locked laser oscillators and this poses a number of technical challenges. In order to synchronise the lasers, active mode-locking is required. Actively mode-locked lasers are troublesome because their resonators must be very accurately stabilised in length (to within a few microns) to remain in resonance with the crystal controlled RF source that drives the acousto-optic mode-lockers. This requires the development of the mechan-ical subsystems which maintain the resonator length stable in the face of changes in the ambient temperature. This had been achieved with relatively limited success in commer-cial lasers. The gain varies significantly between the 1064nm and 1319nm lines of YAG and this can complicate synchronisation of the envelopes of the pulsed systems.
A preferable approach would be to use a single, continuous, passively mode-locked laser where variations in length of the resonator have no effect on the laser performance, thereby, simplifying the resonator design. In addition, to obtain the highest diode pump efficiency and eliminate the problems of thermally induced birefringence, a naturally bire-fringent gain medium is preferred. For reasons of its birefringence, high gain, and ease of pumping, Neodymium-doped Yttrium Ortho-Vanadate, Nd:YVO4 has, therefore, become
the preferred gain medium for compact high power diode-pumped Nd lasers. Its short upper lasing level lifetime (compared with Nd:YAG) makes it especially suitable for pas-sive mode-locking, making it robust against Q-switched mode-locking which is potentially damaging to nonlinear crystals. It is not possible, however, to use Nd:YVO4 to create
589nm light through sum frequency generation because its longer wavelength emission oc-curs at 1342nm rather than 1319nm as for Nd:YAG, placing the sum frequency well away from the D2 line. As a result, other approaches are required.
§1.3 Optical Parametric Oscillators: An Approach 7
oscillator to produce 589nm emission.
1.3
Optical Parametric Oscillators: An Approach
Optical parametric oscillators (OPOs) are the sources of coherent radiation that share some characteristics of laser oscillators. The laser medium is, however, replaced by a second order nonlinear optical crystal and gain due to stimulated emission replaced by parametric amplification. In an optical parametric amplifier (OPA), photons from the pump laser spontaneously decay into pairs of photons whose energy adds up to that of the pump (thus, obeying energy conservation) as in Equation 1.1. By convention the higher frequency photon is known as the signal, and the lower frequency photon is the idler.
ωp=ωs+ωi (1.1)
Here ωp is the pump frequency, ωs is the signal frequency and ωi is the idler frequency.
Once the signal and idler photons are generated by spontaneous decay of the pump by a process known as parametric fluorescence, mixing processes take over where signal (idler) photons mix with the pump via the nonlinearity to create more idler (signal) photons. Energy flows always from the high to the lower frequency waves and thus both signal and idler fields grow at the expense of the pump. For the process to be efficient, the interaction must conserve momentum, as described in Equation 1.2. This relation is known as the
phase matching relation.
kp=ks+ki (1.2)
where kj =njωj/c, with nj being the index of refraction of the materials at the angular
frequencyωj andc is the speed of light.
Equation 1.2 is not normally satisfied because of dispersion (the variation in refractive index of a medium with wavelength). However, in a birefringent crystal it is possible to choose appropriate polarisations for the three interacting waves so that Equation 1.2 can be satisfied. In such conditions, the gain depends exponentially on the distance of propagation (in the absence of pump depletion). If the crystal is placed inside a low loss resonator that reflects signal or idler (or both) waves, the signal and idler photon flux increase until limited by pump depletion.
Another way exists to obtain phase matching known asperiodic poling or quasi phase matching. This involves treatment of the nonlinear optical crystal to modulate the sign of the optical nonlinearity periodically. In this case the wave vector mismatch, ∆k =
kp−ks−kiis compensated by the grating vector,Kgdue to the modulation of the nonlinear
properties. Thus, in periodically poled materials, birefringence is no longer needed to obtain phase matching and materials can be engineered to use their most favourable nonlinear optical coefficient (which is a tensor property dependent on the orientation of the crystallographic axes relative to the propagation direction of the beams). Amongst the most popular nonlinear crystals, MgO:LiNbO3 is an excellent candidate due to its
high nonlinear coefficient, suitable range of transparency, high photorefractive damage threshold, and commercial availability.
8 Introduction
the OPO using quasi phase matching is due to the dependence of grating vector Kg on
temperature. Therefore, by controlling the temperature of the nonlinear crystal, the signal output can be tailored and stabilised at the desired wavelength or frequency.
There are many OPO schemes that can lead to the generation of 589nm light and several of these could be investigated as part of this project. There are three promising possibilities, as following:
Scheme 1 Use of a high average power frequency doubled mode-locked continuous wave Nd:YVO4 laser to pump a periodically poled MgO:LiNbO3(MgO:PPLN) OPO with
its signal wavelength at 589nm.
Scheme 2 The Nd laser is frequency tripled to create a 355nm pump and this used to pump an OPO producing 589nm light.
Scheme 3 Nd laser directly pumps a MgO:PPLN OPO generating 1319nm then sum frequency generation with 1064nm to produce 589nm wavelength.
Schemes Description Overall signal Efficiency
1 1064nm →SHG 532nm →OP O 589nm+ (5500nm) 43%
2 1064→T F G 355nm→OP O 589nm + (893nm) 29%
3 1064nm →OP O 1319nm + (5500nm) →SF G 589nm 29%
Table 1.1: The estimated efficiencies of the three schemes can be used to produce 589nm Sodium line.
Out of the three schemes mentioned above, the Scheme 1 is the best in terms of efficiency to the signal. The efficiencies of the schemes depend on the number of nonlinear optical processes involved and the nature of those processes. The maximum possible overall conversion efficiencies of second and third harmonic generations, parametric oscillator and sum frequency generation are 80% and 60% and 60%, respectively. The total energy conversion is in the output of both signal and idler. This aim of the design is to maximise the output energy of the signal. Table 1.1 estimates the overall efficiency to the 589nm signal of the three schemes mentioned above. In Scheme 1, after the OPO the signal carries 90% the converted energy due to the fact that the signal frequency is very close to the pump frequency. Hence, the overall signal efficiency can be up to 43%. However, in the Scheme 2, the signal after OPO carries only 60% of the converted energy; this makes the overall signal efficiency of only 29%. Similarly, the Scheme 3 has only maximum overall signal conversion of 29%. Table 1.1 indicates that scheme 1 is the best option.
However, there are disadvantages in the Scheme 1 due to the fact that Lithium Niobate strongly absorbs the 5.4µm idler wave (α= 8cm−1). This absorption potentially can lead
§1.4 Summary of the Thesis 9
1.4
Summary of the Thesis
Chapter 2
Chapter 2: Nonlinear Optics
In this chapter, the main principles of linear and nonlinear optics are outlined. The phe-nomena of harmonic generation, wave-mixing, parametric generation and oscillation are examined in detail sufficient for the experimental aims of the project. Finally, different phase matching methods are introduced, and the quasi phase matching method is specif-ically emphasized.
2.1
Introduction to nonlinear optics
2.1.1 Wave equation
In a dielectric, free of electric charges and magnetic dipoles, the most general wave equation describing the propagation of the electric field vector is given by [3]:
∇ × ∇ ×E˜ + 1
c2
∂2
∂t2E˜ =−
1
²oc2
∂2
∂t2P˜ (2.1)
where E˜ and P˜ are the electric field and polarization vectors (or tensors in more general term), which vary rapidly in time, c = 3×10⁸m/s is speed of light in vacuum, and
²o= 8.85×10⁻¹²F/m is the electric permittivity of free space.
In the linear optics regime, the total polarisation has only a linear component, which is proportional to the applied electric field:
˜
PL=²oχ(1)·E˜ (2.2)
where χ(1) is the linear dielectric response tensor. In general, the relation between P˜L and E˜ is tensorial, and can also be written as
˜
PL,i=²o
X
j
χ(1)ij E˜j (2.3)
where the subscript i signifies the ith cartesian coordinate (i = x, y, z) and the sum is overj=x, y, z. The tensor χ(1) thus has nine components. In an isotropic medium there
is only one independent nonzero component, and the dielectric response is written as a scalar quality χ.
When the intensity of the light is sufficiently high (e.g. from a laser), a small additional polarization will appear in addition to the normal linear polarisation, so that the total polarization can be written as:
˜
P=P˜L+P˜NL (2.4)
12 Chapter 2: Nonlinear Optics
where P˜NL is a nonlinear function of the applied field.
2.1.2 Nonlinear Susceptibilities
It can be assumed that the nonlinear polarisation can be written as
˜
PNL=P˜(2)+P˜(3)+... (2.5)
where
˜
P(2) =²oχ(2):E˜˜E (2.6)
˜
P(3)=²oχ(3):E˜˜E˜E (2.7)
etc.
It is important to note that the field in these equations is the total applied field, which can be a superposition of many fields of different frequencies. χ(n) is thenth(n >1) order
dielectric response and is a tensor of rank n+1.
When the total field is expanded in terms of its Fourier components, the nonlinear polarization will consist of several terms oscillating at various combination frequencies. For example, if the total field consists of two waves oscillating at frequencies ω1 and
ω2, the second order nonlinear polarisation will have components oscillating at 2ω1, 2ω2,
ω1 +ω2, |ω1 −ω2|and dc term at zero frequency. Similarly, with three fields oscillating
at frequencies ω1,ω2, and ω3, the third order polarisation will oscillate at 3ω1, 3ω2, 3ω3,
ω1+ω2+ω3,ω1+ω2−ω3, etc.
It is common to write the Fourier components of the nonlinear polarisation in the following way. Consider a second order polarisation oscillating at ωn and ωm, with ωr =
ωn+ωm. Then the ith component of the complex polarisation amplitude is expressed as
Pi(2)(ωr) =²o
X
jk
X
(nm)
χ(2)ijk(ωn+ωm, ωn, ωm)Ej(ωn)Ek(ωm) (2.8)
Here the indices ijk refer to the cartesian components of the fields. The notation (nm) indicates that, in performing the summation over n and m, the sum ωn+ωm is to be held
fixed, althoughωn and ωm are each allowed to vary. Following convention,χ(2) is written
as a function of three frequency arguments. This is technically unnecessary in that the first argument is always the sum of the other two. To emphasize this fact, the susceptibility
χ(2)(ω3, ω1, ω2) sometimes written asχ(2)(ω3;ω1, ω2) as a reminder that the first argument
is different from the other two; or it may be written symbolically as χ(2)(ω
3 =ω1+ω2).
2.1.3 Properties of the Nonlinear Susceptibility
Nonlinear susceptibility has been defined as a tensor. In the second order term χ(2) is an 3×3×3 tensor with 27 components. For a particular material, it is possible to determine all values of the component. There are a number of restrictions resulting from symmetries that relate the various components of χ(2), hence, fewer than 27 components are usually needed in order to describe the nonlinear coupling. In this section, the second-order χ(0)
§2.1 Introduction to nonlinear optics 13
The first symmetry apparent from the form of the Equation 2.8 is due to the lack of difference physically in which order the product of the field amplitudes is given. Thus, the interchange in the order of the productEj(ω1)Ek(ω2) [i.e. Ej(ω1)Ek(ω2)↔Ek(ω2)Ej(ω1)]
will not affect the value or sign of the ith component of the nonlinear polarisation. The nonlinear susceptibility should reflect this symmetry. The symmetry property is expressed as
χ(2)ijk(ω3, ω1, ω2) =χ(2)ikj(ω3, ω2, ω1) (2.9)
In other words, if any of the subscripts {jk} are permuted, then the susceptibility will remain unchanged as long as the corresponding set of subscripts {12}is also permuted.
Another form of the permutation symmetry can be shown when the nonlinear suscep-tibility is calculated quantum mechanically. This is usually done using the density matrix method [2], [15]. It can be shown generally, for example in second order, that
χ(2)ijk(ω3, ω1, ω2) =χ(2)jik(ω1,−ω2, ω3)∗=χ(2)kji(ω2,−ω1, ω3)∗ (2.10)
First, it is noted that if the complex conjugate of the susceptibility is taken, it just changes sign of all of the frequencies. This is a consequence of the fact that the rapidly varying nonlinear polarisation is a real mathematical quantity. Then, for any permutation of the Cartesian subscript, the new susceptibility obtained is equal to the original susceptibility if the corresponding frequency subscripts are also permuted. This important result states that the susceptibilities for different physical processes are simply related.
The above expressions hold generally when the susceptibilities are complex. This is especially important when any single frequency or any combination frequency is near a natural resonance frequency of the materials. However, it is often the case in many applica-tions that all frequencies and combination frequencies are far from any material resonance. Then, the susceptibilities are be treated as real quantities, and any susceptibility is thus equal to its complex conjugate. In this case, Equation 2.10 may be written as
χ(2)ijk(ω3, ω1, ω2) =χ(2)jik(ω1,−ω2, ω3) =χ(2)kij(ω2,−ω1, ω3) (2.11)
Under the condition that the susceptibilities are real (all frequencies are far from any res-onance), the susceptibilities are unchanged for the simultaneous permutation of subscripts for the Cartesian set{ijk}and the corresponding subscripts from the frequency set{312}, on the condition that the frequencies carry the proper sign.
Another symmetry follows when the susceptibilities exhibit negligible dispersion over the entire frequency range of interest. Thus, in addition to all frequencies being far from any material resonance, this symmetry requires that there is no resonance between any of the frequencies. When dispersion can be ignored, the frequencies can be freely permuted without permuting the corresponding Cartesian subscripts, and vice versa, and the susceptibility will remain unchanged. This is known as Kleinman symmetry. In other words, the second-order susceptibilities can be written as
χ(2)ijk(ω3, ω1, ω2) = χ(2)jik(ω3, ω1, ω2) =χ(2)kij(ω2,−ω1, ω3) =χ(2)jki(ω3, ω1, ω2)
= χ(2)kji(ω3,−ω1, ω2) =χ(2)ikj(ω3,−ω1, ω2) (2.12)
14 Chapter 2: Nonlinear Optics
important since in many cases this greatly reduces the number of nonzero, independent tensor components needed to describe the medium. One immediate consequence of this is that for all materials that possess a centre of inversion symmetry, all elements of all even-order nonlinear susceptibility tensors are identically equal to zero. Hence, there are no even-order nonlinear processes in these types of materials. The specific form of third order susceptibilities may also be given for each symmetry class. Third order effect are primary in centrosymmetric media. The detailed table of susceptibility tensor for each class of symmetry can be found in Boyd [2] and Shen [15].
2.1.4 Contracted Notation d-coefficient and effective susceptibility
At this point it is important to note another notation that is used in second order nonlinear optics. Often the susceptibility is represented as the so-called d-coefficient, where d is a tensor given by
dijk=
1 2χ
(2)
ijk (2.13)
Furthermore, the intrinsic permutation symmetry, as discussed above, is used to contract the last two subscripts and write dijk →dil. The subscripts are then written as numbers
instead of letters, using the following rules
i: jk: l:
x 1 xx 1
y 2 yy 2
z 3 zz 3
yz =zy 4
xz =zx 5
xy =yx 6
(2.14)
For example, dxyz = dxzy = d31 etc. The utility of this notation is that d-coefficients
can be expressed as elements of a 3×6 matrix rather than a 3×3×3 tensor. To use these coefficients in the nonlinear polarisation of Equation 2.8, just make the substitution
χijk →2dil i.e.
Pi(2)(ωr) =D(2)²o
X
jk
2dil(ωn+ωm, ωn, ωm)Ej(ωn)Ek(ωm) (2.15)
The nonlinear susceptibility tensor can then be represented as the 3×6 matrix:
dil =
d11 d12 d13 d14 d15 d16
d21 d22 d23 d24 d25 d26
d31 d32 d33 d34 d35 d36
(2.16)
If we now explicitly introduce Kleinman symmetry condition, i.e. that the indicesdijk
can be freely permuted, we find that not all of the 18 elements ofdil are independent. For
instance, it can be shown that
d12≡d122=d212≡d12
and
§2.2 Second Harmonic Generation 15
By applying this type of argument systematically, it can be found that dil has only
10 independent elements when the Kleinman symmetry condition is valid; the form of dil
under these conditions is
dil =
d11 d12 d13 d14 d15 d16
d16 d22 d23 d24 d14 d12
d15 d24 d33 d23 d13 d14
(2.18)
Effective Value of d (def f)
For a fixed geometry (i.e., for fixed propagation and polarisation directions) it is pos-sible to express the nonlinear polarisation using an effective nonlinear susceptibilitydef f.
A general prescription for calculating def f for each of the crystal classes has be well
studied (See Boyd[2] and Sutherland[3]). For example, for the crystals of crystal class 3m, the effective value of d is given by the expression
def f =d31sinθ−d22cosθsin 3φ (2.19)
under conditions known as type I phase matching, in which the signal and idler waves have the same polarisation; and by
def f =d22cos2θsin 3φ (2.20)
under condition known as type II conditions, in which polarisations of signal and idler are orthogonal. In these equations,θand φare the angle between the propagation vector with optical axes of the crystal.
It is important to recognise that, in general,def f is a sum of terms obtained through
the contraction process and must be determined for each particular problem based on the polarisations of the interacting optical waves and geometry of the nonlinear crystal. Beyond this point, the nonlinear susceptibility coefficients are always written as def f or
d, because for each of the condition of the angle of propagations of light waves relative to the optical axes of the crystal, it is always possible to calculate this effective coefficient using the standard equations given in the literature.
2.2
Second Harmonic Generation
In this section, the mathematical description of the process of second-harmonic generation is considered. It is assumed that the medium is lossless both at the fundamental frequency
ω1 and at the second-harmonic frequency ω2 = 2ω1, so that the nonlinear susceptibility
obeys the conditions of full permutation symmetry. The first detailed theoretical treatment of second harmonic generation is by Armstronget al. [16]. The process is shown in Figure 2.1.
The total electric field in the nonlinear medium to be given by
˜
E(z, t) = ˜E1(z, t) + ˜E2(z, t) (2.21)
where each component is expressed in terms of a complex amplitude Ej(z) and slowly
varying amplitude Aj(z) according to
˜
16 Chapter 2: Nonlinear Optics
Nonlinear Crystal Pump w
2w w
Figure 2.1: Second harmonic generation
where
Ej(z) =Aj(z)eikjz (2.23)
and c.c. stands for complex conjugate.
Using the wave equations, the amplitudes of fundamental and second harmonic are found to be related by a pair of coupling equations [2]
dA1
dz =i
2ωdef f
nωc
A2A∗1e−i∆kz (2.24)
and
dA2
dz =i
2ωdef f
n2ωc
A21ei∆kz (2.25)
where ∆k= 2k1−k2
These equations were first solved by Armstrong et al. [16]. In general, both the modulus and phase of the complex field amplitudes are computed. However, to compute the output intensity of the generated wave, only modulus is used. The intensity of a wave at some position zis given by
Ij = 2²onjc|Aj|2. (2.26)
The power of a given wave is computed from the area S of the beam and the intensity distribution.
Pj =
Z
SIjdS (2.27)
In the undepleted-pump approximation (i.e.,A1 =Aω=constant), Equation 2.25 can
be integrated immediately to obtain an expression for the spatial dependence of the second harmonic field amplitude (with initial condition of no second harmonic input atz= 0)i.e.
I2(z) =
8²oω2d2ef f
n2ωc2
A41z2
Ã
sin12∆kz
1 2∆kz
!2
(2.28)
The intensity I of the pumpω1 is related toA1by Equation 2.26. Hence the conversion
efficiency is given by the formula
η2ω=
I2ω
Iω
= 8π
2d2 ef fz2Iω
²on2ωn2ωcλω2
sin2(∆kz/2) (∆kz/2)2 =
8π2d2ef fz2Iω
²on2ωn2ωcλω2
§2.3 Wave-Mixing 17
Equation 2.29 indicates that the maximum conversion occurs when
∆k= 0. (2.30)
Then it is said that the nonlinear interaction is phase-matched
This treatment is the simplest, and applied only to a plane wave that propagates in lossless medium and in the absence of pump depletion. In practice, the pump depletion can reach 80% using a Gaussian pulse. The next approximation is plane wave with pump depletion at perfect phase matching. The efficiency is given by [17] [3]
η2ω=tanh2(L/LN L) LLN =
1 4πdef f
s
2²on2ωn2ωλ2ω
Iω(0)
(2.31)
2.3
Wave-Mixing
Considering the situation shown in Figure 2.2, in which optical waves at frequency ω1,
ω2 and ω1 interact in a lossless nonlinear optical medium. It is assumed that the ω3 is a
strong wave (i.e. is undepleted by the nonlinear interaction so that its amplitude is treated as a constant), and for the boundary condition without anyω2 intensity (A2(0) = 0 at the
position z= 0).
Nonlinear Crystal w3
w1
w2
Figure 2.2: Wave-mixing process in a nonlinear medium The coupling equations for the amplitudes of three waves are [2]
dA1
dz = i ω1def f
n1c
A∗
2A3e−i∆kz
dA2
dz = i ω2def f
n2c
A∗
1A3e−i∆kz
dA3
dz = i ω3def f
n2c
A1A2e+i∆kz (2.32)
where ∆k=k1+k2−k3
18 Chapter 2: Nonlinear Optics
andω3 are only relative: one can always swap these symbols as long as the physics process
is clearly indicated (i.e. which is the pump, which is the signal).
Sum-frequency generation is the phenomenon in which the two pump waves atω1 and
ω2 mix to generate a third wave at ω3 =ω1+ω2. The difference-frequency generation is
similar except that the two pump waves combine to produce a wave at different frequency
ω3 =ω1−ω2.
The latter process is the origin of the parametric generation where the only input to the nonlinear crystal is the pump at ω3. The production of an initial pair of signal and
idler that satisfies the phase matching condition is due to parametric fluorescence, which is a quantum phenomenon. The material acts as a catalyst, generating the new photons through the nonlinear polarisation. As a convention, the higher frequency is called signal and the other is called idler.
2.4
Parametric Amplification
Equation 2.32 then can be rewritten as a set of two equations
dA1
dz = i ω1def f
n1c
A∗
2A3e−i∆kz
dA2
dz = i ω2def f
n2c
A∗
1A3e−i∆kz (2.33)
The solution of these two equations in absence of pump depletion (i.e. A3 =constant)
can be easily found [2],[15],[17],[18]
A1(z) =
·
A1(0)
µ
cosh(gz)−i∆k
2g sinh(gz)
¶
+iκ1 g A
∗
2(0)sinh(gz)
¸
ei∆kz/2
A2(z) =
·
A2(0)
µ
cosh(gz)−i∆k
2g sinh(gz)
¶
+iκ2 g A
∗
1(0)sinh(gz)
¸
ei∆kz/2 (2.34)
where the coefficient g is given by
g=
"
κ1κ2−
µ∆k
2
¶2#
1 2
(2.35)
and
κj =
ωjdef f
njc
A3 (2.36)
For the initial condition of no input for the idlerω2 Equation 2.34 becomes
A1(z) =
·
A1(0)
µ
cosh(gz)−i∆k
2g sinh(gz)
¶¸
ei∆kz/2
A2(z) =
·
iκ2 g A
∗
1(0)sinh(gz)
¸
ei∆kz/2 (2.37)
For the perfect phase matching situation where ∆k = k1 +k2 −k3 = 0, the final
§2.4 Parametric Amplification 19
A1(z) = A1(0)cosh(gz)
A2(z) = i
κ2
g A
∗
1(0)sinh(gz) (2.38)
These two equations imply that even with no input atω2 it is still generated together
with the amplification of the signalω1. The intensities of the idler and signal with distance
z are plotted on Figure 2.3
Amplitude
Distance z Signal
Idler
Figure 2.3: Parametric amplification of the signal and idler in plane wave, non-depleted pump approximation
The parametric gain coefficient is defined by
G(z) = I1(z)
I1(0) −
1 = |A1(z)|
2
|A1(0)|2 −
1 (2.39)
For the simplest case as above (i.e. plane wave, no pump depletion, no input at ω2
and perfect phase matching) the parametric gain coefficient is
G(z) =cosh2(gz)−1 (2.40) For non-perfect phase matching, the gain coefficient can be calculated from Equation 2.37. The final result of the gain would be complicated due to the complex number calculation. However, the gain can be simplified by a further assumption that is the gain is normally small, this is generally true for parametric amplification. Milonni and Eberly [19] and Myers et al. [4] shows the approximation that leads to the gain expression for low gain, non-perfect phase matching for plane wave case
G(z) =κ1κ2z2
sin2 12∆kz
20 Chapter 2: Nonlinear Optics
2.5
Phase Matching
It is clear from the previous section that phase matching is necessary for efficient conver-sion. Equations 2.29 and 2.41 predict a dramatic decrease in the efficiency of the second harmonic generation when the condition of perfect phase matching, ∆k= 0, is not satisfied due to thesinc function which has the shape as shown on Figure 2.4.
Figure 2.4: The dependence of second harmonic intensity against phase mismatch as a sinc function of ∆kz
The phase matching condition ∆k= 0 is often difficult to achieve because the refractive index of materials that are lossless in the range from ω1 to ω3 shows an effect known as
normal dispersion: the refractive index is an increasing function of frequency. As a result, the condition of perfect phase matching with collinear beams,
n1ω1+n2ω2 =n3ω3 (2.42)
where
ω1+ω2=ω3 (2.43)
cannot be achieved. For the case of second-harmonic generation, with ω1 = ω2, and
ω3 = 2ω1, these conditions require that
n(ω1) =n(2ω1) (2.44)
which is clearly not possible whenn(ω) increases monotonically with ω.
§2.5 Phase Matching 21
Refractive Index
no
ne
Frequency w
w 2w
Figure 2.5: Dispersion of the refractive indices of a negative uniaxial crystal.
In order to achieve phase matching through the use of birefringent crystals, the highest-frequency waveω3 =ω2+ω1 is polarised in the direction that gives it the lower of the two
possible refractive indices. For the case of a negative uniaxial crystal, as in the example shown in Figure 2.5, this choice corresponds to the extraordinary polarisation. There are two choices for the polarisation of the lower-frequency waves. Type I phase matching is the case where the lower-frequency waves have the same polarisation, and type II is the case where the polarisations are orthogonal. The possibilities are summarised in Table 2.1
Positive uniaxial (ne> no) Negative uniaxial(ne< no)
Type I no
3ω3=ne1ω1+ne2ω2 ne3ω3=no1ω1+no2ω2
Type II no
3ω3=no1ω1+ne2ω2 ne3ω3=ne1ω1+no2ω2
Table 2.1: Phase-matching methods for uniaxial crystals [2]
Careful control of the refractive indices at each of the three optical frequencies is required in order to establish the phase-matching condition. In practice, there are two methods to achieve phase matching: angle and temperature tuning [2].
2.5.1 Angle Tuning
The angle tuning method involves precise angular orientation of the crystal with respect to the propagation direction of the incident light. It is most simply described for the case of a uniaxial crystal. Uniaxial crystals are characterised by a particular direction known as the optical axis (or c axis or z axis). Light polarised perpendicular to the plane containing the propagation vector k and the optical axis is said to have ordinary polarisation. Such light experiences a refractive indexno called the ordinary refractive index. Light polarised
in the plane containingkand the optic axis is said to have extraordinary polarisation and experiences a refractive index ne(θ) that depends on the angle θ between the optic axis
and kaccording to the relation
1
ne(θ)2
= sin
2θ
n2 e
+cos
2θ
n2 o
22 Chapter 2: Nonlinear Optics
Here ne is the principal value of the extraordinary refractive index. Note that ne(θ) is
equal to the principal valuene forθ= 0 degrees is equal tono forθ= 0. Phase matching
is achieved by adjusting the angleθ to achieve the value ofne(θ) for which the condition
∆k= 0 is satisfied.
A special case arises if the phase matching angle turns out to be θ = 90o. This
is possible in some materials at a particular temperature. This situation is referred to as noncritical phase matching. The case of θ 6= 90o is called critical phase matching. Noncritical phase matching is advantageous for two reasons. First, it is less sensitive to beam divergence, which lowers the conversion efficiency. Second, the walk off angle for this case is zero.
Ordinary w c k theta extraordinary 2w
Figure 2.6: Angle phase matching for second harmonic generation
As an illustration of angle phase matching, the case of type I second-harmonic gener-ation in a negative uniaxial crystal is considered, as shown in Figure 2.6. Since ne is less
thanno for a negative uniaxial crystal, the fundamental wave is chosen to be an ordinary
and the second harmonic to be an extraordinary wave, in order that the birefringence of the materials can compensate for dispersion. The phase matching condition then becomes
ne(2ω, θ) =no(ω), (2.46)
or
sin2θ ne(2ω)2
+ cos
2θ
no(2ω)2
= 1
no(ω)2
(2.47)
In order to simplify this equation, we replacecos2θby 1−sin2θand solve forsin2θto obtain
sin2θ= 1
no(ω)2 −
1
no(2ω)2
1
ne(2ω)2 −
1
no(2ω)2
(2.48)
This equation shows how the crystal should be oriented in order to achieve the phase matching condition. Then the effective nonlinear coefficient def f can be calculated based
on the information of the particular setting of phase matching condition.
2.5.2 Temperature Tuning
§2.5 Phase Matching 23
Figure 2.7: Poling of crystal in QPM.
a result, ordinary and extraordinary rays with parallel propagation vectors quickly diverge from one another as they propagate through the crystal. This effect is calledwalk off. This walk off effect limits the spatial overlap of the two waves and decreases the efficiency of any nonlinear mixing process involving such waves.
For some crystals, notably Lithium Niobate, the amount of birefringence is strongly temperature-dependent. As a result, it is possible to phase-match the mixing process by holdingθ fixed at 90 degrees and varying the temperature of the crystal.
2.5.3 Quasi Phase Matching
Angle phase matching in birefringent crystals has been the most common form of phase matching for frequency conversion, however, it has some disadvantages. For example, some angles of propagation are not possible. Also, the use of cubic crystals is not possible, even though they have large nonlinear coefficients in some cases. In general, it would be desirable to isolate and use one of the diagonal terms of nonlinear susceptibility since they are generally larger. However, this is not possible in angle phase matching, and the def f
is generally smaller than these diagonal terms.
Armstrong et al. [16] were the first to suggest ways to achieve quasi phase matching
(QPM). For a frequency conversion process, such as an OPO or a SHG process, the phase mismatch ∆kL = (k3 −k2 −k1)L is accumulated by increasing the interaction
length (or length of the crystal). After a coherence length, lc = π/∆k, the conversion
efficiency reduces and energy flows back from the signal or from the doubled wave to the pump. If the nonlinear coefficient is modulated with a period twice the coherence length, in other words, the nonlinear coefficient changes its sign after each coherence length, the accumulated phase mismatch can be offset. Consequently, the conversion efficiency increases monotonously with interaction length.
The most common technique is illustrated in Figure 2.7. This structure is called
periodically poled. The nonlinear crystal is divided into segments each a coherence length long. Each segment is then rotated relative to its neighbours by 180o about the axis of
propagation. Because of the lack of inversion symmetry, this has the effect of changing the sign of all of the components of the nonlinear susceptibility tensor. Hence, the nonlinear polarisation wave is shifted byπ radians each coherence length.
24 Chapter 2: Nonlinear Optics
dn,ef f = (−1)n−1def f (2.49)
where def f is the effective nonlinear coefficient of the first slab for the particular
polar-isation of the interacting fields and the direction of propagation relative to the crystal principle axes. With further analysis using Fourier series representation [4], the final effective nonlinear coefficient for quasi phase matching is largest for the first-order process
dQ =
2
πdef f (2.50)
Furthermore, Fourier analysis gives the wave-vector mismatch for QPM interaction as
∆kQ=k1+k2−k3+kQ (2.51)
wherekQ = 2π/Λ is the grating vector of the crystal and Λ is the period of the modulated
structure.
Hence, the quasi phase-matched condition requires the period Λ to be
∆kQ=k3−k1−k2−
2π
Λ = 0 (2.52)
or
n3
λ3 −
n1
λ1 −
n2
λ2 −
1
Λ = 0 (2.53)
Using quasi phase matching, a wide range of spectrum can be tuned using grating period tuning and temperature tuning. Many grating Λ can be produced in fine steps on the same crystal. Using different grating periods, the different spectrum region can be tuned to. Then, the temperature tuning allows the fine tuning of the signal wavelength.
Summary
Chapter 3
Chapter 3: Optical Parametric
Oscillator
The main purpose of this chapter is to introduce the optical parametric oscillators. The parametric amplification process using Gaussian beam is first reviewed, then the threshold of the singly resonant optical parametric threshold formulae are introduced. The effect of idler absorption on threshold power is considered. Finally, the properties of Lithium Niobate are listed.
3.1
Parametric Amplification with Gaussian Beam
The treatment of section 2.4 is for the plane wave approximation. To increase the para-metric gain, the beams are often focused to a small beam at the crystal. For harmonic generation and other frequency conversion processes, TEM00Gaussian beams are generally
used. This section describes the parametric process with continuous wave (cw) Gaussian beams.
3.1.1 Focused Gaussian Beam (Near-Field)
This approximation is valid when the crystal thickness L is less than or of the order of the confocal parameters bj = 2nπw2j/λj of the interacting beams (see Figure 3.1). In other
words, the focusing parameter, which is defined by ξ = L/b, is less than 1. The pump beam is focused onto the crystal with radiuswp at e12 intensity. The generated signal and
idler beams have arbitrary radii ofws and wi, respectively, at e12 intensity.
The parametric gain, which is assumed to be small at perfect phase matching, is given by [3]
G= 4π
2d2 ef fL2
²on3pcλ2p
Pp(1−δ2)
4M2
π (3.1)
where L is the length of the crystal, λp, np and Pp are the wavelength, refractive index
and power of the pump, respectively;δ is degeneracy factor defined through
δ= 2λp
λs −
1 (3.2)
and λs is the signal wavelength in the vacuum; M is called the near field gain reduction
parameter, which is defined through the radii of the pump, signal and idler Gaussian waves:
26 Chapter 3: Optical Parametric Oscillator
M = wswiwp
w2
swi2+ws2w2p+w2iwp2
(3.3)
When the interacting beams have a Gaussian radial dependence, they are generally not optimally overlapped. This is because the nonlinear driving polarisation beam is smaller than the beams that generate it. For example, the polarisation source at the signal would be proportional to
e
−2r2
wp2 e
−2r2
w2
i =e −2r2
( 1 w2 p + 1 w2 i ) =e
−2r2
w02
s (3.4)
In general w0
s 6= ws due to the fact that the signal is arbitrarily generated. Since the
beams are not optically overlapped, this produces a reduction in the gain coefficient. The key factor is the near field gain reduction parameter M.
3.1.2 Optimised Confocal Near-Field Gaussian Beam
For a fixed value of the signal and idler radii, M2 is maximised for a pump radius given
by 1 w2 p = 1 w2 s + 1 w2 i (3.5) and hence,
MM ax2 = 1 4(w2
s+w2i)
(3.6)
Although the formula for the gain displays a dependence onL2, the intensity will only be large over a distance on the order of the confocal parameter. Setting L equal to the common confocal parameter of the signal and idler beams, it follows thatw2
s =λsL/2πns
and w2
i =λiL/2πni. Sincew2∝λandλ−p1 =λ−s1+λ−i 1, if the signal and idler beams are
confocally focused, then the pump beam will be confocally focused as well. In this case, the small signal parametric gain becomes
Nonlinear crystal
Pump
2wp
b
§3.1 Parametric Amplification with Gaussian Beam 27
G= 2π
2d2 ef fL
²on2pcλ3p
Pp(1−δ2) (3.7)
Note that the gain is now only proportional to L not L2.
3.1.3 Common Confocal Parameter Gaussian Beams
Boyd and Kleinman [20] analysed the effect of arbitrarily tightly focused Gaussian beams. They assumed that the signal beam size is determined directly from the pump beam size and that the generated signal has the same confocal parameter as the pump, ξs = ξp.
Their result for the small signal parametric gain is given by
G= 2π
2d2 ef fL
²on2pcλ3p
Pp(1−δ2)hm(B, ξ) (3.8)
wherehm(ξ) is a function of confocal parameterξof both pump and signal beam, as shown
in Figure 3.2. The subscript m denotes that h has been maximised with respect to phase mismatch ∆k. hm(ξ) reaches a maximum of 1.068 atξ= 2.84.
0.01 0.1 1 10
[image:39.612.193.466.316.516.2]0.01 0.1 1 10 100 1000
Figure 3.2: Parametric gain reduction factor as a function of focusing parameterξof both pump and signal beams
3.1.4 Arbitrary Focused Gaussian Beams
The pump beam size might not have the same confocal parameter ξ as the signal. Hence, the assumption made by Boyd and Kleiman is generally not true in practice.
Guha et al. [21] calculated the parametric amplification gain for arbitrary focusing parameters of the pump and signal beams. Their result is given in the following form:
G= 32π
2d2
ef fLPphsm(k, ξp, ξs)
²onsniλpλsλi(1 +k)
(3.9)
where k=kp/ks is the ratio of the wave vectors of the pump and signal; hsm(k, ξp, ξs) is
28 Chapter 3: Optical Parametric Oscillator
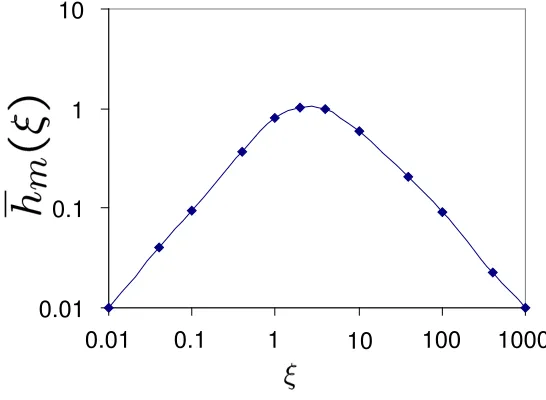
variation withξsare plotted in Figure 3.3 with two different values ofξp. The subscript m
denotes thathshas been maximised with respect to the phase mismatch ∆kL=kp−ks−ki.
It has been found that the maximum gain occurs at positive phase mismatch. It can be concluded that the maximum gain can be achieved with unequal confocal parameters. For example, for ξp = 1 the maximum parametric gain occurs at ξs = 1.3; for ξp = 5 the
maximum parametric gain is atξs = 3.3.
0.001 0.01 0.1 1
0.01 0.1 1 10 0.001
0.01 0.1 1
0.01 0.1 1 10
Figure 3.3: Variation of the SRO function hsm as a function of focusing parameter ξs = l/bs,
with k=1.5 and two values of ξp=l/bp = 1, 5
3.2
Optical Parametric Oscillator
The previous section has briefly described optical parametric amplification (OPA). The gain of an OPA is modest (a few percent) even for high pump intensities. The net gain can be increased by providing positive feedback to the signal. A convenient way of achieving this is to place the nonlinear crystal in a two-mirror resonator, similar to a laser resonator. When the optical parametric gain of the resonator exceeds its optical loss, oscillation occurs. Such a device is called an optical parametric oscillator (OPO). The output of this device is coherent radiation like that of a laser.
The signal and idler frequencies are adjusted by the phase matching conditions to maximise the gain so that these frequencies will achieve the lowest threshold and be selectively amplified. Hence the output of an OPO is wavelength tunable. Tuning can be achieved by angle or temperature tuning or by quasi phase matching.
§3.3 Singly Resonant Parametric Oscillator 29
3.3
Singly Resonant Parametric Oscillator
The simplest SRO has two cavity mirrors with high reflectance at the signal frequency only, as shown in Figure 3.4. In this case, only the signal is resonant, so the cavity resonant modes fluctuate,ωi is free to change continuously to accommodate conservation of energy.
Hence the SRO is relatively stable against cavity fluctuation due to thermal expansion or vibrations.
Mirror Mirror
Nonlinear Crystal Incident Pump
Signal
Idler Transmitted Pump
Figure 3.4: Singly resonant parametric oscillator
3.3.1 Threshold
In an OPO, unlike a laser, the signal and idler waves are only amplified when they are travelling in the same direction as the pump wave. The waves propagating counter to the pump wave are not phase matched. The steady-state parametric gain is determined under self-consistent conditions where the single-pass parametric gain equals to the round-trip electric field loss [18], [17]. Letting Rs be the round trip reflectivity of the cavity, the
threshold condition becomes
RsAs(L) =As(0) (3.10)
where As(0) andAs(L) are the amplitude of the signal field before and after passing the
crystal (see Equation 2.37).
The minimum threshold results when the signal is resonant and phase matching is achieved (∆k= 0). This self-consistent analysis with the assumption that the parametric gain is small (a few percent) leads to the following equation
G= (gL)2 = 2(1−Rs) (3.11)
Using this equation and the gain formulae from Equations 3.1 to 3.8, the threshold pump power has been computed [3] and is given in Table 3.1. The threshold pump powers are calculated for continuous wave (cw) Gaussian beams. However, these are also applied for the Gaussian pulses, where the threshold peak power of the pulses is to be determined from these formulae.
3.3.2 Efficiency
30 Chapter 3: Optical Parametric Oscillator
Near field Gaussian beams
Pp,th=
²on2snpcλ2p 8πd2
ef fL
2 (1−δ2
)M2(1−Rs)
Optimized confocal near-field Gaussian beams
Pp,th=
²on2scλ3p π2d2
ef fL(1−δ
2)(1−Rs)
Common confocal parameter focused Gaussian beams
Pp,th=
²on2scλ3p π2d2
ef fL(1−δ
2)h
m(ξ)(1−Rs)
Arbitrary focused Gaussian beams
Pp,th= ²o16cnπ2sdn2iλpλsλi(1 +k)
ef fLhsm(k,ξp,ξs)
(1−Rs)
Table 3.1: Formulae for the steady-state threshold pump power for singly resonant optical para-metric oscillator
η= Ps+Pi
Pp(0)
(3.12)
The detailed calculation of ηfor the SRO pumped by a Gaussian pump has been done by Bjorkholm [22] and is given in the following form:
η= 1−
"
1
NSRO
+
Z lnNSRO
0
e−xcos2Γ(x)dx
#
(3.13)
where
sin2Γ(x) Γ2(x) =
ex NSRO
NSRO =
Pp,in
Pp,th
(3.14)
[image:42.612.129.403.65.311.2]A solution cannot be obtained explicitly but can be evaluated numerically. Plots of the efficiency for the SRO in plane wave and Gaussian wave approximation are shown in Figure 3.5. When Gaussian beams are used, the maximum efficiency of a SRO can reach 71% when the pump power is at 6.5 times above threshold.

![Table 3.2: Optical properties of Lithium Niobate [3], [4]](https://thumb-us.123doks.com/thumbv2/123dok_us/8041454.221329/46.612.186.344.437.534/table-optical-properties-lithium-niobate.webp)