1
The use of segmented cathodes to determine the spoke current density
1distribution in HiPIMS plasmas
23
Phitsanu Poolcharuansin1,2, Francis Lockwood Estrin1 and James W. Bradley 1, a) 4
5
1
Department of Electrical Engineering and Electronics, University of Liverpool, 6
Brownlow Hill, Liverpool L69 3GJ, UK 7
8
2
The Technological Plasma Research Unit, Department of Physics, 9
Mahasarakham University, Maha Sarakham 44150, Thailand 10
11
a)
Author to whom correspondence should be addressed. Email: 12
14 15
2 Abstract
1
The localized target current density associated with quasi-periodic ionization zones (spokes) 2
have been measured in a High Power Impulse Magnetron Sputtering (HiPIMS) discharge using 3
an array of azimuthally separated and electrical isolated probes incorporated into a circular 4
aluminum target. For a particular range of operating conditions (pulse energies between 1 and 2 J 5
and argon pressures from 0.5 to 1.5 Pa), strong oscillations in the probe current density are seen 6
with amplitudes up to 60% above a base value. These perturbations, identified as spokes, travel 7
around the discharge above the target in the E×B direction. Using phase information from the 8
angularly separated probes the spoke drift speeds, angular frequencies and mode number have 9
been determined. During each HiPIMS pulse the spoke velocity is seen to increase, from 10
typically 6.5 km s-1 at a time when the total discharge current density approaches its peak value 11
to 10 km s-1 at the end of the pulse. Such an observation is consistent with the assertion of 12
Brenning and Lundin (2012 Phys. Plasmas 19 093505) that spoke velocities correspond to the 13
critical ionization velocity (CIV), which changes as the plasma composition changes. The largest 14
fluctuations in the strip probe signal were observed at an argon pressure of 0.68 Pa and pulse 15
energy of 1.79 J. In this particular case, the temporal angular frequencies vary from 3.2×10⁵ to 16
4.5×10⁵ rad s-1. From the shape of individual current density oscillations, it appears that the 17
leading edge of the spoke is associated with a slow increase in local current density to the target 18
and the rear with a more rapid decrease. The measurements show that the discharge current 19
density associated with individual spokes is broadly spread over a wide region of the target. 20
3 1. Introduction
1
High power impulse magnetron sputtering HiPIMS is gaining interest from the scientific, 2
engineering and industrial communities as an exciting and potentially valuable physical vapour 3
deposition technique for the production of high-quality functional thin films 1. At its heart, 4
HiPIMS is a merger of pulse power and conventional magnetron sputtering technologies which 5
facilitates the production of extremely dense ( 1019 m-3), short lived ( 100 µs) plasmas with a 6
high fraction of the sputtered species arriving as ions at the substrate 2. With target power 7
densities often up to 10 kWcm-2 during the main sputtering phase the typical duty cycles are kept 8
short ( 1%) to prevent overheating of the device. 9
10
HiPIMS systems, as with all sputtering magnetrons, rely on electron trapping in mutually 11
perpendicular electric E and magnetic fields B to provide high ionisation rates at low operating 12
pressures ( 0.1-10 Pa) 3. Typically, with vacuum magnetic fields up to 0.05 T in the magnetic 13
trap, the bulk plasma electrons (of temperature a few eV) can be considered magnetized and 14
therefore execute Hall drifts while the heavy positive ions should be subject only to free fall in 15
the E fields to the target. Any component of fast secondary electrons accelerated in the cathode 16
fall, will execute a cycloid motion with radius of curvature typically less than 10 mm and can 17
also be considered magnetised. This principle of intrinsic electron drift has been studied and 18
exploited in other technological plasmas such as homopolar plasmas 4, Hall thrusters 5, and Q– 19
machines 6 and other linear plasma devices 7. 20
Such configurations, in which considerable azimuthal (Hall) electron current flows against a 21
static background of ions in a closed loop E×B drift channel, are characterised by a great many 22
inherent plasma oscillations and instabilities over a wide range of frequencies, 104 - 1010 Hz 8. 23
These can include, drift wave instabilities 6, modified two-stream instabilities (MTSI) 9 lower-24
hybrid waves 10, as well as, in some discharge conditions, coherent plasma structures which 25
rotate around the discharge in the Hall E×B drift channel 11,12. 26
In HiPIMS, such structures have been observed, and are usually referred to as either bunches 13, 27
spokes 14 or ionization zones 15. They are believed to be regions of higher local plasma density 28
that rotate along the drift channel in the E×B direction at speeds consistent with the critical 29
4
species forming the majority of ions in the plasma 14. Experimental determined spoke velocities 1
(in the range 2 - 10 km s-1) for a range of different HiPIMS target materials and sputtering gases 2
agree well with the predicted CIV speeds 16 and are always about an order of magnitude lower 3
than the E×B electron drift speed 15. With closed loop distances around the racetrack of several 4
tens of cm’s and typical mode numbers m of the instabilities observed from m = 1 to 4, the 5
speeds of such structures correspond to frequencies of several 100’s kHz 17,18
. 6
To study and characterize the detailed nature of spokes in HiPIMS discharges a number of 7
diagnostic techniques have been employed. These include the use of fast intensified cameras 8
(ICCD’s) to determine their shape, mode number, wavelength, rotation speed, and the general 9
conditions of existence for such rotating instabilities 8,13,15,17–21. Other non-perturbing optical 10
techniques including two fiber optical monitoring 18 and optical emission spectroscopy 19 have 11
been used to both observe spoke motion and learn more about the composition of emitting 12
species including Al I, Al II, Ar I and Ar II. 13
14
Electrical probes, operating in either the electron or ion saturation current regions of the 15
characteristic, positioned in the magnetic trap have been used to observe the modulation in the 16
plasma density as spokes intercept the probe 13,22. Such probes, of varying geometry, have also 17
been used in more remote positions to detect long range signatures of the spokes 23. Electrically 18
isolated 18,22 and emissive probes 15 have been used to determine the local fluctuation of the 19
floating and space potentials due to the presence of spokes. However, in some cases the probes 20
themselves can perturb the plasma under observation. 21
22
The existence of spokes has been linked to observations of enhanced ion energies in HiPIMS. 23
Using energy-resolved mass analyzers a number of studies have shown that when such 24
instabilities exist in the plasma (seen by probe detection), there are pronounced extensions in the 25
energy of post-ionized sputtered species arriving at the substrate 24,25 but also remarkably in 26
directions tangential the target 23. 27
28
These observations have led to the idea that associated with the spokes there must be a region of 29
5
differing space charge. This potential structure can accelerate ions (created in the spoke) to 1
higher energies in all directions away from the target 24,25 however enhanced in the direction of 2
spoke rotation 23, with the positive potential structure of the spoke acting like an impenetrable 3
moving wall to on-coming ions 14. 4
5
Conditions for the existence of spokes has been investigated as a function of discharge current 26, 6
applied power 21, target power density 24, and pressure 18. It is found that the mode number m 7
decreases with increased power until a threshold is reached after which no spokes can be 8
identified 21. Increasing pressure slows the spokes velocity 18. 9
10
To prevent a discontinuity of electric potential around the racetrack the spoke itself must consist 11
of two adjacent double layers 27 (actually a triple layer structure as seen in other types of plasmas 12
28
). Such layers consist of three regions of alternating space charge polarity, with a reversal in the 13
internally generated azimuthal electric field components E. These E-fields cross with the 14
vacuum B-field to produce electron drifts across the magnetic field lines, perpendicular to the 15
plane of the spoke motion 14. This phenomenon has been observed using streak cameras 15,29 as 16
the creation of electron flare or jets emanating from the center or possibly the leading edge of the 17
spoke, a region of the spoke where E points in the E×B direction 27. It is conjectured that these 18
flares can carry away a substantial part of the total electron current eventually reaching the 19
grounded walls. Using segmented anodes in a Hall thruster device the electron return current 20
associated with a single spoke was found to be over 50% of the total discharge current 30. Such 21
cross-field electron transport has been associated with the mechanisms behind anomalous 22
electron diffusion seen in Hall thrusters 31; appropriate to all E×B devices which can drive axial 23
two-stream instabilities 14. 24
25
In the triple layer model advocated in 24,25 and updated recently by 27 the azimuthal electric field 26
must also reverse and so azimuthally drifting electrons in the E×B channel entering the rear of 27
the spoke will be directed towards the cathode 27, however, overall the net electron drift from all 28
regions of the target must be to the anode of course. This drift was observed in a PIC–MCC 29
simulation model of a concentric cylindrical homopolar plasma by Boeuf and Chaudhury 12. 30
6
Since it believed spokes are high density regions with higher associated ionization rates it is 1
logical to assume that in HiPIMS (as well as other similar discharges) they give rise to a 2
considerable fraction of the total measured discharge current. This was assumed in the 3
calculations of ion current to the target from spokes in 13 as well as the basis for the electron 4
current flowing in the opposite direction towards ground (vessel walls) through flare formation 25 5
as discussed above. 6
7
Plasma parameters such electron temperature and density associated with the spokes have been 8
obtained in Hall Thrusters 30 using flush mounted planar probes, however, such measurements 9
with electrical probes in HiPIMS are problematic, for instance they can potentially destroy the 10
phenomena to be measured, and the probes themselves can accumulate a considerable amount of 11
deposit on the tips, corrupting their operation. Here we do not attempt to measure the plasma 12
parameters within spokes themselves, however employ an array of electrical probes (strips) 13
forming a segmented target to measure directly the distribution of current sourced from 14
individual spokes as they rotate around the racetrack. The strip probes, made of the target 15
material, were mounted flush to the target surface, making them indistinguishable from the rest 16
of the target as far as the plasma is concerned. Using this arrangement, we also measure the 17
spoke velocities, mode number and azimuthal profile (shape) during the HiPIMS pulse. 18
19
2. Experimental setup 20
All experiments were conducted in a purpose-built cylindrical vacuum vessel, 300 mm in length 21
and 260 mm in diameter, pumped down to a base pressure of 6.510-4 Pa using a turbo molecular 22
pump backed by a rotary pump. Argon was introduced into the vessel with flow rates ranging 23
from 4 to 32 sccm (standard cubic centimeter per minute) to vary the operating pressure between 24
0.27 Pa – 2.4 Pa. The operating pressure and flow rates were determined and controlled using a 25
capacitance pressure gauge (MKS 628A) and a mass flow controller (MKS 1179A), respectively. 26
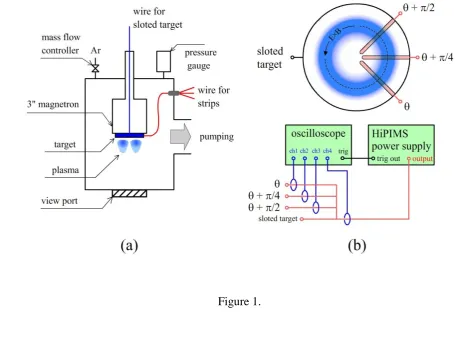
The general chamber configuration is shown in figure 1a. 27
The magnetron used in this study was a circular unbalanced type, equipped with a 75 mm 28
diameter aluminum target of 5.53 mm thickness and 99.995% purity. The magnetic field strength 29
7
To strike HiPIMS plasmas an in-house built power supply was used, providing a peak current of 1
60 A 32. In this study the supply was operated at a repetition rate of 3 Hz and a pulse width of ~ 2
70 µs providing energies up to 2.15 J per pulse. 3
In order to measure the target current locally as the spokes rotate above it, the target was 4
segmented, with the introduction of three 2.14 0.02 mm wide flush-mounted aluminum strip 5
probes (same purity as the target) placed in machined slots at 3 angular positions (45o from each 6
other) around the target, see figure 1b. The three strip probes filled the entire target radius and 7
extended past the target edge by 5 mm to allow electrical connections. The stripe probes were 8
electrically isolated from the rest of target by a thin layer of polyimide tape of thickness of 0.07 9
0.01 mm, placed around 3 sides of the probe, it provided a tight fit. This insolation thickness 10
defined the gap wgap between the strip probe and the target.
11
We argue that, from a plasma perspective, the stripe probes are indistinguishable from the rest of 12
the target provide wgap is smaller than both the cathode sheath thickness s and the gyro-radius reL
13
of bulk electrons and secondary electrons emitted from the target. From the literature 33, we can 14
take the electron densities and temperatures close to the target to be ne 1019 m-3 and (kBTe)/e
15
3 eV respectively. With a cathode fall voltage of V0 500 V and magnetic field strength B 80
16
mT we calculate s 0.15 mm 34 and reL 0.94 mm 35, satisfying the conditions wgap < s and wgap
17
< reL. The gyro radii of high-energy electrons accelerated to a fraction of the cathode fall
18
potential (>> kTe) will strongly satisfy the condition wgap < reL.
19
The three strip probes were connected directly the power supply as shown in figure 1b. In this 20
configuration they always remained at the same potential as the target, but with their contribution 21
to the total current measured separately using Pearson current probes (Model 2877 with 1V/A). 22
The total target current, Id, was measured using a larger Pearson probe (Model 3972 with
23
0.1V/A). The four current waveforms were recorded using a digital oscilloscope (Tektronix DSP 24
3030D with 300 MHz bandwidth) in a single short mode if not otherwise stated. The discharge 25
voltage waveforms Vd were measured separately using a high voltage probe (Tektronix P5100).
26
The area of each individual strip probes and whole target (including the probes) were calculated 27
to be Ap 0.61 cm2 and Ad 44.18 cm2 respectively. Together with the measured currents from
8
the strips Ip and the total target current Id it is possible then to determine the respective current
1
densities jp and jd. However, to accurately compare jp and jd (as we do in the first part of section
2
2), it is important that these measurements agree in “spoke-free” conditions. Since the strip 3
probes are rectangular in shape and inserted into essentially circular geometry and that they 4
overhang the target at the edges to allow electrical connections, we cannot guarantee any “ridged 5
body” plasma structure moving above them will see exactly the same proportion of their entire 6
areas Ap and Ad. So, to effectively calibrate the strip probes, we ran the magnetron over a range
7
of DC conditions (pAr = 0.78 Pa, 100 W < power < 300 W) in which no spokes were observed,
8
and calculated the current densities jp and jd. This provided us with an effective area ratio of
9
Ap/Ad ~ 0.0170, 20 % higher than the geometric areas. One such note that although no spokes
10
were observed here in DC conditions, the signature of spokes have indeed been detected in DC 11
sputtering elsewhere 36 . The conditions required to generate spokes in non-HiPIMS plasmas are 12
yet to be properly investigated. 13
14
Since the strip probes were isolated from the target, effective cooling of the probes over long 15
durations was problematic. To prevent overheating of the probes we used a very low frequency 16
of 3 Hz, while still applying high peak powers. With low associated duty cycles it was necessary 17
to use an auxiliary pre-ionizer source 32 in conjunction with the HiPIMS unit to easy breakdown 18
on each new pulse. Measurements of jp taken at the beginning and end of long periods of
19
operation showed no differences, indicating that if any overheating did occur, it did not affect the 20
results. 21
22
3. Results and Discussion 23
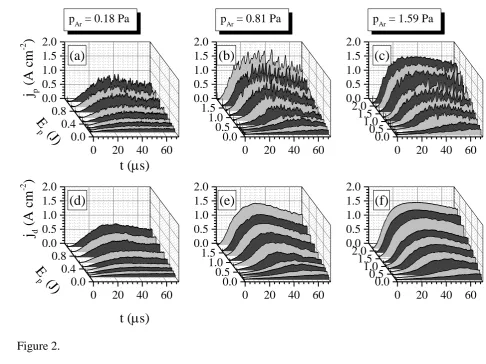
Figure 2 shows simultaneous measurements of the current density at a strip probe jp and the
24
current density to the whole target (which includes the strip probe) jd. We have restricted
25
ourselves to observations in the driven phase of a number of different HiPIMS discharges for a 26
variation of pulse energies Ep (0.15 to 2.2 J) and gas pressures pAr (0.18 to 1.59 Pa). For this
27
particular part of our investigations, it was necessary to use the effective area ratio calibration as 28
9
The data was obtained using the probe marked at angle = 0 in figure 1b. Under certain 1
conditions we observe strong oscillations in jp which we attribute to the existence of coherent
2
spoke structures. At the low pressures (pAr = 0.18 Pa) and low pulse energies (Ep < 0.5 J),
3
oscillations appear somewhat chaotic with irregular and non-periodic peaks and valleys during 4
the pulse. However, as the discharge energy is increased more coherent periodic structures 5
develop with oscillation amplitudes growing monotonically with Ep. There appears to be a
6
threshold in Ep for coherent spokes to form that decreases with increases in pressure. For
7
example, in figure 2b and 2c we see at pAr = 0.81 Pa a threshold value of Ep 1 J, however this
8
decreases to Ep = 0.6 J at = 1.59 Pa.
9
The largest amplitude in the jp oscillations (seen at Ep = 1.8 J, pAr = 0.81 Pa) is about 45% above
10
the base level (the jp values of in the valleys) at 30 - 40 μs into the pulse (figure 2b). In contrast
11
to the strip probe measurements, the total discharge current density jd measurements at any
12
operating condition show little or no perturbations. This can be expected, since the current 13
contribution from any non-changing structure moving around the whole target will yield no 14
temporal dependency in the Id measurement. The very small oscillations seen in jd, discernable in
15
figure 2b and reported in the discharge current elsewhere 24, may be due to the temporal 16
evolution of the spoke plasma parameters in the frame of reference rotating with the spokes. 17
Although we have no optical imaging evidence for spokes in this study, the lack of oscillations in 18
jd but strong oscillations in the jp measurements gives us confidence we are observing moving
19
plasma structures passing over our strip probe and not any kind superimposed signal from the 20
plasma-power supply network. 21
22
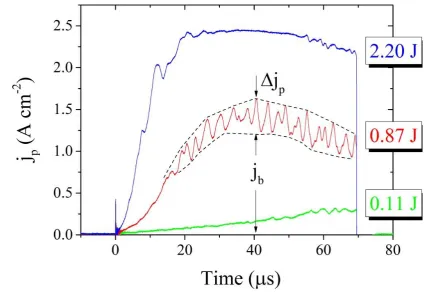
To illustrate that the presence of spokes is conditional on the discharge energy Ep and to allow us
23
to see in detail the form of the jp oscillations, measurements for three discharge conditions have
24
been made and are shown in figure 3. Here we choose pulse energies Ep of 0.11, 0.87 and 2.20 J
25
at a single operating pressure of pAr 1.30 Pa.
26
During the early part of the pulse at low pulse energy, (t < 30 s, Ep= 0.11 J) we see no signature
27
of spokes in the jp traces. This is in agreement with fast imaging evidence from other HiPIMS
28
10
energy, we can observe a fluctuation in the strip current waveform from about 40 µs to 65 µs 20. 1
Increasing the pulse energy to Ep = 0.87 J reveals strong oscillations in jp. It also seems clear that
2
in the early part of the pulse (i.e. at low discharge current) the plasma is homogeneous, which 3
has been seen elsewhere 20. Here, strong oscillations in jp start at t 15 µs and remains
4
throughout the pulse. In figure 3 the dashed lines represent an effective oscillation envelop 5
within which the peak-to-valley amplitude of the oscillation jp, can be determined. We define
6
the bottom of the valley as the base current jb. For example, at t 40 s, jp 0.39 A cm-2,
7
which corresponds to about 32% of the base current density (jb 1.20 Acm-2). The ratio jp/jb
8
varies during the pulse, rising to a plateau of ~ 0.32 at t ~ 40 s, persisting up to the end of the 9
pulse. At the highest pulse energy condition, Ep 2.20 J, oscillations are significantly attenuated
10
with jp 0, particularly during times of peak discharge current Id (t 3040 s).
11
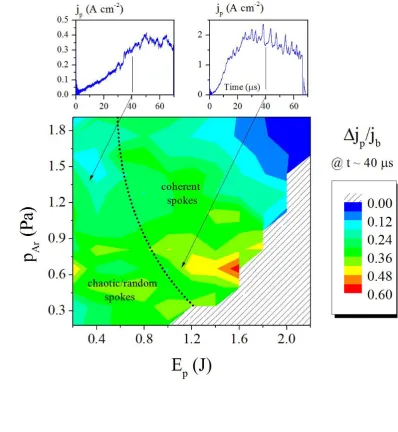
The peak-to-valley strip probe current densities normalized to the base current (valley) jp/jb are
12
shown in figure 4. The measurements were obtained at one particular time during the pulse (t 13
40s) and are mapped out as a function of pulse energy and operating pressure. The maximum 14
value of jp/jb is 0.6 at Ep 1.60 J and pAr 0.7 Pa. In figure 4, we represent an approximate
15
boundary which separates two regions, one where spokes appear to be chaotic and one where 16
they are coherent. It is at low Ep (typically < 1 J) where chaotic behavior is generally observed as
17
reported by Winter et al 8. 18
One should note that due to limitations in the power supply some operating parameters could not 19
be attained and these are represented by the shaded region in figure 4. Despite this experimental 20
limitation the contour plot does clearly reveal regions where spokes are chaotic, coherent and 21
non-existent. Our observations are in general agreement with those obtained using fast optical 22
imaging 21 to investigate spoke structural evolution. 23
The mechanism determining spoke formation is unknown but it appears that at low power only 24
chaotic structures are observed and their amplitude is largely independent of pressure. However, 25
once coherent spokes are created pressure plays a key role in determining the current oscillation 26
amplitude above its base value. It is argued that collective behavior such as spoke formation is a 27
result of insufficient ion production, with structures moving to seek regions of enhanced 28
11
Individual spokes may merge to form a single continuous structure 21, possibly maintaining a 1
reversal in axial electric field (potential fill) but with no azimuthal component. Increased 2
pressures may provide the necessary sustainment and hence reduced spoke current amplitudes. 3
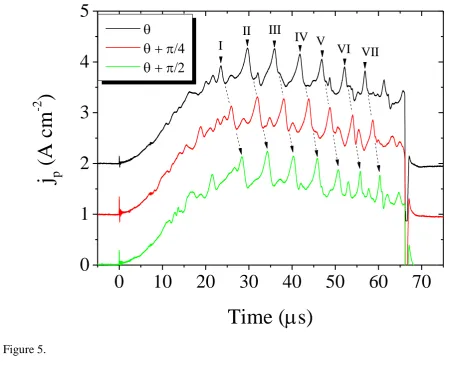
To gain information on the speeds of the spokes and their mode number jp measurements were
4
made simultaneously at three strip probes at = 0, /4 and /2. An example taken for the case Ep
5
1.79 J and pAr 0.68 Pa is shown in Figure 5. The jp waveforms have been stacked (with a
6
vertical increment of jp = 1 Acm-2) to allow the phase information to be seen clearly. The jp
7
oscillations between probes are coherent in terms of shape, amplitude and period but phase 8
shifted (a time lag ) with increasing . This demonstrates the existence of essentially coherent 9
(and rigidly-formed) current perturbations, (ionization zones) rotating in the anticlockwise E×B 10
direction. In the particular case chosen, over the driven part of the discharge, we can identify 11
seven distinct oscillation packages as labelled I to VII in figure 5. To calculate the spoke angular 12
frequency, and tangential speed, v at the racetrack center (radius rc21.5 ± 0.5 mm) average
13
time delays avg in the peaks have been used. We define avg = (AB + BC)/2, where AB and BC is
14
the time delay between probes A and B and probes B and C, respectively. The spoke speed 15
calculations are summarized in table I. 16
From the average period of oscillation Tavg and the time lag avg data the mode number m can be
17
determined as m = (2πavg)/(Tavg). In our chosen operating condition (pAr ~ 0.68, Ep ~ 1.79 J),
18
we find values of m between 2.8 and 3.1 giving us confidence that we have m = 3. 19
It is known from the literature that the mode number may vary with operating conditions, for 20
instance with higher m observed for increased pressure (for Ti) 18, increasing from m = 1 to a 21
more fragmented situation with m > 4. The mode number tends to decrease with increasing 22
discharge current as seen in the sputtering of Mo 21 and Al 20 targets. Over all the conditions in 23
this study we find predominately m = 3. At certain conditions the m = 4 can be identified (for 24
instance at pAr =1.6 Pa and Ep = 0.8 J). We do not observe the large m = 1 structure even at low
25
powers (when spokes exist) as observed with Al targets elsewhere 22. 26
It is interesting that in similar conditions to ours (pAr = 0.27 Pa and jd > 1.8 A cm-2) with an Al
27
target the m = 4 mode rather than m = 3 is seen 20. More work is needed to understand the form 28
12
The tangential speeds shown in Table I, lying between 6.95 and 9.79 km s-1 agree well those seen 1
in other HiPIMS discharges with Al targets 15. We observe that for conditions when spokes 2
actually occur, their speed increases during the HiPIMS pulse, for instance from 6.95 km s-1 (t 3
2230 s) to 9.76 km s-1 (t 5660 s) as seen in figure 5 for Ep 1.79 J and pAr 0.68 Pa.
4
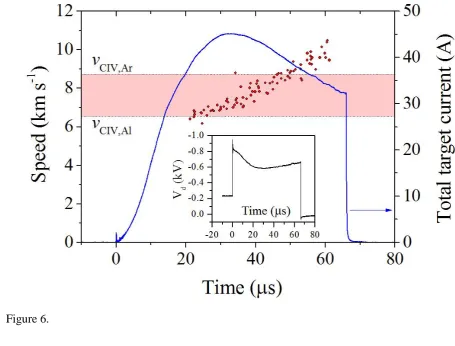
To determine any gross trends in the spoke speed v during the evolving HiPIMS pulse, the speed 5
of individual spokes has been calculated over ten identical HiPIMS pulses and plotted as a 6
function of time in figure 6. This has been done for only one discharge operating condition (Ep
7
1.79 J and pAr 0.68 Pa) but the same trends are seen at different conditions for which spokes
8
exist. 9
We see that as the pulse progresses v increases from about 6.5 to 10 km s-1. This increase can 10
partly be understood from a change in composition of the plasma. It is postulated that spoke 11
speeds adhere to the critical ionization velocity CIV hypothesis 16, with the CIV speed given by 12
𝑣𝐶𝐼𝑉= √2𝑒𝑈𝑖
𝑚𝑛, where Ui is the ionization potential and mn is the mass of the species being ionized 13
with e the elementary charge. As the discharge builds up and certainly at times close to the peak 14
discharge current we expect the discharge to be dominated by Al giving a CIV velocity vCIV,Al =
15
6.5 km s-1. However towards the end of the pulse we conjecture that argon replaces the Al 16
particles and the CIV velocity will therefore increase to vCIV,Ar = 8.7 km s-1. The results in figure
17
6 suggest such a trend as the weighted mass mn and effective Ui value change with composition.
18
The CIV limits for the two species are shown in figure 6. For times greater than 50 µs our 19
calculated spoke velocities exceed the CIV velocity for Ar. One possible explanation for this is 20
that as the spoke evolves in time its’ average radial position (as well as shape) may change. If the 21
spokes average radius (correlated with the position of maximum current) were to reduce by about 22
3 mm our calculated velocities would always be limited to vCIV.Ar. Our estimated spoke velocities
23
compare well to those obtained in other HiPIMS plasmas with Al targets, for instance a velocity 24
of 8.1 ± 0.3 km s-1determined by fast camera imaging 15. 25
This argument of changing composition is consistent with measurements made using time-26
resolved tunable diode-laser adsorption 37, where Ar depletion was found to occur at the peak of 27
13
spoke speeds, so we are unable to demonstrate that spoke speeds are consistent with the vCIV.Ar
1
velocity as we would expect this stage in the discharge before Al becomes the dominant species. 2
From observation of the time profile in jp (as a spoke passes over a probe) useful information on
3
the spoke structure can be obtained. From figure 5 taking a representative spoke (peak II at probe 4
position + π/2) between 30 and 35 s we see at the front of the spoke there is a relatively slow 5
two-stage rise in jp (slew rates ~7.8×10⁴ and ~3.5 x10⁵ A cm-2 s-1) to a peak value followed a
6
more rapid fall (~6.7 ×10⁵ A cm-2 s-1). This profile is wholly consistent with an elongated 7
(triangular) shape as reported in the literature for spokes above an aluminum target 20,22 in which 8
the apex of the spoke is pointed in the E×B direction, followed by a sharp trailing edge. This 9
edge is aligned with the direction of the radial magnetic field lines, connecting the inner and 10
outer magnetic pole pieces. This profile also fits with electrical probe data of the signatures of 11
spokes 22 where the bulk of the evidence suggests that spokes are characterized by a gradual rise 12
(in density, potential, current) in the leading edge but a faster decrease at the rear. 13
14
Inspection of figure 5 shows very little gap (or time lags) between individual spokes. It was 15
expected that we would see a considerably lower current density between discrete spokes 16
representing a background of weaker homogeneous plasmas. It appears however that the spoke 17
structures are smeared out in the azimuthal direction almost merging nose-to tail but with each 18
spoke characterized by a region of high current densities (40-50% higher than at the periphery of 19
the spokes). 20
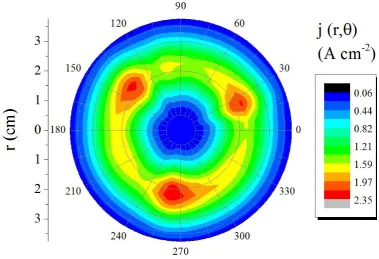
21
To demonstrate this we have attempted to display the current density data in 2D as done for 22
optical signals obtained from fast imaging. This can be achieved by transforming the temporal 23
distribution jp (t) to an angular distribution jp() and convolving it with a Guassian radial
24
distribution to artificially add radial information. We choose a Guassian function G(r) = A exp (-25
(r-r0)2/L2), where r0 ( = 21.5 mm) is the radius of racetrack center, L (= 10 mm) is an assumed
26
mean radial width of the spokes, and A is a scaling constant to be calculated. Although we have 27
no radial measurements of jp in this study, the invoked Guassian representation of jp(r) centered
28
on the middle of the racetrack 38 is sufficient to produce a realistic 2-D distribution of target 29
14
(probe at + π/2) over one period T from 30 to 47 s. To ensure our function j(θ, r) provides the 1
correct measured discharge current Id it must satisfy the condition
2 3
∬ 𝑗(𝜃, 𝑟)𝑟 𝑑𝜃 𝑑𝑟 = 𝐼𝑑
2𝜋,𝑅
0,0
4
Where j(θ, r) = G(r)jp() and R is the target radius. Here the target current Id is averaged over the
5
same time period (30 t 47 s) as the jp(t) was collected. Performing the integral yielded, in
6
the particular case chosen, a scaling constant A = 1.3. 7
8
It is interesting that in figure 7 our constructed map of j(θ, r) is very much consistent in form to 9
optical emission fast imaging 20,22. However due to the lack of real radial information it cannot 10
reproduce for instance a triangular form to the spoke as often seen optically. It seems clear 11
however that spokes do carry a considerable fraction of the discharge current since their 12
elongated structure occupies and significant area of the target in the racetrack region. In the case 13
displayed the peak current density at the spokes center is highly localized and has a current 14
density ~ 43 % greater than that in the racetrack minimum. Future studies using radial separated 15
target probes will yield accurate radial information allowing accurate 2D current density maps to 16
be constructed. 17
18
4. Conclusions 19
Using a segmented target the current densities associated with rotating spokes in a HiPIMS 20
discharge have been investigated. Spokes are identified as regular perturbations in local 21
discharge current density with peak values up to 50 % higher than the valley currents. Generally, 22
as the energy of the HiPIMS pulse is increased the spokes change their nature, moving from 23
chaotic behavior to form coherent regular structures. At our highest pulse energies spokes are 24
15
The spokes have been found to have an elongated leading edge and sharper trailing edge, and 1
travel with velocities increasing from 6.5 to 10 km s-1 as the HiPIMS pulse develops. These 2
velocities are consistent CIV predictions. 3
The time signature of spoke current densities show that spokes are effectively smeared out to 4
cover a larger area of the racetrack leaving no discrete gaps in between them. Assuming a 5
realistic radial distribution of current density, a 2D map of the target current density j(,r) has 6
been constructed, showing a general distribution consistent with fast optical imaging of spokes in 7
other studies. 8
Further investigations using our method is planned to include the use of radially distributed 9
segments to provide information of the radial current density distribution. In addition, the 10
combined use of fast optical imaging and target probes will allow advances in the understanding 11
of spoke creation and sustainment for a variety of different target materials. 12
13
Acknowledgements 14
Phitsanu Poolcharuansin acknowledges support by Mahasarakham University, Thailand and 15
University of Liverpool, UK for his short-term postdoctoral fellowships. Francis Lockwood 16
Estrin would like to thank the University of Liverpool for his studentship funding, as part of the 17
Engineering and Physical Sciences Research Council (EPSRC) Fusion Doctoral Training 18
Network EP/K504178/1. He also wishes to thank the STFC, AsTEC Group, Daresbury, UK for 19
their funding support and Dr. Reza Valizadeh and Dr. Oleg Malyshev of the same for their 20
advice and encouragement. 21
22
23
24
25
16 Figure Captions
1
Fig. 1: Schematic diagrams of (a) the magnetron and chamber set-up and (b) the strip probes and 2
current measuring arrangements. 3
Fig. 2: (a), (b) and (c) time traces of the current density, jp, measured by a strip probe, (d), (e)
4
and (f) time traces of the total target current density, jd, for a number of pulse energies Ep and
5
argon pressures, pAr of 0.18, 0.81 and 1.59 Pa.
6
Fig. 3: The strip probe current densities jp for a number of pulse energies at pAr = 1.30 Pa. The
7
marked envelop (dashed lines) is used as a guide to calculate the amplitude (Δjp) of the
8
oscillation in jp above the running minimum value jb.
9
Fig. 4: A contour plot of Δjp/jb , the ratio of Δjp normalized to the base current density jb, at time
10
t = 40 μs for a range of pulse energies Ep and argon pressures pAr. The hatched region represents
11
an area inaccessible to experiment due to power supply limitations. The dotted line represents the 12
approximate boundary between chaotic and coherent spoke behavior. 13
Fig. 5: The strip probe current density time traces for Ep = 1.79 J and pAr = 0.68 Pa. The traces
14
are stacked (incremented by 1 A cm-2 to allow the phase relationship to be seen). The rapid, 15
short-lived, negative current observed at the end the pulse is thought to be the result of finite 16
inductance of strip probe assembly and connecting lines. 17
Fig. 6: A plot of spoke velocities through a HiPIMS pulse, calculated from the time lags in the 18
waveforms between the azimuthally separated strips. The data was recorded over ten HiPIMS 19
pulses for Ep = 1.79 J and pAr = 0.68 Pa. The target current and voltage for this discharge are
20
also shown. 21
Fig. 7: A 2D reconstruction of the target current density using measured azimuthal data 22
combined with an assumed Guassian radial current density distribution, of the form G= A exp (-23
(r-r0)2/L2). The azimuthal data was obtained for pAr ~ 0.68 Pa, Ep ~ 1.79 J, and for spokes passing
24
a single strip in the time period 30 - 47 s. 25
17
Table I: The time lags between neighboring strips τAB, BC and their average value τavg, angular
1
frequency ω and the tangential speed v at the racetrack center for each ionization zone identified 2
in figure 5. 3
18 References
1
1
D. Lundin and K. Sarakinos, J. Mater. Res. 27, 780 (2012). 2
2
J.T. Gudmundsson, N. Brenning, D. Lundin, and U. Helmersson, J. Vac. Sci. Technol. A 3
Vacuum, Surfaces, Film. 30, 030801 (2012). 4
3
A. Anders, Surf. Coatings Technol. 205, S1 (2011). 5
4
P.B. Barber, D. a Swift, and B. a Tozer, J. Phys. D. Appl. Phys. 5, 693 (1972). 6
5
V. V Zhurin, H.R. Kaufman, and R.S. Robinson, Plasma Sources Sci. Technol. 8, R1 (1999). 7
6
H.L. Pecseli, T. Mikkelsen, and S.E. Larsen, Plasma Phys. 25, 1173 (1983). 8
7
A.E. Shumack, H.J. de Blank, J. Westerhout, and G.J. van Rooij, Plasma Phys. Control. Fusion 9
54, 125006 (2012). 10
8
J. Winter, A. Hecimovic, T. de los Arcos, M. Böke, and V. Schulz-von der Gathen, J. Phys. D. 11
Appl. Phys. 46, 084007 (2013). 12
9
D. Lundin, P. Larsson, E. Wallin, M. Lattemann, N. Brenning, and U. Helmersson, Plasma 13
Sources Sci. Technol. 17, 035021 (2008). 14
10
D. Lundin, U. Helmersson, S. Kirkpatrick, S. Rohde, and N. Brenning, Plasma Sources Sci. 15
Technol. 17, 025007 (2008). 16
11
E.Y. Choueiri, Phys. Plasmas 8, 1411 (2001). 17
12
J.P. Boeuf and B. Chaudhury, Phys. Rev. Lett. 111, 1 (2013). 18
13
A. V. Kozyrev, N.S. Sochugov, K. V. Oskomov, a. N. Zakharov, and a. N. Odivanova, Plasma 19
Phys. Reports 37, 621 (2011). 20
14
N. Brenning, D. Lundin, T. Minea, C. Costin, and C. Vitelaru, J. Phys. D. Appl. Phys. 46, 21
084005 (2013). 22
15
A. Anders, P. Ni, and A. Rauch, J. Appl. Phys. 111, 053304 (2012). 23
16
N. Brenning and D. Lundin, Phys. Plasmas 19, 093505 (2012). 24
17
A.P. Ehiasarian, A. Hecimovic, J. Winter, T.D.L. Arcos, R. New, V.S. Der Gathen, and M. 25
Böke, IOP Conf. Ser. Mater. Sci. Eng. 39, 012012 (2012). 26
18 A.P. Ehiasarian, A. Hecimovic, T. de los Arcos, R. New, V. Schulz-von der Gathen, M. Böke,
27
19
19
J. Andersson, P. Ni, and A. Anders, Appl. Phys. Lett. 103, 054104 (2013). 1
20
A. Anders, Appl. Phys. Lett. 100, 224104 (2012). 2
21
T.D.L. Arcos, V. Layes, Y.A. Gonzalvo, V.S. Der Gathen, a Hecimovic, and J. Winter, J. 3
Phys. D. Appl. Phys. 46, 335201 (2013). 4
22
a Hecimovic, M. Böke, and J. Winter, J. Phys. D. Appl. Phys. 47, 102003 (2014). 5
23
M. Panjan, R. Franz, and A. Anders, Plasma Sources Sci. Technol. 23, 025007 (2014). 6
24
C. Maszl, W. Breilmann, J. Benedikt, and a von Keudell, J. Phys. D. Appl. Phys. 47, 224002 7
(2014). 8
25
A. Anders, M. Panjan, R. Franz, J. Andersson, and P. Ni, Appl. Phys. Lett. 103, 144103 9
(2013). 10
26
T.D.L. Arcos, R. Schröder, Y.A. Gonzalvo, V.S. Der Gathen, and J. Winter, Plasma Sources 11
Sci. Technol. 23, 054008 (2014). 12
27
A. Anders, Appl. Phys. Lett. 105, 244104 (2014). 13
28
G. Petraconi and H.S. Maciel, J. Phys. D. Appl. Phys. 36, 2798 (2003). 14
29
P. a. Ni, C. Hornschuch, M. Panjan, and A. Anders, Appl. Phys. Lett. 101, 224102 (2012). 15
30
C.L. Ellison, Y. Raitses, and N.J. Fisch, Phys. Plasmas 19, 013503 (2012). 16
31
G.S. Janes, Phys. Fluids 9, 1115 (1966). 17
32
P. Poolcharuansin, B. Liebig, and J. Bradley, in IEEE Trans. Plasma Sci. (2010), pp. 3007– 18
3015. 19
33
A. Anders, J. Andersson, and A. Ehiasarian, J. Appl. Phys. 102, 113303 (2007). 20
34
A.J.L. Michael A. Lieberman, Principles of Plasma Discharges and Materials Processing 21
(John Wiley & Sons, Inc., 2005). 22
35
A. Rauch and A. Anders, Vacuum 89, 53 (2013). 23
36
A. Anders, P. Ni, and J. Andersson, IEEE Trans. Plasma Sci. 42, 2578 (2014). 24
37
C. Vitelaru, D. Lundin, G.D. Stancu, N. Brenning, J. Bretagne, and T. Minea, Plasma Sources 25
Sci. Technol. 21, 025010 (2012). 26
38
20 Figures
1
2
3
Figure 1. 4
[image:20.612.66.522.118.476.2]21 1
Figure 2. 2
0 20 40 60 0.0 0.5 1.0 1.5 2.0 0.8 0.4 0.0
E
p
(J)
j
p(
A c
m
-2
)
t (
s)
(a)
0 20 40 60 0.0 0.5 1.0 1.5 2.0 1.5 1.0 0.5 0.0
(b)
pAr = 0.81 Pa
0 20 40 60 0.0 0.5 1.0 1.5 2.0 2.0 1.5 1.0 0.5 0.0
(c)
pAr = 1.59 Pa
0 20 40 60 0.0 0.5 1.0 1.5 2.0 0.8 0.4 0.0
(d)
pAr = 0.18 Pa
j
d(
A c
m
-2)
E
p
(J)
t (
s)
0 20 40 60 0.0 0.5 1.0 1.5 2.0 1.5 1.0 0.5 0.0
(e)
22 1
23 1
2
3
[image:23.612.59.458.73.506.2]24 1
Figure 5. 2
3
0
10
20
30
40
50
60
70
0
1
2
3
4
5
j
p(A c
m
-2
)
Time (
s)
VII [image:24.612.69.520.75.444.2]25 1
Figure 6. 2
3
[image:25.612.66.522.74.420.2]26 1
Figure 7. 2
3
4
5
6
7
8
9
10
11
12
[image:26.612.118.498.73.332.2]27 1
Peak AB (s)
BC
(s) avg
(s)
(rad s-1)
v (km s-1)
I 2.45 2.41 2.43 3.23×10⁵ 6.95
II 2.29 2.36 2.33 3.37×10⁵ 7.26
III 2.13 2.27 2.20 3.57×10⁵ 7.68
IV 2.04 2.02 2.03 3.87×10⁵ 8.32
V 1.96 1.91 1.94 4.05×10⁵ 8.73
VI 1.80 1.86 1.83 4.29×10⁵ 9.23
VII 1.67 1.78 1.73 4.54×10⁵ 9.79
2
Table 1 3