Copyright © 1999, American Society for Microbiology. All Rights Reserved.
Visualization of Alternative Epstein-Barr Virus Expression Programs
by Fluorescent In Situ Hybridization at the Cell Level
ANNA SZELES,* KERSTIN I. FALK, STEPHAN IMREH,
ANDGEORGE KLEIN
Microbiology and Tumor Biology Center, Karolinska Institute, Stockholm, Sweden
Received 15 December 1998/Accepted 23 February 1999
Epstein-Barr virus (EBV) transforms human B lymphocytes into immortalized lymphoblastoid cell lines
(LCLs). They regularly express six virally encoded nuclear proteins (EBNA1 to EBNA6) and three membrane
proteins (LMP1, LMP2A, and LMP2B). In contrast, EBV-carrying Burkitt lymphoma (BL) cells in vivo and
de-rived type I cell lines that maintain the BL phenotype express only EBNA1. During prolonged in vitro culturing,
most EBV-carrying BL lines drift toward a more immunoblastic (type II or III) phenotype. Their viral antigen
expression is upregulated in parallel. We have used fluorescent in situ hybridization to visualize viral
tran-scripts in type I and III BL lines and LCLs. In type I cells, EBNA1 is encoded by a monocistronic message that
originates from the Qp promoter. In type III cells, the EBNA1 transcript is spliced from a giant polycistronic
message that originates from one of several alternative Wp or Cp promoters and encodes all six EBNAs. We
have obtained a “track” signal with a
Bam
HI W DNA probe that could hybridize with the polycistronic but not
with the monocistronic message in two type III BL lines (Namalwa-Cl8 and MUTU III) and three LCLs (LCL
IB4-D, LCL-970402, and IARC-171). A
Bam
HI K probe that can hybridize to both the monocistronic and the
polycistronic message visualized the same pattern in the type III BLs and the LCLs as the
Bam
HI W probe.
A positive signal was obtained with the
Bam
HI K but not the
Bam
HI W probe in the type I BL lines MUTU
I and Rael. The RNA track method can thus distinguish between cells that use a type III and those that use
a type I program. The former cells hybridize with both the W and the K probes, but the latter cells hybridize
with only the K probe. Our findings may open the way for studies of the important but still unanswered
ques-tion of whether cells with type I latency arise from immunoblasts with a full type III program or are generated
by a separate pathway during primary infection.
The spatial organization of nuclear components
participat-ing in functions like DNA replication, transcription, RNA
pro-cessing, and nuclear RNA transport has been increasingly
clar-ified by fluorescent in situ hybridization (FISH) techniques
(19, 25, 27).
In order to visualize the target site by in situ hybridization,
the target sequence has to be represented in a sufficiently high
concentration to provide a good contrast against
signal-nega-tive regions. The nuclear abundance and spatial configuration
of pre-mRNA are likely to depend on the position of the gene,
size of the primary transcript, extent of processing, and level of
transcription (2). Specific RNA transcripts could be localized
in cell nuclei in earlier studies. Lawrence et al. (17) detected
transcripts of integrated EBV genomes as “tracks” in Namalwa
cell nuclei. They extended between the interior of the nucleus
and the nuclear membrane and were conserved in a nuclear
matrix preparation (32). Specific transcripts could be detected
in the form of nuclear tracks in other systems as well (4, 10, 25,
34). They were not always in contact with the nuclear envelope,
however, raising doubts about their postulated involvement in
RNA transport to nuclear pores. It has been speculated that
they may represent RNA accumulation sites that emit
pro-cessed transcripts on their way to the cytoplasm by diffusion (4,
16, 30, 33).
In this study, we have visualized Epstein-Barr virus (EBV)
transcripts in B-cell-derived human cell lines known to carry
integrated and/or episomal EBV genomes. At least three
pro-grams of viral gene expression have been demonstrated for
latently EBV-infected B cells (14). EBV-transformed
noblasts (lymphoblastoid cell lines [LCLs] in vitro and
immu-noblasts in vivo) use the latency III program, expressing nine
virally encoded proteins (EBNA1 to EBNA6 and LMP1,
LMP2A, and LMP2B). The latency I (EBNA1 only) program
is used by Burkitt lymphoma (BL) biopsy cells and BL-derived
cell lines as long as they maintain a tumor-representative
phe-notype (28). In the course of prolonged in vitro culturing, BL
cells may drift to a more immunoblastic (type II or III)
phe-notype, with concomitant switching to a type III program (12).
Type I latency is also found in EBV-carrying resting B cells in
healthy individuals (3).
Latency II (expression of EBNA1 and the LMPs) is
charac-teristic of EBV-carrying non-B cells, such as Reed-Sternberg
cells in Hodgkin’s disease, T-cell lymphomas, and
nasopharyn-geal and other EBV-carrying carcinomas (5, 9, 23). Freshly
infected B cells undergo blast transformation by using the type
III program. This is a prerequisite for viral immortalization.
The developmental history of latently infected normal B
cells is one of the major remaining puzzles of EBV strategy.
One possibility is that they are already generated during
pri-mary infection. Conceivably, a small minority of the infected
cells may fail to follow the immunoblastic activation program,
giving rise to a differently regulated subpopulation of latently
infected cells. According to a more likely alternative, a certain
function of the activated immunoblasts may change to resting
cells by a phenotypic switch that may be identical with, or akin
to, the formation of B memory cells. If so, even proliferating
EBV-carrying lymphoblastic lines may generate resting B cells
and concomitantly downregulate the type III to the type I
program.
In order to visualize individual cells that use different viral
expression programs, we wished to explore whether the FISH
* Corresponding author. Mailing address: Microbiology and Tumor
Biology Center, Karolinska Institute, Box 280, Doctorsringen 13, S-171
77, Stockholm, Sweden. Phone: (46) 8 728 6770. Fax: (46) 8 33 04 98.
E-mail: [email protected].
5064
on November 9, 2019 by guest
http://jvi.asm.org/
method could be used to distinguish between the Wp- or
Cp-initiated, immunoblast-specific polycistronic EBNA1 to -6 (type
III) program and the Qp-initiated, monocistronic EBNA1 only
(type I) program. We found that the RNA track method
per-mits such a distinction.
MATERIALS AND METHODS
(i) Cell culture and nuclear preparation.Cell lines and their characteristics are listed in Table 1. LCL-970402 was a kind gift of La´szlo´ Sze´kely (Microbiology and Tumor Biology Center [MTC], Karolinska Institute [KI], Stockholm, Swe-den). All cell lines were grown in RPMI medium with 10% fetal calf serum (Gibco, Grand Island, N.Y.) at 37°C. Interphase nuclei and metaphase chromo-somes were analyzed on standard cytogenetic preparations, as previously
de-scribed (17). Cells were incubated with 0.015mg of Colcemid per ml for 2 to 3 h,
pelleted, and resuspended in 0.075 M KCl at 37°C for 20 min. The cell suspension was fixed by three changes of a 3:1 dilution of fresh methanol-acetic acid and gently dropped onto ethyl alcohol (EtOH)-cleaned slides in a humid
environ-ment. Slides were air dried overnight and stored at280°C with a desiccant.
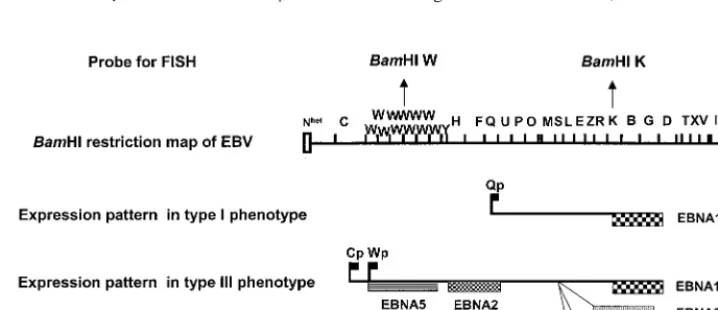
(ii) FISH analysis. (a) Probes.Figure 1 shows aBamHI restriction endonu-clease map of EBV, with the regions used as probes in the hybridization
exper-iments indicated. EBV-specific probes were derived from cloned Bam
HI-di-gested fragments (BamHI W andBamHI K) of the B95-8 strain of EBV DNA,
kindly provided by Lars Rymo, Gothenburg, Sweden (1). The 3.1-kbBamHI W
fragment and the 5.1-kbBamHI K fragment were purified from the gels and used
for FISH. Probes were labeled by nick translation with either biotinylated 16-dUTP (Boehringer, Mannheim, Germany), fluorescein–12-dUTP, or Texas red–5-dUTP (Dupont) with a BIONICK labeling kit (Gibco-BRL). Human chro-mosome X and four paints were labeled with cyanine 3 (Cy3) (CAMBIO, Cam-bridge, United Kingdom).
(b) Hybridization.Hybridization was performed as described previously (31).
Nuclear and chromosome preparations were rinsed for 10 min in 23SSC (13
SSC is 0.15 M NaCl plus 0.015 M sodium citrate) and dehydrated with 70 and 95% EtOH for 5 min each before air drying. For DNA-specific hybridization,
RNase A (100mg/ml in 23SSC) treatment was done at 37°C for 1 h before
hybridization. Slides were denatured for 2 to 3 min in 70% formamide–23SSC
at 70°C. This step was omitted for hybridization to RNA. Preparations were
dehydrated with cold 70, 90, and 100% EtOH for 5 min each and air dried. For
each sample, 50 ng of probe, 5mg of sonicated salmon sperm DNA, and 20mg
ofEscherichia colitRNA were suspended in 5ml of deionized formamide and heated at 70 to 80°C for 10 min. An equal volume of hybridization buffer was
added, so that the final hybridization solution contained 50% formamide, 23
SSC, and 10% dextran sulfate (17). The slides were incubated at 37°C overnight.
(c) Detection.Biotin-labeled DNA was detected by fluorescein isothiocyanate (FITC)-conjugated avidin (Vector Laboratories, Burlingame, Calif.) as described
previously (24). Chromosomes and nuclei were counterstained with 49
,6-dia-midino-2-phenylindole (DAPI). The slides were examined with a Leica DMRBE microscope equipped with a cooled charge-coupled-device camera (Hamamatsu 4800) and filter sets specific for the fluorochromes (DAPI, FITC, and Texas red).
RESULTS
(i) EBV integration site.
RNase A treatment followed by
DNA denaturation and hybridization with the
Bam
HI W
sequence detected the viral integration site in the telomeric
portion of Xp in Namalwa-Cl8 cells and in 4q25 in IB4-D cells
(Fig. 2A and D). Corresponding signals were obtained in
inter-phase nuclei (data not shown). These localizations were
con-firmed with chromosome X- and chromosome 4-specific probes
(Fig. 2A and D).
[image:2.612.55.554.83.176.2](ii) Nuclear EBV-specific RNA detection in LCLs and in
type I and type III BL lines. (a) Cell lines with integrated EBV
DNA and type III latency (Namalwa-CL8 and IB4-D).
The
EBV
Bam
HI W probe was used to localize the complementary
RNA sequences in the type III BL line Namalwa-Cl8 and in
the LCL IB4-D, known to carry only integrated EBV DNA (6,
8, 11). Viral transcripts were detected in 90 to 92% of the cells
in both lines. They were restricted to a single site in each
nu-cleus (Fig. 2B and E). Accumulating transcripts appeared as
bright curvilinear tracks, similar to the earlier description of
[image:2.612.120.479.536.691.2]FIG. 1. Patterns of viral gene expression and regulation in cells latently infected with EBV. Diagrams were adapted from references 21 and 26. ABamHI restriction endonuclease map of the 172-kb B95.8 EBV strain was used to assign promoter and exon positions (top). Two viral programs, designated type I and type III, are used alternatively in EBV-carrying B-cell lines and tumor biopsies. In type III, all six EBNA messages are spliced from a polycistronic message originating from alternative promoters in the W or C region (flags). In type I, only EBNA1 is expressed from a monocistronic message, initiated at the Qp promoter (flag) (29).
TABLE 1. Cell lines
Cell line(reference) Type Derivation Phenotype Latency pattern ofgene expression Nuclear antigen(s)expressed State of the viralgenomea
LCL-97042 (30a)
LCL
Normal B cell
Immunoblastic
Type III
EBNA1 to -6
Episomal
IARC-171 (18)
LCL
Normal B cell
Immunoblastic
Type III
EBNA1 to -6
Episomal
IB4-D (13)
LCL
Normal B cell
Immunoblastic
Type III
EBNA1 to -6
Integrated
Rael (15)
BL
BL
BL type
Type I
EBNA1
Episomal
MUTU I (7)
BL
BL
BL type
Type I
EBNA1
Episomal
MUTU III (7)
BL
BL
Immunoblastic
Type III
EBNA1 to -6
Episomal
Namalwa-Cl8 (15)
BL
BL
Immunoblastic
Type III
EBNA1 to -6
Integrated
aEpisomal lines may also carry integrated copies in addition.
V
OL. 73, 1999
VISUALIZATION OF EBV EXPRESSION PATTERNS BY FISH
5065
on November 9, 2019 by guest
http://jvi.asm.org/
Lawrence et al. (17). In large decondensed nuclei the tracks
extended across almost half of the nucleus.
(b) Simultaneous detection of chromosome-specific nuclear
domains containing EBV integration sites and
Bam
HI W RNA
tracks in Namalwa-Cl8 and IB4-D cells.
Namalwa-Cl8 and
IB4-D cells were stained with chromosome X- and
chromo-some 4-specific probes, respectively. Hybridization solution
containing a differently labeled
Bam
HI W probe was applied in
parallel. The
Bam
HI W RNA tracks were regularly associated
with chromosome X domains in Namalwa-Cl8 cells and with
chromosome 4 domains in IB4-D cells (Fig. 2C and F).
Anal-ysis of over 100 Namalwa-Cl8 and IB4-D cells showed that 73
and 70% of
Bam
HI W RNA tracks, respectively, appeared to
be in direct contact with chromosome X and 4 domains, with
no visible separation between the domain and the RNA.
(c) Simultaneous detection of
Bam
HI K and
Bam
HI W RNA
in Namalwa-Cl8 and IB4-D cells.
Two-color labeling
exper-iments were performed with the
Bam
HI K and
Bam
HI W
probes on nondenatured preparations. Both probes hybridized
to the same nuclear foci in both cell lines (Fig. 3A and B).
(d) Simultaneous detection of
Bam
HI K and
Bam
HI W
RNAs in cells with multiple episomal EBV DNA copies.
Cell
lines with episomal EBV-DNA such as the type III BL line
MUTU III and LCL-970402 gave positive signals with both
Bam
HI W and
Bam
HI K. Two-color fluorescence showed that
both probes hybridized to the same nuclear foci, creating the
appearance of elongated two-colored dots (Fig. 3C and D). We
have found that the nuclear RNA tracks were shorter in cell
lines carrying episomal EBV genomes (i.e., MUTU and LCLs)
than in cell lines with an integrated EBV genome (i.e.,
Na-malwa-Cl8 and IB4-D). This may be related to the level of
transcription or to the location of the integrated EBV DNA in
a more internal nuclear compartment.
[image:3.612.56.550.71.394.2](e) Detection of
Bam
HI K but not
Bam
HI W RNA in type I
BL lines and heterogeneous expression in the LCL IARC-171.
Type I BL lines (MUTU I and Rael), which carry episomal
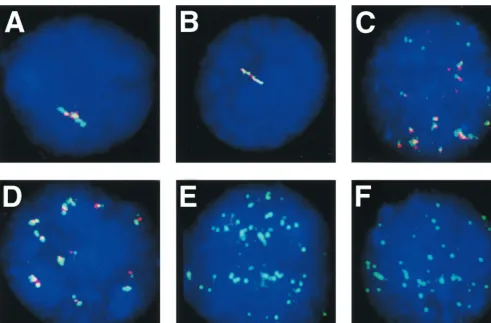
FIG. 2. FISH to metaphase chromosomes and nuclei of cells with integrated EBV DNA with the EBVBamHI W DNA probe. (A to C) Hybridization to cytogenetic
preparations of Namalwa-Cl8 cells; (D to F) hybridization to LCL IB4-D. (A) Simultaneous hybridization to both viral (EBVBamHI W) DNA and chromosome X
in denatured and RNase A-treated samples. Yellow signals (arrow) on each sister chromatid of chromosome X (red) indicates the localization of integrated EBV
genomes in the telomeric region of Xp. The chromosome X-painting probe was labeled with Cy3 and the EBVBamHI W DNA was labeled with biotin and detected
with FITC-conjugated avidin. Chromosomes were counterstained with DAPI. (B) Track of the EBVBamHI fragment W (BamHI W) RNA (green) within a
non-denatured interphase nucleus. The EBVBamHI W DNA was labeled with biotin, and hybridization was detected with FITC-avidin. The nucleus was counterstained
with DAPI. (C) Simultaneous hybridization of theBamHI W DNA probe and the chromosome X-specific probe in denatured samples indicates the X chromosome
domain (red) and theBamHI W nuclear RNA (green) in a DAPI-stained nucleus. The chromosome X-painting probe was labeled with Cy3, and the EBVBamHI W
DNA was labeled with biotin and detected with FITC-conjugated avidin. Note that the RNA track extends from the chromosome X interphase domain into a more
peripheral position. (D) Simultaneous hybridization to viral (EBVBamHI W) DNA and chromosome 4 in denatured and RNase A-treated samples. Yellow signals
on each sister chromatid on q25 of one chromosome 4 (red) indicate the localization of integrated EBV genomes. The chromosome 4-painting probe was labeled with
Cy3, and the EBVBamHI W DNA was labeled with biotin and detected with FITC-conjugated avidin. Chromosomes were counterstained with DAPI. (E) Nuclear
RNA from theBamHI W region of EBV (green) in nondenatured preparations. EBVBamHI W DNA was labeled with biotin, and hybridization was detected with
FITC-conjugated avidin. The nucleus was counterstained with DAPI. Note the large accumulation of RNA at the end of the track. (F) Simultaneous hybridization of
theBamHI W probe and the chromosome 4-specific probe in denatured samples indicate the two chromosome 4 domains (red) and theBamHI W nuclear RNA track
(green) in a DAPI-stained nucleus of an IB4-D cell. Note that the RNA track extends from the chromosome 4 interphase domain across almost half of the nucleus.
on November 9, 2019 by guest
http://jvi.asm.org/
EBV, hybridize only with the
Bam
HI K but not the
Bam
HI W
probe in two-color experiments (Fig. 3E and F). In
LCL-970402, two positive signals were found in 96% of the cells
while no positive signals were found in 4% of the cells (Fig.
4D). In IARC-171 three categories of cells were observed.
Ninety percent of the cells hybridized with both probes, 5%
hybridized with
Bam
HI K but not
Bam
HI W (Fig. 4A to C),
and 5% failed to hybridize with either one of the two probes.
All three categories of cells appeared equally viable. These
results suggest that a proportion of the IARC-171 but not the
LCL-970402 cells may shift from a type III to a type I program
and also raise the question of whether a latency 0 program
exists as well. We cannot entirely exclude technical reasons for
the occasional lack of hybridization signals. We have tried to
minimize this problem, however, by scoring only regions where
the signal-positive and signal-negative cells were close to each
other, as exemplified in Fig. 4. The difference between
LCL-970402 and IARC-171 also speaks against the technical artifact.
DISCUSSION
Latent EBV genomes are differentially expressed in different
cell types, as was clearly stated in the introduction. We found
that a double-RNA-track FISH technique can distinguish
be-tween cells using a type I or a type III program. This finding
may permit the study of EBV program switches in LCLs and
other EBV-carrying cell populations in vitro and, at a later
stage, hopefully in vivo as well. It may open the way to the
analysis of program switches during primary infection as in
mononucleosis. Immunoblastic transformation and rapid
pro-liferation is followed by immune rejection, mediated largely by
CD8
1cytotoxic T lymphocytes, targeted against major
histo-compatibility complex class I-associated peptides derived from
EBNA2 to -6 or the LMPs. EBNA1 is not a rejection target,
due to the impairment of its processing by the glycine-alanine
repeat (20). The first phase raises the number of virus-carrying
cells to a ceiling level, prior to rejection. The rejection
re-sponse secures the survival of the host. The survival of the virus
is secured by its persistence in resting B lymphocytes that
express EBNA1 only, do not expand, and are not rejected. A
latently infected reservoir is established in all infected
indi-viduals, including immunodefective hosts with large
immu-noblastomas that have been successfully treated by adoptive
transfer of T cells.
[image:4.612.60.551.70.393.2]We have previously postulated (14) that a small fraction of
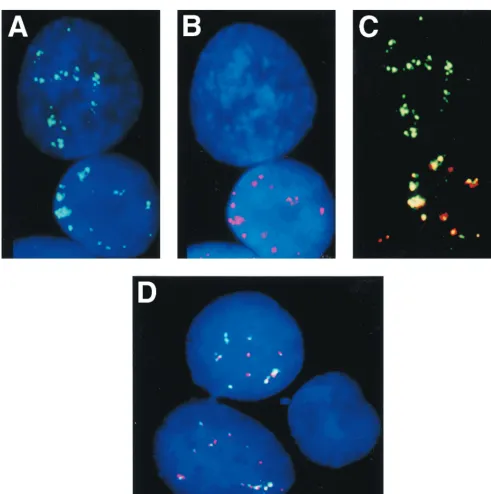
FIG. 3. Nuclear EBV-specific RNA detection in LCLs and in type I and type III BL cells. Two viral programs, designated type I and type III, are used alternatively in EBV-carrying B-cell lines and tumor biopsies. In type III, all six EBNA messages are spliced from a polycistronic message. In type I, only EBNA1 is expressed from
a monocistronic message (Fig. 1). A biotin- or Texas red-labeled EBVBamHI K DNA probe that can hybridize to both the monocistronic and the polycistronic message
and a Texas red- or biotin-labeledBamHI W DNA probe that can hybridize to the polycistronic but not to the monocistronic message were used to distinguish between
cells that use type III and type I programs in two-color FISH. The biotin-labeled probes were detected with FITC-conjugated avidin. The nuclei were counterstained
with DAPI. (A) Simultaneous detection of EBVBamHI K (red) andBamHI W (green) RNA tracks on a nucleus from the type III BL line Namalwa-Cl8. Both probes
hybridized to the same nuclear foci. (B) Simultaneous detection of EBVBamHI K (green) andBamHI W (red) RNA tracks on a nucleus from an LCL IB4-D cell.
(C) Two-color FISH with EBVBamHI K (green) andBamHI W (red) probes on a nucleus of the type III BL line MUTU III with multiple episomal EBV shows that
both probes hybridized to the same nuclear foci, creating the appearance of two-colored tracks. (D) Simultaneous detection of EBVBamHI K (red) andBamHI W
(green) RNA tracks on a nucleus of an LCL-970402 cell that carries numerous episomal genomes. FISH shows many two-colored RNA foci or tracks. (E and F)
Detection ofBamHI K (green) but notBamHI W RNA in the type I BL lines Rael (E) and MUTU I (F) in two-color experiments.
V
OL. 73, 1999
VISUALIZATION OF EBV EXPRESSION PATTERNS BY FISH
5067
on November 9, 2019 by guest
http://jvi.asm.org/
the proliferating immunoblast population regularly switches to
a resting B-cell phenotype, perhaps by a process akin to the
generation of memory B cells, with a concomitant program
switch from III to I. The opposite program switch, from I to III,
is well known. It occurs in BL type I lines drifting to type III
and can be induced in stable type I BL cells by
5-azacytidine-induced DNA demethylation (22). So far, the III-to-I switch
is only a postulate that has been inaccessible to direct study.
We hope that the method described in this paper will open
the way to direct experimentation on this important
prob-lem.
ACKNOWLEDGMENTS
We thank La´szlo´ Sze´kely (MTC, KI) for LCL-970402. We gratefully
appreciate the technical assistance of Katalin Benedek, Hajnalka Kiss,
Agneta Manneborg Sandlund, and Ying Yang (MTC, KI).
This study was supported by grants from the Swedish Cancer Society
(Cancerfonden), the Karolinska Institute, the Swedish Medical
Re-FIG. 4. Heterogenous EBV RNA expression in LCLs. TheBamHI W probe was labeled with Texas red, and theBamHI K probe was labeled with biotin and
detected with FITC-conjugated avidin. (A to C) Two-color FISH using EBVBamHI K (green) andBamHI W (red) probes on nuclei of cells of the LCL IARC-171
show two-colored (green and red) tracks in one nucleus and only green (BamHI K RNA) but not red (BamHI W RNA) tracks in the other nucleus, suggesting that
a proportion of the cells may shift from a type III to a type I program. (C) Merged images of the red and green signals. Note that the signals of the upper nucleus are
green but that those of the lower one have two colors. (D) Simultaneous detection of EBVBamHI K (green) RNA andBamHI W (red) RNA in nuclei of LCL-970402
cells. One of the nuclei failed to hybridize with either one of the two probes, suggesting that the latency 0 program may exist.
on November 9, 2019 by guest
http://jvi.asm.org/
[image:5.612.59.550.66.560.2]search Council, and the Cancer Research Institute/Cancer
Founda-tion, New York, N.Y.
REFERENCES
1.Arrand, J. R., L. Rymo, J. L. Walsh, E. Bjorck, T. Lindhal, and B. E. Griffin.
1981. Molecular cloning of the complete Epstein-Barr virus genome as a set
of overlapping restriction endonuclease fragments. Nucleic Acids Res.9:
2999–3014.
2.Carter, K. C., and J. B. Lawrence.1991. DNA and RNA within the nucleus:
how much sequence-specific spatial organization? J. Cell. Biochem.47:124–
129.
3.Chen, F., J. Z. Zou, L. di Renzo, G. Winberg, L. F. Hu, E. Klein, G. Klein, and I. Ernberg.1995. A subpopulation of normal B cells latently infected with Epstein-Barr virus resembles Burkitt lymphoma cells in expressing
EBNA-1 but not EBNA-2 or LMP1. J. Virol.69:3752–3758.
4.Dirks, R. W., K. C. Daniel, and A. K. Raap.1995. RNAs radiate from gene
to cytoplasm as revealed by fluorescence in situ hybridization. J. Cell Sci.108:
2565–2572.
5.Fåhraeus, R., H. L. Fu, I. Ernberg, J. Finke, M. Rowe, G. Klein, K. Falk, E. Nilsson, M. Yadav, P. Busson, T. Tursz, and B. Kallin.1988. Expression of Epstein-Barr virus-encoded proteins in nasopharyngeal carcinoma. Int. J.
Cancer42:329–338.
6.Gargano, S., D. Caporossi, G. Gualandi, and E. Calef.1992. Different lo-calization of Epstein-Barr virus genome in two subclones of the Burkitt
lymphoma cell line Namalwa. Genes Chromosome Cancer4:205–210.
7.Gregory, C. D., M. Rowe, and A. B. Rickinson.1990. Different Epstein-Barr virus-B cell interactions in phenotypically distinct clones of a Burkitt’s
lym-phoma cell line. J. Gen. Virol.71:1481–1495.
8.Henderson, A., S. Ripley, M. Heller, and E. Kieff.1983. Chromosome site for Epstein Barr virus DNA in a Burkitt tumor cell line and in lymphocytes
growth-transformed in vitro. Proc. Natl. Acad. Sci. USA80:1987–1991.
9.Herbst, H., H. Stein, and G. Niedobitek.1993. Epstein-Barr virus and
CD301malignant lymphomas. Crit. Rev. Oncol. Hematol.4:191–239.
10.Huang, S., and D. L. Spector.1991. Nascent pre-mRNA transcripts are
associated with nuclear regions enriched in splicing factors. Genes Dev.5:
2288–2302.
11.Hurley, E. A., L. D. Klaman, S. Agger, J. B. Lawrence, and D. A. Thorley-Lawson.1991. The prototypical Epstein-Barr virus-transformed lymphoblas-toid cell line IB4 is an unusual variant containing integrated but not episomal
viral DNA. J. Virol.65:3958–3963.
12.Kieff, E.1996. Epstein-Barr virus and its replication, p. 2343–2396.InB. N. Fields, D. M. Knipe, P. M. Howley, R. M. Chanock, J. L. Melnick, T. P. Month, B. Roizman, and S. E. Straus (ed.), Fields virology. Lippincott-Raven, Philadelphia, Pa.
13. King, W., A. L. Thomas-Powell, N. Raab-Traub, M. Hawke, and E. Kieff.
1980. Epstein-Barr virus RNA. V. Viral RNA in a restringently infected,
growth-transformed cell. J. Virol.36:506–518.
14. Klein, G.1994. Epstein-Barr virus strategy in normal and neoplastic B cells.
Cell77:791–793.
15. Klein, G., L. Dombos, and B. Gothoskar.1972. Sensitivity of Epstein-Barr virus (EBV) producer and non-producer human lymphoblastoid cell lines to
superinfection with EB-virus. Int. J. Cancer10:44–57.
16. Lawrence, J. B., K. C. Carter, and X. Xing.1993. Probing functional orga-nization within the nucleus: is genome structure integrated with RNA
me-tabolism? Cold Spring Harbor Symp. Quant. Biol.58:807–818.
17. Lawrence, J. B., R. H. Singer, and L. M. Marselle.1989. Highly localized tracks of specific transcripts within interphase nuclei visualized by in situ
hybridization. Cell57:493–502.
18. Lenoir, G. M., M. Vuillaume, and C. Bonnardel.1985. The use of lympho-matous and lymphoblastoid cell lines in the study of Burkitt’s lymphoma.
IARC (Int. Agency Res. Cancer) Sci. Publ.60:309–318.
19. Lestou, V. S., S. Strehl, T. Lion, H. Gadner, and P. F. Ambros.1996. High-resolution FISH of the entire integrated Epstein-Barr virus genome on
extended human DNA. Cytogenet. Cell Genet.74:211–217.
20. Levitskaya, J., M. Coram, V. Levitsky, S. Imreh, P. M. Steigerwald-Mullen, G. Klein, M. G. Kurilla, and M. G. Masucci.1995. Inhibition of antigen processing by the internal repeat region of the Epstein-Barr virus nuclear
antigen-1. Nature375:685–688.
21. Masucci, M. G., and I. Ernberg.1994. Epstein-Barr virus: adaptation to a life
within the immune system. Trends Microbiol.2:125–130.
22. Masucci, M. G., B. Contreras-Salazar, E. Ragnar, K. Falk, J. Minarovits, I. Ernberg, and G. Klein.1989. 5-Azacytidine up regulates the expression of Epstein-Barr virus nuclear antigen 2 (EBNA-2) through EBNA-6 and latent
membrane protein in the Burkitt’s lymphoma line Rael. J. Virol.63:3135–
3141.
23. Pallesen, G., S. J. Hamilton-Dutoit, and X. Zhou.1993. The association of Epstein-Barr virus (EBV) with T cell lymphoproliferations and Hodgkin’s
disease: two new developments in the EBV field. Adv. Cancer Res.62:179–
239.
24. Pinkel, D., T. Straume, and J. W. Gray.1986. Cytogenetic analysis using quantitative, high sensitivity, fluorescence hybridization. Proc. Natl. Acad.
Sci. USA83:2934–2938.
25. Raap, A. K., F. M. van de’Rijke, R. W. Dirks, C. J. Sol, R. Boom, and M. van der Ploeg.1991. Bicolor fluorescence in situ hybridization to intron and exon
mRNA sequences. Exp. Cell Res.197:319–322.
26. Rickinson, A. B., and E. Kieff.1996. Epstein-Barr virus, p. 2397–2476.In
B. N. Fields, D. M. Knipe, P. M. Howley, R. M. Chanock, J. L. Melnick, T. P. Month, B. Roizman, and S. E. Straus (ed.), Fields virology. Lippincott-Raven, Philadelphia, Pa.
27. Rosbash, M., and R. H. Singer.1993. RNA travel: tracks from DNA to
cytoplasm. Cell75:399–401.
28. Rowe, M., D. T. Rowe, C. D. Gregory, L. S. Young, P. J. Farrell, H. Rupani, and A. B. Rickinson.1987. Differences in B cell growth phenotype reflect novel patterns of Epstein-Barr virus latent gene expression in Burrkitt’s
lymphoma cells. EMBO J.6:2743–2751.
29. Schaefer, B. C., J. L. Strominger, and S. H. Speck.1995. Redefining the Epstein-Barr virus-encoded nuclear antigen EBNA-1 gene promoter and transcription initiation site in group I Burkitt lymphoma cell lines. Proc. Natl.
Acad. Sci. USA92:10565–10569.
30. Spector, D. L.1993. Nuclear organization of pre-mRNA processing. Curr.
Opin. Cell Biol.5:442–447.
30a.Sze´kely, L.Unpublished data.
31. Szeles, A., S. Bajalica, A. Lindblom, T. Lushnikova, V. I. Kashuba, S. Imreh, M. Nordenskjo¨ld, G. Klein, and E. R. Zabarovsky.1996. Mapping of a new MAP kinase activated protein kinase gene (3pK) to human chromosome band 3p21.2 and ordering of 3pK and two cosmid markers in 3p22-p21 tumor
suppressor region by two color FISH. Chromosome Res.4:310–313.
32. Xing, Y., and J. B. Lawrence.1991. Preservation of specific RNA distribution within the chromatin-depleted nuclear substructure demonstrated by in situ
hybridization coupled with biochemical fractionation. J. Cell Biol.112:1055–
1063.
33. Xing, Y., and J. B. Lawrence.1993. Nuclear RNA tracks: structural basis for
transcription and splicing? Trends Cell Biol.3:346–353.
34. Xing, Y., C. V. Johnson, P. R. Dobner, and J. B. Lawrence.1993. Higher level
organization of individual gene transcription and RNA splicing. Science259:
1326–1330.
V
OL. 73, 1999
VISUALIZATION OF EBV EXPRESSION PATTERNS BY FISH
5069
on November 9, 2019 by guest
http://jvi.asm.org/