Harnessing Technology Schools Survey 2009
Data report – Part 2, data analysis
November 2009
Helen Marshall, David Teeman, Ellie Mundy, Yin Lin, Jo Morrison, Tilaye Yeshanew, Vani Cardozo and Sue Stoddart
Contents
1 Introduction ... 3
2 Factor analysis ... 3
2.1 Summary of factor analysis findings ... 3
2.2 Factor loading tables ... 5
2.3 Other scores or variables created ... 16
3 Cross-tabulations, ANOVAs and correlations ... 18
3.1 Cross-tabulations and ANOVAs ... 18
3.2 Correlations ... 24
4 Change over time analysis ... 26
4.1 Introduction to change over time analysis ... 26
4.2 Change over time tables ... 27
5 Regression analysis ... 66
5.1 Introduction to regression ... 66
5.2 Interpreting regression tables ... 70
5.3 School-level regression tables ... 71
1 Introduction
The Harnessing Technology Schools Survey 2009 is a national survey of ICT in primary, secondary and special schools. This report – part 2 of the data report – provides explanations in relation to four types of analysis:
• factor analysis
• cross tabulations, ANOVAs and correlations • change over time
• regression analysis.
The paper is divided into four sections; each explains the purpose and findings of one of the types of analysis above.
The following reports are available separately:
• Analysis report:1 the main findings and analyses from the 2009 Harnessing Technology Schools Survey.
• Data report, part 1:2 the findings from every question in each of the three
surveys (for school leaders, ICT co-ordinators and teachers); the findings for each question are also set out by school sector – by primary,
secondary and special school sub-samples.
• Technical report:3 details of the sampling processes and the methodology
of the project.
2 Factor analysis
After frequencies had been produced for all questions, factor analysis was carried out to produce variables for use in further analysis. This analysis grouped together suitable questions that cover similar issues and used their correlations with each other to form factors, thus condensing information from a larger number of individual questions into a smaller number of factors while still retaining much of the
information from the individual responses. Which questions were entered into each factor analysis was decided by the research team in conjunction with Becta; the questions corresponded to the themes covered in parts of the report.
2.1 Summary of factor analysis findings
The factor analyses were carried out separately for each type of respondent: senior leaders, teachers and ICT co-ordinators. Tables 2.1.1–2.1.3 show each factor and its
1 Rudd, P., Teeman, D., Marshall, H. et al. (2009). Harnessing Technology Schools Survey 2009:
Analysis report. Coventry: Becta.
2 Marshall, H., Teeman, D. Mundy, E., et al. (2009). Harnessing Technology Schools Survey 2009:
Data report – Part 1, descriptive analysis. Coventry: Becta.
constituent questions and Cronbach’s alpha. Cronbach’s alpha is a measure of internal consistency; it measures the degree to which the individual components of the scale all measure the same underlying construct. Cronbach’s alpha has values in the range from 0 to 1, with values nearer to 1 indicating consistency.
Table 2.1.1: ICT co-ordinator factors
Factor Question(s) Cronbach’s
alpha
Use of Web 2.0 applications Q23 0.803
Being well informed about learning platforms Q32 0.962 Frequency of use of learning platforms Q36 0.962
Encouraged use of own devices Q31 0.732
Table 2.1.2: Senior leader factors
Factor Question(s) Cronbach’s
alpha CPD – Skills audits/reviews/needs analysis Q13 0.633
CPD – ICT skills development Q14 0.768
CPD – collaborative/peer/mentor CPD Q15 0.606
Priorities – learner progress Q7d, Q7e 0.793
Priorities – remote access Q7c, f, j 0.675
Priorities – individualised parental/pupil/SEN
support Q7g, h, i, k 0.576
Priorities – personalised learning Q7a, b 0.625 Teaching of e-safety and other aspects of ICT Q35 0.809
Parental engagement – pupil-specific Q36a, b 0.868
Table 2.1.3: Teacher factors
Factor Question(s) Cronbach’s
alpha
Teacher confidence Q6, Q31, Q35 0.904
Time saving Q40 0.722
Disruption to networks Q19a, b 0.858
Disruption to ICT hardware Q19c, d, e 0.864
Parental engagement – pupil-specific Q45a, b 0.855
Parental engagement – strategic Q45f, g, h 0.817
Usefulness of formal CPD Q36, Q37g 0.702
Needing further CPD Q38 0.833
Helpfulness of peer/collaborative CPD Q37a-Q37d 0.746 Being informed about learning platforms Q20 0.965 Usefulness of learning platforms Q22, Q24 0.975 Use of resources – reusing materials Q10 0.852 Use of resources – online resources Q11a, b, c, f 0.637
Impact on learner engagement Q41 0.920
Use ICT for pupils’ independent learning Q27a, e-k 0.859 Use ICT for pupils’ sharing of information Q27b, c, d 0.742 Assessment for Learning – planning and review Q44a–e 0.865 Assessment for Learning – pupil-directed learning Q44f, g 0.858 Access to equipment – networked computers Q13a, b 0.621 Access to equipment – mobile devices Q13e, h 0.606 2.2 Factor loading tables
This section provides factor loadings of the items constituting each factor. Factor loading is a measure of the strength of the relationship between the item and each factor; it takes values from –1 to +1. Values close to –1 or +1 indicate strong negative or positive relationships, while values close to zero suggest that there is little or no relationship between the items and the factor. Only the items that load on the factors are presented here.
2.2.1 ICT co-ordinator questionnaire factors
Table 2.2.1.1: Use of Web 2.0 applications
Question from ICT questionnaire Factor loading
Question from ICT questionnaire Factor loading
Q23b1 Blogs 0.657
Q23c1 Wikis 0.518
Q23d1 Instant messaging 0.609 Q23e1 Social networking 0.678 Q23f1 Social bookmarking 0.685 Q23g1 Online virtual worlds 0.433 Q23h1 Media-sharing sites 0.476
Q23i1 Podcasting 0.454
A higher score of this factor indicates more encouragement for learners to use Web 2.0 technologies.
Table 2.2.1.2: Extent of being fully informed about using learning platforms
Question from ICT questionnaire Factor loading
Q32a1 For delivering lessons 0.819
Q32b1 For planning work 0.822
Q32c1 For assessment 0.786
Q32d1 For personalisation of learning 0.845 Q32e1 For communicating with learners 0.903 Q32f1 For communication between learners 0.869 Q32g1 For communication with parents/carers 0.852 Q32h1 For communicating with colleagues 0.866 Q32i1 For communicating with others outside school 0.792
A higher score of this factor indicates being better informed about using learning platforms.
Table 2.2.1.3: Frequency of use of learning platforms for a range of tasks
Question from ICT questionnaire Factor loading
Q36a1 For information about learner progress – learners 0.811 Q36b1 For information about learner progress – teaching staff 0.833 Q36c1 For information about learner progress – management 0.779 Q36d1 For information about learner progress – parents 0.620 Q36e1 As a repository for lesson plans 0.828 Q36f1 As a repository for learning resources for learners 0.837 Q36g1 As a repository for teaching software 0.752
Question from ICT questionnaire Factor loading
Q36i1 For assessment for learning 0.846
Q36j1 For assessment and hosting e-portfolios 0.728 Q36k1 For setting homework – learners to store work 0.833 Q36l1 For setting homework – learners to share work 0.836 Q36m1 For setting homework – dialogue with a learner about
work 0.805
Q36n1 For Web 2.0 activities, wikis, blogs, podcasting, social
networking 0.648
A higher score of this factor indicates the school uses learning platforms more frequently.
Table 2.2.1.4: Encourage learners to use their own devices
Question from ICT questionnaire Factor loading
Q31a1 How often learners allowed to use mobile phones 0.713 Q31b1 How often learners allowed to use handheld computers 0.769 Q31c1 How often learners allowed to use laptops 0.636 Q31d1 How often learners allowed to use handheld games
console 0.493
A higher score of this factor indicates that learners are encouraged to use their own devices more often.
2.2.2 Senior leader questionnaire factors
Table 2.2.2.1: CPD – ICT skills development
Question from senior leader questionnaire Factor loading
Q14a1 General ICT skills 0.478
Q14b1 Skills in using ICT to support teaching 0.643 Q14c1 Skills in using ICT for specific subject matters 0.560 Q14d1 Skills in using specific software applications 0.655 Q14e1 Skills in using specific devices 0.566
A higher score of this factor indicates that there is a greater extent of focus on ICT skills development.
Table 2.2.2.2: CPD – skills audits/reviews/needs analysis
Question from senior leader questionnaire Factor loading
Q13a1 Individual ICT CPD reviews 0.560
Q13b1 Staff ICT skills audits 0.738
Q13d1 Consideration of ICT curriculum considered ‘weak’ use
of ICT 0.317
A higher score of this factor indicates that audits/reviews of skills occur more often.
Table 2.2.2.3: CPD – collaborative/peer/mentor CPD
Question from senior leader questionnaire Factor loading
Q15a1 Teachers mentored by colleague 0.545
Q15b1 Collaborative learning between colleagues in the
school 0.638
Q15c1 Collaborative learning with colleagues other schools 0.608 Q15d1 Participating in action research 0.391
Q15e1 Learning from an ICT expert 0.318
A higher score of this factor indicates that peer mentoring CPD activities are rated as more important.
Table 2.2.2.4: Priorities in strategies – personalised learning
Question from senior leader questionnaire Factor loading
Q7a1 To promote independent learning 0.625
Q7b1 To promote personalised learning 0.654
A higher score of this factor indicates that personalised learning is given a higher priority within school.
Table 2.2.2.5: Priorities in strategies – learner progress
Question from senior leader questionnaire Factor loading
Q7d1 To assess learner progress 0.768
Q7e1 To record learner progress 0.803
A higher score of this factor indicates that learner progress is given a higher priority within school.
Table 2.2.2.6: Priorities in strategies – remote access
Question from senior leader questionnaire Factor loading Q7c1 To extend learning beyond the classroom 0.627
Q7f1 To improve communications with parents 0.512 Q7j1 Using to support learning next three years – remote
access study 0.658
Table 2.2.2.7: Priorities in strategies – individualised parental/pupil SEN support
Question from senior leader questionnaire Factor loading
Q7g1 To establish links with educational institutions 0.402
Q7h1 To provide parenting support 0.731
Q7i1 To better help pupils with SEN 0.381
Q7k1 To address attendance and behaviour challenges 0.349
A higher score indicates that individualised parental/pupil support is given a higher priority within school.
Table 2.2.2.8: Teaching of e-safety and other aspects of ICT
Question from senior leader questionnaire Factor loading Q35a1 Critical evaluation of information from the internet 0.730
Q35b1 History of information technology 0.635
Q35c1 Accessing services online 0.597
Q35d1 E-safety 0.638
Q35e1 Overview of websites 0.794
A higher score indicates that topics relating to e-safety are addressed more fully in lessons within school.
Table 2.2.2.9: Parental engagement – pupil-specific
Question from senior leader questionnaire Factor loading Q36a1 Improved ability to engage parents – assessment of
their children’s progress 0.833
Q36b1 Improved ability to engage parents – review of
children’s work 0.823
A higher score indicates a greater improvement in parental engagement with pupil-specific activities.
Table 2.2.2.10: Parental engagement – strategic
Question from senior leader questionnaire Factor loading Q36f1 Improved ability to engage parents – strategic
developmental plans 0.765
Q36g1 Improved ability to engage parents – school finances 0.675 Q36h1 Improved ability to engage parents – school rules 0.730
2.2.3 Teacher questionnaire factors
Table 2.2.3.1: Teacher confidence
Question from teacher questionnaire Factor loading
Q6A Presentations 0.589
Q6B Spreadsheets 0.475
Q6C Multimedia resources 0.551
Q6D Text documents 0.526
Q6E Images 0.611
Q6F Applications 0.598
Q31A Graphics tablets 0.558
Q31B Voting pads 0.495
Q31C Data projectors 0.586
Q31D Digital audio players 0.684
Q31E Digital multimedia microscopes 0.523
Q31F Location devices 0.601
Q31G Digital cameras 0.558
Q31H Digital video cameras 0.632
Q31I Smart phones 0.558
Q31J Video-conferencing equipment 0.527 Q35A Supporting personalising learning 0.547
Q35B Lesson planning 0.577
Q35C Assessment 0.501
Q35D Supporting own professional development 0.638
Q35E Lesson delivery 0.620
Q35F Classroom management 0.561
Q35G Communication with staff 0.498 Q35H Communication with learners 0.520 Q35I Communication with parents 0.404
Table 2.2.3.2: Time saving
Question from teacher questionnaire
Factor loading
Q40A Lesson planning 0.532
Q40B Marking/assessment 0.649
Q40C Report writing 0.544
Q40D Communication with pupils 0.750 Q40E Communication with parents 0.654 Q40F Communication with staff 0.617
A higher score of this factor indicates more time saved.
Table 2.2.3.3: Disruption to ICT hardware Question from teacher
questionnaire
Factor loading
Q19A School’s network 0.731
Q19B School’s internet connection 0.754
A higher score of this factor indicates more disruption to work because the problems are not usually dealt with before they cause disruption.
Table 2.2.3.4: Disruption to networks
Question from teacher questionnaire
Factor loading Q19C Computers used by pupils 0.688 Q19D Interactive whiteboards 0.685
Q19E Printers 0.735
A higher score of this factor indicates more disruption to work because the problems are not usually dealt with before they cause disruption.
Table 2.2.3.5: Parental engagement – pupil-specific
Question from teacher questionnaire
Factor loading Q45A Assessment of child’s work 0.762 Q45B Assessment of child’s progress 0.857
A higher score of this factor indicates there has been a greater improvement in parental engagement with pupil-specific activities.
Table 2.2.3.6: Parental engagement – strategic
Question from teacher questionnaire
Factor loading Q45F Strategic development plans 0.689
Q45G School finances 0.750
Q45H Governance/school rules 0.754
A higher score of this factor indicates there has been a greater improvement in parental engagement with strategic aspects of the school.
Table 2.2.3.7: Usefulness of formal CPD
Question from teacher questionnaire Factor loading
Q36A Higher education course 0.640
Q36B Local authority course 0.648
Q36C Formal school-based CPD 0.519
Q36D Course run by commercial or freelance trainer off
site 0.668
Q36E Informal school-based CPD 0.505
Q36F Online courses 0.731
Q37G Online learning 0.602
A higher score of this factor indicates formal CPD is rated as more useful.
Table 2.2.3.8: Helpfulness of peer/collaborative CPD
Question from teacher questionnaire Factor loading
Q37A Being a mentor 0.689
Q37B Being mentored 0.832
Q37C Collaborative learning with others in school 0.729 Q37D Collaborative learning with colleagues in other schools 0.615
Table 2.2.3.9: Needing further CPD
Question from teacher questionnaire Factor loading
Q38A Software packages 0.623
Q38B Technology for teaching and learning 0.775
Q38C Internet 0.594
Q38D Learning platform 0.457
Q38E Creating electronic resources 0.756 Q38F Supporting pupils’ use of technology 0.768 Q38G Digital video or camera 0.603
A higher score of this factor indicates that further CPD is needed.
Table 2.2.3.10: Teachers are well informed about learning platforms
Question from teacher questionnaire Factor loading
Q20A Delivering lessons 0.845
Q20B Planning work 0.856
Q20C Assessment 0.831
Q20D Personalisation of learning 0.881 Q20E Communicating with pupils 0.867 Q20F Communicating with colleagues 0.858 Q20G Communicating with parents/carers 0.860 Q20H Communicating with others outside school 0.839
A higher score of this factor indicates that teaches are better informed about learning platforms.
Table 2.2.3.11: Teachers’ reported usefulness of learning platforms
Question from teacher questionnaire Factor loading
Q22A1 Information about pupils’ progress – for pupils 0.802 Q22B1 Information about pupils’ progress – for teaching staff 0.859 Q22C1 Information about pupils’ progress – for teaching support
staff 0.854
Question from teacher questionnaire Factor loading
Q22H1 Repository of documents – teaching software 0.849 Q22I1 Online assessment – assessment of learning 0.866 Q22J1 Online assessment – Assessment for Learning 0.873 Q22K1 Online assessment – hosting e-portfolios 0.792 Q22L1 Setting homework – for pupils to store work 0.838 Q22M1 Setting homework – for pupils to share work 0.827 Q22N1 Setting homework – dialogue with pupil about work 0.812 Q22O1 Web 2.0-related activities – wikis, blogs, podcasting,
social networking 0.696
Q241 Upload and store digital learning resources 0.673
A higher score of this factor indicates that teaches report that learning platforms are more useful.
Table 2.2.3.12: Teachers’ use of resources – reusing materials
Question from teacher questionnaire Factor loading
Q10A Presentations 0.798
Q10B Spreadsheets 0.570
Q10C Multimedia resources 0.752
Q10D Text documents 0.746
Q10E Images 0.679
A higher score of this factor indicates resources are adapted more frequently.
Table 2.2.3.13: Teachers’ use of resources – online/electronic resources
Question from teacher questionnaire Factor loading
Q11A Software on CD-ROM/DVD 0.412 Q11B Websites for teachers 0.759
Q11C Other websites 0.571
Table 2.2.3.14: Teachers’ views of impact on learner engagement
Question from teacher questionnaire Factor loading
Q41A Key Stage 1 0.760
Q41B Key Stage 2 0.837
Q41C Key Stage 3 0.890
Q41D Key Stage 4 0.867
Q41ef boys and girls 0.939
Q41G able or gifted 0.825
Q41H SEN 0.795
A higher score of this factor indicates stronger agreement that ICT has a positive impact on learner engagement.
Table 2.2.3.15: Teachers’ use of ICT for pupils’ independent learning
Question from teacher questionnaire Factor loading
Q27A Finding, selecting and synthesising information 0.561 Q27E Analysing data or information 0.554
Q27F Problem solving 0.652
Q27G Developing ideas and creativity 0.740
Q27H Assessment for learning 0.613
Q27I Personalise learning 0.607
Q27J Presenting information 0.638
Q27K Discussing work 0.569
A higher score of this factor indicates more frequent use of ICT for pupils’ independent learning.
Table 2.2.3.16: Teachers’ use of ICT for pupils’ sharing of information
Question from teacher questionnaire Factor loading Q27B Share information with other pupils 0.716
Q27C Share information with pupils in other schools 0.558 Q27D Share information with teaching staff 0.722
Table 2.2.3.17: Assessment for Learning – planning and review
Question from teacher questionnaire Factor loading
Q44A Record pupils’ assessments accessibly 0.725 Q44B Reviews of pupils’ performance 0.857
Q44C Areas for improvement 0.835
Q44D Planning for individualised learning 0.716 Q44E Test pupils’ understanding of learning objectives 0.463
A higher score of this factor indicates more frequent use of ICT for planning and review elements of Assessment for Learning.
Table 2.2.3.18: Assessment for Learning – pupil-directed learning
Question from teacher questionnaire Factor loading
Q44F Record pupils’ feedback and ideas 0.930 Q44G Pupils’ contributions to teaching materials 0.764
A higher score of this factor indicates more frequent use of ICT for pupil-directed learning elements of Assessment for Learning.
Table 2.2.3.19: Teachers’ access to equipment – networked computers
Question from teacher questionnaire Factor loading Q13A Networked desktop computers 0.791
Q13B Networked laptop computers 0.530
A higher score of this factor indicates more access to networked computers.
Table 2.2.3.20: Teachers’ access to equipment – mobile devices
Question from teacher questionnaire Factor loading
Q13E Handheld computers 0.701
Q13H Mobile phones 0.619
A higher score of this factor indicates more access to mobile devices.
2.3 Other scores or variables created
Table 2.3.1: Other scores or variables
Variable Source
School attainment/improvement National Pupil Database
Computer–pupil ratio ICT Q4 and NFER’s register of schools Computer–teacher ratio ICT Q4 and NFER’s register of schools Percentage of pupils with remote
access ICT Q27 and SL Q29
School has Home Access scheme ICT Q28 and SL Q30 School has learning platform ICT Q33 and T Q21 Comprehensiveness of e-safety policy SL Q32 and SL Q32a
Budget/money SL Q16
CPD spending SL Q16a
Frequency of teachers’ CPD
3 Cross-tabulations, ANOVAs and correlations
This section provides explanations of cross-tabulation, one-way analysis of variance (ANOVA), and correlation analyses.
3.1 Cross-tabulations and ANOVAs
After basic frequencies have been produced and factors constructed, it may be interesting to explore whether two or more groups of respondents responded differently to a particular question, or whether one group of respondents scored higher in a factor compared to another group. The way in which the comparison is approached depends on the types of responses involved:
• If the variable of interest is categorical (eg use of Web 2.0 applications is encouraged/not encouraged), cross-tabulation with a statistical test of significance was used.
• If the variable of interest is numerical (eg a factor score of parental engagement), one-way analysis of variance (ANOVA) was used.
These two approaches differ mathematically but provide the same information: whether two or more groups differ in a variable of interest.
3.1.1 Cross-tabulation findings
Data from the three questionnaires was used for this analysis. For each
cross-tabulation, respondents with missing responses or vague responses (eg ‘don’t know’, ‘not applicable’) were not included. Therefore each cross-tabulation facilitated only a proportion of the sample which gave valid responses, and there is no guarantee that this proportion of the sample is representative of the national picture. Thus any resulting findings cannot be directly generalised to the national level.
Furthermore, due to schools not returning full sets of questionnaires from each of the three respondents (senior leaders, ICT co-ordinators and teachers), when comparing two respondent types, the respondents come from different schools. Thus any
difference observed could be due to a difference relating to the schools the
respondents come from rather than a difference relating to respondent types. Thus any significance in difference should be treated with caution.
Analysis looked at how the answers to some questions related to various school background characteristics:
• Schools with Home Access schemes were compared with schools without, in terms of access to materials:
o Senior leadership teams in schools with a Home Access scheme can access significantly more materials.
o Teaching staff in schools with a Home Access scheme can access significantly more materials.
o Teaching support staff in schools with a Home Access scheme can access significantly more materials.
o There is no significant difference in terms of remote access to materials for other school staff.
o Learners in schools with a Home Access scheme can access significantly more materials.
o There is no significant difference in terms of remote access to materials for parents.
o There is no significant difference in terms of remote access to materials for governors.
• Schools with Home Access schemes were compared with schools without, in terms of homework setting:
o Teachers in schools with a Home Access scheme set homework that requires use of a computer significantly more often.
o Teachers in schools with a Home Access scheme set homework that requires access to the internet significantly more often.
Views of teachers, senior leaders and ICT co-ordinators were compared on a range of questions. Analysis found that, in general:
• ICT co-ordinators are significantly more confident than teachers that staff can access the following equipment when they need to:
o networked desktop computers o networked laptop computers o interactive whiteboards o digital projectors
o handheld computers
o digital video and camera equipment o specialist subject equipment
o mobile phones/smart phones.
• Senior leaders are significantly more confident than ICT co-ordinators that staff can access the following equipment when they need to:
o Digital video and camera equipment o Specialist subject equipment
o Mobile phones/smart phones.
• No significant difference was found for the following equipment: o Networked laptop computers
o Interactive whiteboards o Digital projectors
o Handheld computers.
• Senior leaders are significantly more confident than teachers that staff can access the following equipment when they need to:
o Networked desktop computers o Networked laptop computers o Interactive whiteboards o Digital projectors
o Handheld computers
o Digital video and camera equipment o Specialist subject equipment
o Mobile phones/smart phones.
• Senior leaders compared with teachers reported, to a greater extent, that their schools encourage pupils to use the following applications to support their learning:
o Online discussion groups o Blogs
o Instant messaging o Social networking o Online virtual worlds o Podcasting.
• No significant difference was found for the following applications: o Wikis
o Social bookmarking o Media-sharing sites.
• ICT co-ordinators compared with teachers reported, to a greater extent, that their schools encourage pupils to use the following applications to support their learning:
o Online discussion groups o Blogs
o Wikis
o Social networking o Social bookmarking o Online virtual worlds o Podcasting.
• No significant difference was found for media-sharing sites.
• ICT co-ordinators compared with senior leaders reported, to a greater extent, that their schools encourage pupils to use wikis to support their learning.
• No significant difference was found for the following applications: o Online discussion groups
o Blogs
o Instant messaging o Social networking o Social bookmarking o Online virtual worlds o Media-sharing sites o Podcasting.
• Teachers reported that they are more fully informed about what a learning platform can contribute than senior leaders think they are, for the following activities:
o Assessment
o Communicating with pupils o Communicating with colleagues.
• No significant difference was found for the following activities: o Delivering lessons
o Planning work
o Personalisation of learning
o Communicating with others outside their schools.
• Teachers compared with senior leaders reported, to a greater extent, that ICT has improved their school’s ability to engage parents in relation to the following activities:
o Assessment of their child’s work o Assessment of their child’s progress
o Forthcoming work plans, lessons and assignments o Their child’s behaviour
o Achool’s strategic development plans o Issues around governance/school rules o News about the school.
o School finances.
• Senior leaders are significantly more confident than teachers that staff are able to make best use of the following ICT when delivering lessons:
o Graphic tablets o Voting pads
o Multimedia/data projectors o Digital audio players
o Digital multimedia microscopes o Digital still cameras
o Digital video cameras o Smart phones
o Sets of video-conferencing equipment
• No significant difference was found in relation to location devices. Note: wordings of this question in the teacher questionnaire and the senior leader questionnaire were different, and results should be considered with caution.
• Teachers are significantly more confident than ICT co-ordinators that staff are able to make best use of the following ICT when delivering lessons: o Graphic tablets
o Voting pads
o Digital audio players o Location devices o Smart phones.
• ICT co-ordinators are significantly more confident than teachers that staff are able to make best use of the following ICT when delivering lessons: o Multimedia/data projectors
o Digital multimedia microscopes o Digital still cameras.
• No significant difference was found for the following: o Digital video cameras
o Sets of video-conferencing equipment.
Note: the wordings of this question in the teacher questionnaire and the ICT infrastructure questionnaire were different, and results should be considered with caution.
• Senior leaders are significantly more confident than ICT co-ordinators that staff are able to make best use of the following ICT when delivering
lessons:
o Graphic tablets o Voting pads
o Interactive whiteboards o Digital audio players
o Digital multimedia microscopes o Location devices
o Digital still cameras o Digital video cameras o Smart phones
o Sets of video-conferencing equipment.
3.1.2 ANOVA findings
Factor scores derived from the three questionnaires and other calculated variables were used for this analysis. ANOVA compares the mean (or average) of a score between different respondent groups. As in the case of cross-tabulation, a
significance measure is produced; a value less than 0.05 indicates that there is a significant difference between the groups’ averages, which is unlikely to be caused by chance. All ‘significant’ findings reported below have significance values less than 0.05.
• Schools with Home Access schemes and schools without Home Access schemes were compared. Analysis found that there is no significant difference in:
o parental engagement in relation to their children’s work and progress (pupil-specific parental engagement factor score)
o parental engagement in strategic aspects of the school (strategic parental engagement factor score)
o the use of Web 2.0 applications
o the percentage of school budget spent on ICT.
• Schools whose network(s) are maintained by a managed service provider (MSP) – ie a local authority support service or an ICT supplier – were compared with schools whose network(s) are maintained otherwise. Analysis found that:
o schools with network(s) managed by an MSP reported higher levels of teacher’s access to networked computers
o there is no significance difference in teacher’s access to mobile devices
o schools with network(s) managed by an MSP reported higher levels of disruption to networks
o schools with network(s) managed by an MSP reported higher levels of disruption to ICT hardware
• Analysis looked at how school size (in terms of the number of pupils in the school) is related to school’s most frequent way of purchasing ICT
equipment:
o Smaller schools are more likely to purchase ICT equipment from their local authorities.
o Larger schools are more likely to purchase ICT equipment from an ICT supplier or reseller.
o Larger schools are more likely to purchase ICT equipment from other independent sources.
• Each school’s strategy or improvement plan for ICT and/or e-learning was looked at in relation to school budget. Analysis found that:
o having the ICT improvement plan embedded within the whole-school developmental plan is not related to the percentage of school budget spent on ICT
o having the ICT improvement plan separate from the whole-school developmental plan is not related to the percentage of school budget spent on ICT
o teaching ICT as a discrete subject or embedded in the overall
curriculum is not related to the percentage of school budget spent on ICT.
3.2 Correlations
After comparing factor scores between groups of respondents, it may be interesting to know how two factor scores are related. The correlation between two scores explores how likely it is that there is a linear relationship between them. For example, it is possible to explore whether there is a link between schools’ budgets for ICT and teachers’ CPD in ICT; the correlation between these two factors shows whether the schools spending more on ICT are also those with more ICT CPD for teachers.
Correlation calculations require pairs of scores; therefore some schools were excluded if they didn’t have pairs of scores. For example, information on a school’s budgets for ICT was collected in the senior leader questionnaire, and teachers’ CPD in ICT was collected in the teacher questionnaires. To find the correlation between these two factors, only schools returning both types of questionnaires could be included in the calculation. Hence each calculation facilitated only a proportion of the sample, and there is no guarantee that this proportion of the sample is
representative of the national picture. Any resulting findings cannot be directly generalised to the national level.
Table 3.2.1: Correlations
Factor 1 Factor 2 Correlatio
n Frequency of
CPD
experiences (TQ)
Time saving (TQ) 0.179
Per cent of budget spent on ICT
Use of Web 2.0 applications (ICT) 0.083 ICT cords well informed on learning platforms (ICT) 0.149 Frequency of use of learning platforms (ICT) 0.242 Encouraged use of own devices (ICT) 0.062 Total number of computers or PDAs for learners 0.137 Total number of computers or PDAs for teachers 0.137 Percentage of pupils with remote access 0.029 CPD – skills audits/reviews/needs analysis (SLT) 0.079 CPD – ICT skills development (SLT) 0.030 CPD – collaborative/peer/mentor CPD (SLT) 0.048 Priorities – learner progress (SLT) –0.007 Priorities – remote access (SLT) 0.082 Priorities – individualised parental/pupil SEN
support (SLT) 0.064
Priorities in strategies – personalised learning
(SLT) 0.025
Parental engagement – pupil-specific (SLT) 0.090 Parental engagement – strategic (SLT) 0.164 Per cent pupils with remote access 0.006
4 Change over time analysis
4.1 Introduction to change over time analysis
Following on from the Harnessing Technology Survey 2008, the 2009 survey contained many similar questions, such as the number of networked desktops in a school, and teachers’ ratings of their confidence in ICT. When data allows,
responses from the two surveys can be matched and compared so as to identify any significant changes in the year 2008–09.
In terms of mathematical techniques, the aim was again to identify whether the responses differ between two groups: the 2008 respondents and the 2009
respondents. Thus cross-tabulations and ANOVAs were used as appropriate (see Section 3.1).
The first two tables in Section 4.2 below (Tables 4.2.1.1 and 4.2.1.2) give the
average (mean) number of computers in schools from the 2008 survey and the 2009 survey. Instances where the averages have changed between 2008 and 2009 – either increased or decreased – are indicated by an asterisk (*).
The subsequent tables in Sections 4.2 and 4.3 show the distribution of responses (percentages) from both the 2008 survey and the 2009 survey. Where these distributions are different (where there is a change of opinion or information), it is indicated with an asterisk (*) in the column labelled ‘Significant?. Non-significant differences are indicated by an ‘NS’ in the ‘Significant?’ column, and this shows that any change from 2008 to 2009 is not sufficiently great, and is probably due to chance.
4.2 Change over time tables
4.2.1 ICT co-ordinators and change over time
Table 4.2.1.1: Change over time of numbers of computers in schools
ICT equipment and user group Yea
r N=
Mea n
Significant ?
Total number of computers for teachers
2008 523 66
NS 2009 593 63
Number of desktops for teachers 2008 453 42 NS 2009 519 38
Number of laptops for teachers 2008 513 29 NS 2009 569 30
Number of PDAs for teachers 2008 326 2 NS 2009 363 2
Total number of computers for pupils 2008 525 121 NS 2009 594 130
Number of desktops for pupils 2008 516 101 NS 2009 588 105
Number of laptops for pupils 2008 440 23 * 2009 475 32
Number of PDAs for pupils 2008 325 4 NS 2009 332 2
Overall number of pupils per computer 2008 523 5 NS 2009 594 5
Overall number of pupils per desktop 2008 514 6 NS 2009 586 7
Overall number of pupils per laptop 2008 358 45 * 2009 405 32
Table 4.2.1.2: Change over time of numbers of computers in schools by school type
School type ICT equipment and user group
Yea
r N=
Mea n
Significant ?
Primary
Total number of computers for teachers
2008 165 23
NS 2009 216 22
Number of desktops for teachers 2008 131 14 NS 2009 172 13
Number of laptops for teachers 2008 164 12 NS 2009 206 12
Number of PDAs for teachers 2008 95 1 NS 2009 119 0
Total number of computers for pupils
2008 166 38
NS 2009 215 43
Number of desktops for pupils 2008 162 27 * 2009 211 32
Number of laptops for pupils 2008 133 15 NS 2009 160 14
Number of PDAs for pupils 2008 98 0 NS 2009 112 2
Overall number of pupils per computer
2008 165 7
NS 2009 215 7
Overall number of pupils per desktop
2008 161 13
NS 2009 210 12
Overall number of pupils per laptop
2008 97 42
School type ICT equipment and user group
Yea
r N=
Mea n
Significant ?
Secondary
Total number of computers for teachers
2008 170 146 NS 2009 170 156
Number of desktops for teachers 2008 162 87 NS 2009 163 89
Number of laptops for teachers 2008 167 61 NS 2009 164 70
Number of PDAs for teachers 2008 125 4 NS 2009 122 5
Total number of computers for pupils
2008 170 291 * 2009 174 337
Number of desktops for pupils 2008 169 247 NS 2009 172 273
Number of laptops for pupils 2008 156 44 * 2009 155 72
Number of PDAs for pupils 2008 110 7 NS 2009 104 4
Overall number of pupils per computer
2008 170 4
NS 2009 174 4
Overall number of pupils per desktop
2008 169 4
NS 2009 172 7
Overall number of pupils per laptop
2008 142 67
NS 2009 147 46
Special
Total number of computers for teachers
2008 187 31
NS 2009 207 31
Number of desktops for teachers 2008 159 18 NS 2009 184 17
Number of laptops for teachers 2008 181 16 NS 2009 199 17
Number of PDAs for teachers 2008 105 1 NS 2009 122 1
Total number of computers for pupils
2008 188 40
School type ICT equipment and user group
Yea
r N=
Mea n
Significant ?
Number of desktops for pupils 2008 184 33 NS 2009 204 38
Number of laptops for pupils* 2008 150 7 * 2009 160 11
Number of PDAs for pupils 2008 116 3 NS 2009 116 1
Overall number of pupils per computer
2008 188 3
NS 2009 205 3
Overall number of pupils per desktop
2008 184 3
NS 2009 203 3
Overall number of pupils per laptop*
2008 119 21 * 2009 130 15
NS, not significant; * significant change over time.
Table 4.2.1.3: Gender
School sector Gender
Per cent in
Significant ?
200
9 2008
Primary Male 26 23 NS
Female 72 75
Secondary Male 73 72 NS
Female 23 28
Special Male 42 40 NS
Female 55 57
Note: 2009 figures are un-weighted and will only be representative of the respondents.
Table 4.2.1.4: Current role in school*
School
sector Role
Per cent in:
2009 2008
Primary
ICT co-ordinator 54 64 ICT subject leader 21 21
Head of ICT 1 1
ICT manager 4 5
ICT advisor <1 2
Headteacher 4 9
Deputy headteacher 3 7 Assistant headteacher 1 2
Bursar 2 0
Other 2 5
Secondary
ICT co-ordinator 23 25 ICT subject leader 11 11
Head of ICT 14 29
ICT manager 30 25
ICT advisor 0 1
Headteacher 0 0
Deputy headteacher 1 3 Assistant headteacher 6 8
Bursar 0 0
Other 5 4
Special
ICT co-ordinator 42 54 ICT subject leader 11 13
Head of ICT 5 6
ICT manager 13 10
ICT advisor <1 1
Headteacher 1 3
School
sector Role
Per cent in:
2009 2008
Bursar 1 1
Other 6 7
*Statistical tests not requested. Note: 2009 figures are unweighted and will only be representative of the respondents.
Table 4.2.1.5: Graphic tablets available for teaching and learning
Number of graphic tablets
Per cent
in: Significant ?
2008 2009
None 76 69
*
Between 1 and 5 16 23
Between 6 and 10 4 5
Between 11 and 20 3 3
Between 21 and 40 2 1
N= 462 628
* Significant change over time.
Table 4.2.1.6: Voting pads available for teaching and learning
Number of voting pads
Per cent
in: Significant ?
2008 2009
None 79 72
*
Between 1 and 10 3 6
Between 11 and 20 3 4
Between 21 and 40 9 13
Between 41 and 60 3 4
61 or more 3 2
N= 461 631
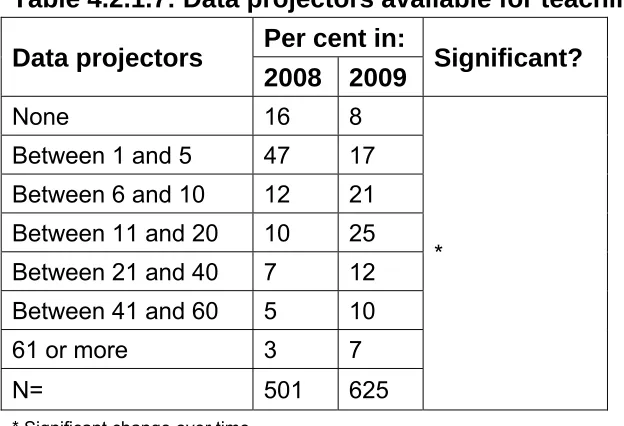
Table 4.2.1.7: Data projectors available for teaching and learning
Data projectors Per cent in: Significant? 2008 2009
None 16 8
* Between 1 and 5 47 17 Between 6 and 10 12 21 Between 11 and 20 10 25 Between 21 and 40 7 12 Between 41 and 60 5 10
61 or more 3 7
N= 501 625
* Significant change over time.
Table 4.2.1.8: Digital audio players available for teaching and learning
Digital audio players
Per cent
in: Significant ?
2008 2009
None 83 64
* Between 1 and 5 11 24 Between 6 and 10 4 7
11 or more 2 5
N= 450 630
* Significant change over time.
Table 4.2.1.9: Digital multimedia microscopes available for teaching and learning
Digital multimedia microscopes
Per cent
in: Significant ?
2008 2009
None 22 24
NS
Between 1 and 5 74 69
Between 6 and 10 3 6
11 or more 1 2
N= 489 633
Table 4.2.1.10: Location devices available for teaching and learning
Location devices
Per cent
in: Significant ?
2008 2009
None 95 91
*
1 or more 5 9
N= 444 616
* Significant change over time.
Table 4.2.1.11: Digital cameras available for teaching and learning
Digital cameras
Per cent
in: Significant ?
2008 2009 Between 0 and 5 30 25
* Between 6 and 10 39 36 Between 11 and 20 25 30
21 or more 5 9
N= 531 642
* Significant change over time.
Table 4.2.1.12: Digital video cameras available for teaching and learning
Digital video cameras
Per cent
in: Significant ?
2008 2009
None 9 8
* Between 1 and 5 68 60 Between 6 and 10 16 20 Between 11 and 20 7 10
21 or more 1 2
N= 516 643
Table 4.2.1.13: Smart phones available for teaching and learning
Smart phones
Per cent in: Significant ?
2008 2009
None 97 96
NS
1 or more 3 4
N= 435 632
NS, not significant.
Table 4.2.1.14: Video-conferencing equipment available for teaching and learning
Video-conferencing equipment
Per cent
in: Significant ?
2008 2009
None 73 73
NS
Between 1 and 5 26 26
6 or more 1 1
N= 461 636
NS, not significant.
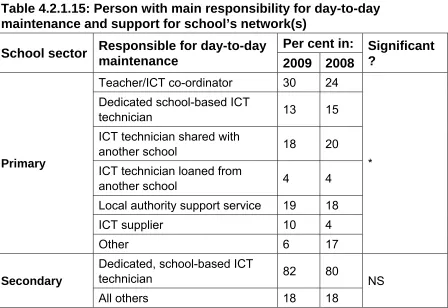
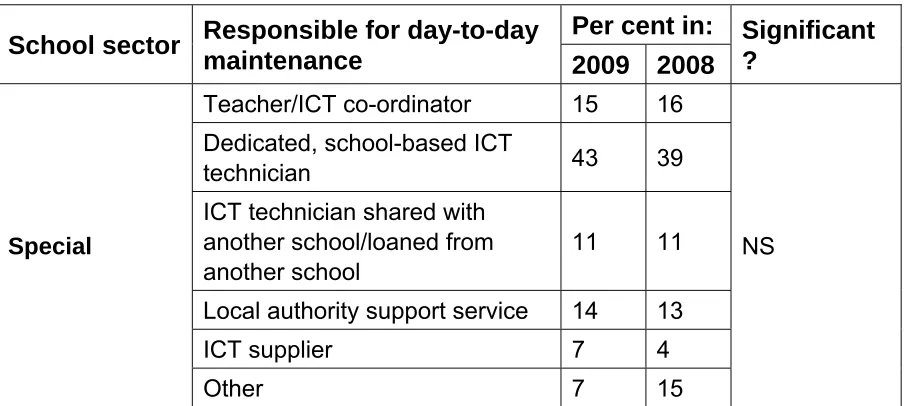
Table 4.2.1.15: Person with main responsibility for day-to-day maintenance and support for school’s network(s)
School sector Responsible for day-to-day maintenance
Per cent in: Significant ?
2009 2008
Primary
Teacher/ICT co-ordinator 30 24
* Dedicated school-based ICT
technician 13 15
ICT technician shared with
another school 18 20
ICT technician loaned from
another school 4 4
Local authority support service 19 18
ICT supplier 10 4
Other 6 17
Secondary
Dedicated, school-based ICT
technician 82 80 NS
School sector Responsible for day-to-day maintenance
Per cent in: Significant ?
2009 2008
Special
Teacher/ICT co-ordinator 15 16
NS Dedicated, school-based ICT
technician 43 39
ICT technician shared with another school/loaned from another school
11 11
Local authority support service 14 13
ICT supplier 7 4
Other 7 15
Note: for secondary schools, categories combined because numbers are too low for statistical tests; for special schools, ICT technician shared from another school/loaned from another school combined, as numbers are too low for statistical tests.
[image:36.595.68.520.92.295.2]NS, not significant, * significant change over time.
Table 4.2.1.16: Type of firewall(s) used
School sector Type of firewall Per cent in: Significant ?
2009 2008
Primary
School managed software
firewall 9 14 NS
School managed firewall built
into switch/router 5 4 NS
Local authority managed firewall 69 64 NS Regional broadband consortium
managed firewall 17 15 NS
Internet service provider
managed firewall 7 11 NS
ICT supplier managed firewall 5 7 NS
School sector Type of firewall Per cent in: Significant ?
2009 2008
Secondary
School managed software
firewall 33 39 NS
School managed firewall built
into switch/router 13 23 *
Local authority managed firewall 65 65 NS Regional broadband consortium
managed firewall 34 35 NS
Internet service provider
managed firewall 15 11 NS
ICT supplier managed firewall 3 2 NS
None <1 0 ≠
Special
School managed software
firewall 14 14 NS
School managed firewall built
into switch/router 7 10 NS
Local authority managed firewall 70 64 NS Regional broadband consortium
managed firewall 17 20 NS
Internet service provider
managed firewall 11 12 NS
ICT supplier managed firewall 5 7 NS
None 0 1 ≠
Note: As this was a ‘tick all that apply’ question, comparisons have to be done item by item. NS, not significant; ≠ numbers too small for significance tests.
[image:37.595.67.520.87.530.2]
Table 4.2.1.17: Proportions of pupils who have home access to a computer
School sector Type of home access to computers
Per cent in: Significant ?
2009 2008
Primary
Computer loaned or leased by
the school 4 24 ≠
Own/family-owned computer 75 71 NS
School sector Type of home access to computers
Per cent in: Significant ?
2009 2008
Secondary
Computer loaned or leased by
the school 4 10 ≠
Own/family-owned computer 84 81 NS
No home access 12 18 NS
Special
Computer loaned or leased by
the school 3 15 ≠
Own/family-owned computer 61 60 NS
No home access 33 40 NS
≠ numbers too small for significance tests; NS, not significant.
Table 4.2.1.18: A specific Home Access scheme in place
School sector Response Per cent in: Significant ?
2009 2008
Primary Yes 4 4 NS
No 94 94
Secondary Yes 15 17 NS
No 81 78
Special Yes 11 5 *
No 88 92
NS, not significant; * Significant change over time.
Table 4.2.1.19: School uses a learning platform
School sector Response Per cent in: Significant ?
2009 2008
Primary Yes 40 21 *
No 57 76
Secondary Yes 78 60 *
No 20 35
Special Yes 41 30 *
No 56 68
* Significant change over time.
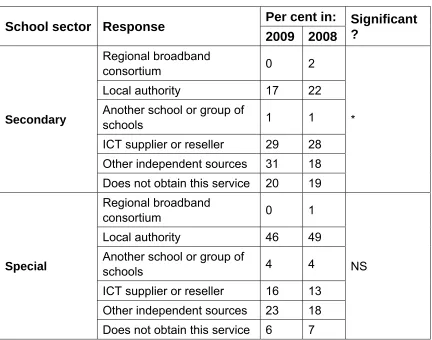
Table 4.2.1.20: Purchasing ICT hardware
2009 2008 ?
Primary
Regional broadband
consortium 0 0
*
Local authority 24 29
Another school or group of
schools 1 0
ICT supplier or reseller 38 48 Other independent sources 34 14 Does not obtain this service 0 0
Secondary
Regional broadband
consortium 0 0
*
Local authority 4 6
Another school or group of
schools 0 0
ICT supplier or reseller 55 63 Other independent sources 39 24 Does not obtain this service 0 0
Special
Regional broadband
consortium 0 0
NS
Local authority 20 22
Another school or group of
schools <1 1
ICT supplier or reseller 44 48 Other independent sources 32 22 Does not obtain this service 0 0
Note: significance tests compare local authority, ICT supplier and other independent sources only – all other categories ignored as too small.
[image:39.595.66.499.88.558.2]NS, not significant; * Significant change over time.
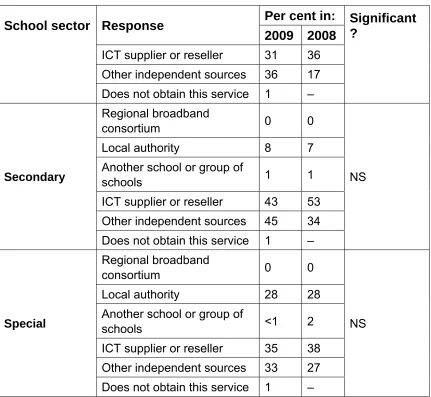
Table 4.2.1.21: Purchasing networking equipment
School sector Response Per cent in: Significant ?
2009 2008
Primary
Regional broadband
consortium 1 2
*
Local authority 27 35
Another school or group of
School sector Response Per cent in: Significant ?
2009 2008 ICT supplier or reseller 31 36 Other independent sources 36 17 Does not obtain this service 1 –
Secondary
Regional broadband
consortium 0 0
NS
Local authority 8 7
Another school or group of
schools 1 1
ICT supplier or reseller 43 53 Other independent sources 45 34 Does not obtain this service 1 –
Special
Regional broadband
consortium 0 0
NS
Local authority 28 28
Another school or group of
schools <1 2
ICT supplier or reseller 35 38 Other independent sources 33 27 Does not obtain this service 1 –
Note: significance tests compare local authority, ICT supplier and other independent sources only – all other categories ignored as too small.
[image:40.595.68.499.89.486.2]NS, not significant; * Significant change over time.
Table 4.2.1.22: Purchasing technical support and maintenance services
School sector Response Per cent in: Significant ?
2009 2008
Primary
Regional broadband
consortium 0 1
*
Local authority 37 46
Another school or group of
schools 8 4
School sector Response Per cent in: Significant ?
2009 2008
Secondary
Regional broadband
consortium 0 2
*
Local authority 17 22
Another school or group of
schools 1 1
ICT supplier or reseller 29 28 Other independent sources 31 18 Does not obtain this service 20 19
Special
Regional broadband
consortium 0 1
NS
Local authority 46 49
Another school or group of
schools 4 4
ICT supplier or reseller 16 13 Other independent sources 23 18 Does not obtain this service 6 7
Note: for primary and special schools, significance tests compare local authority, ICT supplier, another school/group of schools and other independent sources only – all other categories ignored as too small; for secondary, significance tests compare local authority, ICT supplier and other independent sources only.
[image:41.595.67.499.88.428.2]NS, not significant; * Significant change over time.
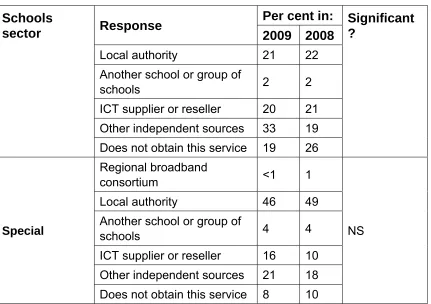
Table 4.2.1.23: Purchasing advice and guidance about design of school’s ICT infrastructure
Schools
sector Response
Per cent in: Significant ?
2009 2008
Primary
Regional broadband
consortium 0 1
NS
Local authority 53 50
Another school or group of
schools 5 2
ICT supplier or reseller 13 15 Other independent sources 19 14 Does not obtain this service 4 9
Secondary Regional broadband
Schools
sector Response
Per cent in: Significant ?
2009 2008
Local authority 21 22
Another school or group of
schools 2 2
ICT supplier or reseller 20 21 Other independent sources 33 19 Does not obtain this service 19 26
Special
Regional broadband
consortium <1 1
NS
Local authority 46 49
Another school or group of
schools 4 4
ICT supplier or reseller 16 10 Other independent sources 21 18 Does not obtain this service 8 10
Note: for primary and special schools, significance tests compare local authority, ICT supplier, another
school/group of schools, ICT supplier and other independent sources. Regional broadband consortium ignored as too small, and ‘does not obtain this service’ removed to make comparisons more useful. For secondary,
[image:42.595.70.501.89.393.2]significance tests compare local authority, ICT supplier and other independent sources only. NS, not significant.
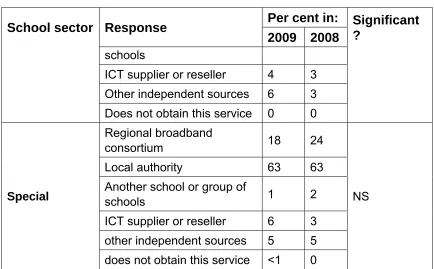
Table 4.2.1.24: Purchasing equipment for internet connectivity
School sector Response Per cent in: Significant ?
2009 2008
Primary
Regional broadband
consortium 21 21
NS
Local authority 62 67
Another school or group of
schools 2 1
ICT supplier or reseller 5 2 Other independent sources 6 2 Does not obtain this service 0 1
Secondary
Regional broadband
consortium 35 34
NS
Local authority 54 56
School sector Response Per cent in: Significant ?
2009 2008 schools
ICT supplier or reseller 4 3 Other independent sources 6 3 Does not obtain this service 0 0
Special
Regional broadband
consortium 18 24
NS
Local authority 63 63
Another school or group of
schools 1 2
ICT supplier or reseller 6 3 other independent sources 5 5 does not obtain this service <1 0
Note: significance tests compare regional broadband consortium, local authority, ICT supplier and other independent sources only – other categories ignored as too small.
[image:43.595.65.499.87.356.2]NS, not significant.
Table 4.2.1.25: Responsibility for purchasing ICT hardware
School sector Response Per cent in: Significant ?
2009 2008
Primary
Headteacher 74 76 NS
ICT co-ordinator 72 68 NS
ICT manager/technician 29 24 NS
Department heads 2 1 ≠
Bursar 7 6 NS
Governors 28 14 *
Other 2 1 ≠
Secondary
Headteacher 31 32 NS
ICT co-ordinator 41 49 NS
ICT manager/technician 70 65 NS
Department heads 7 13 *
Bursar 14 11 NS
Governors 8 3 *
School sector Response Per cent in: Significant ?
2009 2008
Special
Headteacher 49 53 NS
ICT co-ordinator 67 69 NS
ICT manager/technician 44 46 NS
Department heads 8 4 NS
Bursar 10 12 NS
Governors 11 13 NS
Other 6 4 NS
≠ numbers too small for significance tests; NS, not significant; * significant change over time.
Table 4.2.1.26: Responsibility for purchasing networking equipment and cabling
School sector Response Per cent in: Significant ?
2009 2008
Primary
Headteacher 68 68 NS
ICT co-ordinator 54 58 NS
ICT manager/technician 37 29 NS Department heads <1 1 ≠
Bursar 6 5 NS
Governors 16 10 NS
Other 1 2 ≠
Secondary
Headteacher 15 22 NS
ICT co-ordinator 27 36 NS
ICT manager/technician 77 70 NS Department heads <1 3 ≠
Bursar 12 10 NS
Governors 3 2 ≠
Other 8 9 NS
Special
Headteacher 40 43 NS
ICT co-ordinator 47 52 NS
ICT manager/technician 51 52 NS Department heads <1 2 ≠
Bursar 12 10 NS
School sector Response Per cent in: Significant ?
2009 2008
Other 5 4 NS
NS, not significant; ≠ numbers too small for significance tests.
Table 4.2.1.27: Responsibility for purchasing technical support and maintenance services
School sector Response Per cent in: Significant ?
2009 2008
Primary
Headteacher 75 72 NS
ICT co-ordinator 54 51 NS
ICT manager/technician 26 24 NS
Department heads 1 1 ≠
Bursar 8 6 NS
Governors 17 7 *
Other 1 2 ≠
Secondary
Headteacher 22 26 NS
ICT co-ordinator 24 34 *
ICT manager/technician 72 66 NS
Department heads 1 1 ≠
Bursar 14 12 NS
Governors 5 1 *
Other 8 9 NS
Special
Headteacher 52 52 NS
ICT co-ordinator 41 45 NS
ICT manager/technician 41 44 NS Department heads <1 3 ≠
Bursar 14 13 NS
Governors 7 8 NS
Other 4 4 NS
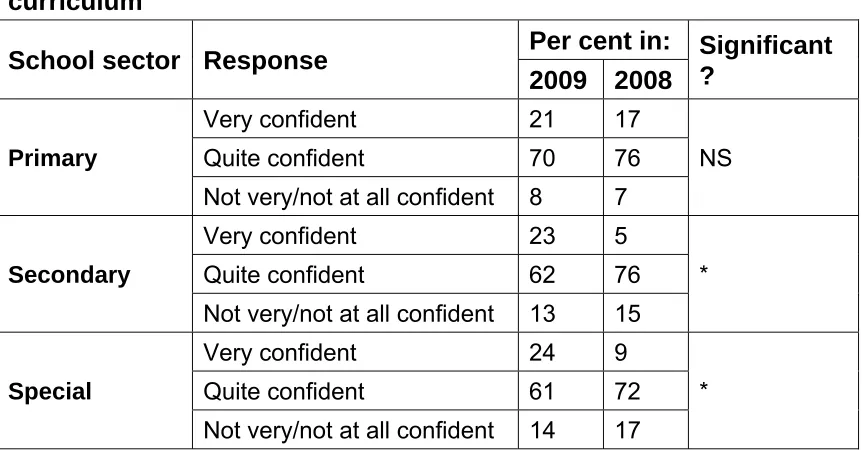
Table 4.2.1.28: Confidence of teachers in using ICT to deliver the school curriculum
School sector Response Per cent in: Significant ?
2009 2008
Primary
Very confident 21 17
NS
Quite confident 70 76
Not very/not at all confident 8 7
Secondary
Very confident 23 5
*
Quite confident 62 76
Not very/not at all confident 13 15
Special
Very confident 24 9
*
Quite confident 61 72
Not very/not at all confident 14 17
Note: not very and not at all categories collapsed because the not at all category is too small for sig tests. NS, not significant; * significant change over time.
Table 4.2.1.29: Proportions of teachers enthusiastic towards using ICT in delivering the school curriculum
School
sector Response
Per cent
in: Significant ?
2009 2008
Primary
All/nearly all 29 31
NS
Most 52 47
Some/few 19 20
Secondary
All/nearly all 21 9
*
Most 56 61
Some/few 22 27
Special
All/nearly all 26 21
NS
Most 48 46
Some/few 25 30
Note: some and few categories collapsed because the ‘few’ category is too small for sig tests. NS, not significant; * significant change over time.
4.2.2 Senior leader change and change over time
Table 4.2.2.1: Gender
School sector
Gende r
Per cent
in: Significant ?
2009 2008
Primary Male 26 19 NS
Female 72 79
Secondary Male 66 65 NS
Female 32 33
Special Male 48 37 *
Female 46 60
Note: 2009 figures are unweighted and will only be representative of the respondents. NS, not significant; * significant change over time.
Table 4.2.2.2: Current role in school*
School sector Role Per cent in: 2009 2008
Primary
Headteacher 77 58
Deputy headteacher 9 16 Assistant headteacher 3 6
Bursar 0 1
ICT co-ordinator 4 7 ICT subject leader 1 3
Head of ICT 0 0
ICT manager 0 1
Other 5 4
Secondary
Headteacher 29 23
Deputy headteacher 22 21 Assistant headteacher 36 41
Bursar 1 2
ICT co-ordinator 2 3 ICT subject leader 0 1
Head of ICT 4 3
ICT manager 1 1
School sector Role Per cent in: 2009 2008
Special
Headteacher 51 47
Deputy headteacher 19 24 Assistant headteacher 16 14
Bursar 1 1
ICT co-ordinator 2 5 ICT subject leader 1 1
Head of ICT 1 1
ICT manager 0 1
Other 5 5
* Statistical tests not requested.
[image:48.595.67.394.85.313.2]Note: 2009 figures are unweighted and are only representative of the respondents.
Table 4.2.2.3: A written strategy or improvement plan for ICT and/or e-learning
School sector Have a written strategy Per cent in: Significant ?
2009 2008
Primary Yes (embedded or separate) 90 92 NS
No 5 4
Secondary Yes (embedded or separate) 89 85 NS
No 5 11
Special Yes (embedded or separate) 86 93 NS
No 5 4
Table 4.2.2.4: ICT taught as a discrete subject matter or embedded in overall curriculum
School sector
Respons e
Per cent in: Significant ?
2009 2008
Primary Discrete 24 21 NS
Embedded 69 72
Secondary Discrete 85 91 NS
Embedded 12 9
Special Discrete 28 65 *
Embedded 66 29
NS, not significant; * significant change over time.
Table 4.2.2.5: Participated in ICT leadership training in past two years
School sector
Respons e
Per cent in: Significant ?
2009 2008
Primary Yes 35 29 NS
No 63 69
Secondary Yes 43 27 *
No 55 70
Special Yes 25 26 NS
No 74 73
NS, not significant; * significant change over time.
[image:49.595.66.393.507.734.2]4.2.3 Teacher and change over time
Table 4.2.3.1: Gender
School sector
Gende r
Per cent
in: Significant ?
2009 2008
Primary Male 13 12 NS
Female 86 85
Secondary Male 42 46 NS
Female 56 51
Special Male 26 28 NS
Female 72 68
Table 4.2.3.2: Key stage taught*
School sector Year group Per cent in: 2009 2008
Primary
Foundation Stage 20 21 Key Stage 1 40 46 Key Stage 2 51 50
Key Stage 3 1 0
Key Stage 4 <1 0
Post 16 <1 0
Secondary
Foundation Stage 0 0
Key Stage 1 0 0
Key Stage 2 18 9 Key Stage 3 91 96 Key Stage 4 76 89
Post 16 42 45
Special
Foundation Stage 9 12 Key Stage 1 17 21 Key Stage 2 31 36 Key Stage 3 52 57 Key Stage 4 49 54
Post 16 17 15
Note: 2009 figures are unweighted and are only representative of the respondents.
*Statistical tests not requested.
Table 4.2.3.3: Current role in school
School sector Role Per cent in: 2009 2008
Primary
Department head 3 4 Subject co-ordinator 24 42 Class teacher 59 39
SENCO 3 2
School sector Role Per cent in: 2009 2008
Secondary
Department head 53 76 Subject co-ordinator 16 10 Class teacher 22 7
SENCO 1 0
Other 7 6
Special
Department head 15 16 Subject co-ordinator 31 38 Class teacher 38 34
SENCO 1 1
Other 13 10
Note: 2009 figures are unweighted and are only representative of the respondents.
*Statistical tests not requested.
Table 4.2.3.4: Time saved/lost each week by using ICT planning lessons
School sector
Time saved each week for lesson planning
Per cent in:
Significant ?
2009 2008
Primary
Save more than 2
hours 27 21
NS Save between 1 and
2 hours 19 20
Save up to 1 hour 20 18 Does not make any
difference 22 25
Lose up to 1 hour 3 4 Lose between 1 and
2 hours 3 4
Lose more than 2
hours 3 3
No access/N/A (don’t use ICT for
this task) <1 5
Secondary
Save more than 2
hours 26 15 *