R E S E A R C H A R T I C L E
Open Access
A study of physician collaborations through social
network and exponential random graph
Shahadat Uddin
1*, Liaquat Hossain
1, Jafar Hamra
1and Ashraful Alam
2Abstract
Background:Physician collaboration, which evolves among physicians during the course of providing healthcare services to hospitalised patients, has been seen crucial to effective patient outcomes in healthcare organisations and hospitals. This study aims to explore physician collaborations using measures of social network analysis (SNA) and exponential random graph (ERG) model.
Methods:Based on the underlying assumption that collaborations evolve among physicians when they visit a common hospitalised patient, this study first proposes an approach to map collaboration network among physicians from the details of their visits to patients. This paper terms this network as physician collaboration network (PCN). Second, SNA measures ofdegree centralisation,betweenness centralisationanddensityare used to examine the impact of SNA measures onhospitalisation costandreadmission rate. As a control variable, the impact ofpatient ageon the relation between network measures (i.e.degree centralisation,betweenness centralisationand density) and hospital outcome variables (i.e.hospitalisation costandreadmission rate) are also explored. Finally, ERG models are developed to identify micro-level structural properties of (i)high-costversuslow-costPCN; and (ii)high-readmission rateversuslow-readmission ratePCN. An electronic health insurance claim dataset of a very large Australian health insurance organisation is utilised to construct and explore PCN in this study.
Results:It is revealed that thedensityof PCN is positively correlated withhospitalisation costandreadmission rate. In contrast,betweenness centralisationis found negatively correlated withhospitalisation costandreadmission rate. Degree centralisationshows a negative correlation withreadmission rate, but does not show any correlation with hospitalisation cost.Patient agedoes not have any impact for the relation of SNA measures withhospitalisation cost and hospitalreadmission rate. The2-starparameter of ERG model has significant impact onhospitalisation cost. Furthermore, it is found thatalternative-k-starandalternative-k-two-pathparameters of ERG model have impact on readmission rate.
Conclusions:Collaboration structures among physicians affecthospitalisation costand hospitalreadmission rate. The implications of the findings of this study in terms of their potentiality in developing guidelines to improve the performance of collaborative environments among healthcare professionals within healthcare organisations are discussed in this paper.
Keywords:Physician collaboration network, Exponential random graph, Social network analysis, Hospitalisation cost and readmission rate
* Correspondence:[email protected] 1
Complex System Research Centre, The University of Sydney, Sydney NSW 2006, Australia
Full list of author information is available at the end of the article
Background
Collaborations among physicians have been found very important to the effectiveness in delivering healthcare services and in producing better patient outcomes [1,2]. The structure of collaboration (i.e. the way how people communicate and collaborate with others in a collabora-tive environment) among the hospital staff could not be the same in different hospitals or healthcare organisations. These various structures may have different impact on healthcare outcome measures (e.g. hospitalisation expenses and patient satisfaction) in various healthcare contexts [3]. Some structures could be more conducive in terms of pa-tient and hospital outcomes compared to others. Therefore, it is necessary to analyse different structures of collabora-tions among healthcare professionals and their impact on outcome variables. In this paper, measures of social net-work analysis (SNA) and exponential random graph (ERG) models are employed to explore physician collaborations in order to find out structural attributes of physician colla-borations that are conducive to hospitalisation cost and readmission rate.
Collaboration, which is a recurring process where two or more people or organisations work together towards common goals [4], enables individuals and organisations to work together more effectively and efficiently. Colla-borative relationships among individuals are highly cele-brated in organisations because the synergies realised by combining multi-dimensional efforts and diverse expert-ise produce benefits greater than those achieved through individual effort [5]. In the context of healthcare service providers or hospitals, collaboration among different healthcare professionals is recognised as a catalyst to improved patient outcomes such as less hospital length of stay and hospitalisation cost [6-8], lower death rate [9] and higher satisfaction [10,11]. In healthcare settings, collaboration allows input from multiple professions (e.g. nurse and physicians), which could produce decisions leading to better patient outcomes because those decisions are based on more complete information [8].
The context of this study is the physicians’ collabo-rations that evolve within healthcare service providers or hospitals during the course of providing healthcare ser-vices to patients. Arguably, it can be conceptualised that physicians collaborate with each other and with other hospital staffs (e.g. nurses) in order to provide effective services to hospitalised patients. Based on the patient condition and unavailability of their colleagues, phy-sicians might seek advices or suggestions from other physicians working in different workplaces. Because of this type of medical practice culture in healthcare service providers or hospitals, a professional collaboration net-work has eventually been developed over time among physicians. This study terms this network as ‘Physician Collaboration Network (PCN)’.
The measures and methods of social network analysis (SNA) have been found useful in investigating networks (e.g. PCN) and their effects on performance [12,13]. SNA can be seen as the mapping and measuring of relationships among participating actors [14] and can provide both a visual and a mathematical analysis of network relations among actors. It plays an important role in identifying and quantifying the informal network which functions at a level beyond the formal and trad-itional organisational structure of actor relationships [13]. In modelling structures of PCN, this study uses the Exponential Random Graph (ERG) model which is a probabilistic model and has been utilised extensively in the social science literature to study the dynamics of network formation from underlying locally prominent micro structures such as 2-star, 3-star, triangle and so on [15]. Although most of the studies about ERG focus on building the theory of ERG models, recently researchers have applied ERG models in practice, such as, to under-stand whether external connections beyond the department are important to the understanding of the departmental structure of an Australian Government Organisation [16], to explore the dynamics of biological networks [17] and to examining the communication dynamics of networks under stress [18]. This study considershospitalisation cost andreadmission rateas surrogate measures for the effect-iveness and efficiency of physician collaborations. There are several evidences of the use of readmission rate and hospitalisation costas outcome measures in the healthcare literature [19-21]. Further, this study utilisespatient ageas a control variable. The use of patient ageas a control or moderating variable has been found in several studies of the present healthcare literature [22,23].
'methods' section. The 'results' section describes the findings of this study. Finally, the 'discussion and conclusion' section discusses the findings of this study and provides some policy recommendations for healthcare managers or administra-tors. This section also makes a conclusion for this paper.
Literature review: collaboration in healthcare context There are numerous studies in current literature exploring the effect of collaboration among healthcare professionals on patient outcomes and hospital performance. Most of these studies explore hospital performance and patient outcomes by analysing collaboration networks among different healthcare professionals such as nurse-physician collaboration [9], physician-pharmacist collaboration [24], physician-patient collaboration [25], hospital-physician collaboration [26], and inter-professional and interdis-ciplinary collaboration [27]. Cunningham et al. [28] have conducted an orderly review of studies of professionals’ network structures, analysing factors connected with network effectiveness and sustainability, specifically in re-lation to the quality of care and patient safety. The authors explore MEDLINE, CINAHL, EMBASE, Web of Science and Business Source Premier from January 1995 to December 2009. A majority of 26 studies reviewed used social network analysis to analyse structural relationships in networks: structural relationships within and between networks, health professionals and their social context, health collaborations and partnerships, and knowledge sharing networks. Essential features of networks explored were administrative and clinical exchanges, network per-formance, integration, stability and influence on the qual-ity of healthcare. They have also noticed that more recent studies demonstrate that cohesive and collaborative health professional networks can promote the coordination of care and contribute to improving quality and safety of care. Structural network vulnerabilities include cliques, professional and gender homophily and over-reliance on central agencies or individuals. Efficient professional networks engage basic structural network features (e.g. bridge, broker, density, centrality, degree of separation, social capital and trust) in generating collaboratively oriented healthcare. This requires effective transmission of information and social and professional interaction within and across networks. For those using networks to improve care, recurring success factors are: understanding your network’s characteristics, attending to its functioning and investing time in facilitating its improvement. Despite this, there is no guarantee that time spent on networks will necessarily improve patient care.
Another classic study, led by Knaus and his team, identi-fies a significant relationship between the degree of nurse-physician collaboration and patient mortality in intensive care units [9]. They study treatment and outcome in 5030 intensive care unit patients and find that hospitals where
nurse-physician collaboration is presented report a lower mortality rate compared to the predicted number of pa-tient deaths. Conversely, hospitals that are noted for poor communication among healthcare professionals exceed their predicted number of patient deaths. In a two group quasi-experiment on 1207 general medicine patients (n = 581 in the experimental group who received care from a specially designed care management plan that facilitated higher collaboration among hospital staff and n = 626 in the control group who received the usual care), Cowan et al. [6] notice average hospital length of stay, total hospi-talisation cost, and hospital readmission rate are signi-ficantly lower for patients in the experimental group than the control group (5 versus 6 days, P < .0001) which contributes a ‘backfill profit’ of US$1591 per patient to hospitals. There are other studies that also highlight the importance of collaboration among healthcare profes-sionals for better patient outcomes.
Sommers et al. [29] examine the impact of an interdis-ciplinary and collaborative practice intervention involving a primary care physician, a nurse, and a social worker for community-dwelling seniors with chronic illnesses. They conduct a controlled cohort study of 543 patients in 18 private office practices of primary care physicians. The intervention group receives care from their primary care physician working with a registered nurse and a social worker, while the control group receives care as usual from primary care physicians. They notice that the inter-vention group produced better result to readmission rate and average office visits to all physicians. Moreover, the patients in the intervention group report an increase in social activities compared with the control group’s de-crease. There are other studies emphasising collaboration for effective patient outcome across professional bounda-ries within hospitals. By analysing data collected from 105 interviews (with 40 physician, 32 case managers, 23 phy-sician office staff, 8 administrators, and 2 case assistants), Netting and Williams [30] argue that there is a growing need to collaborate and communicate across professional lines rather than make assumptions about who can do what for better patient outcomes, professional satisfaction, and hospital performance.
improve the effectiveness of team-based approach to patient care [32]. However, none of these studies, to our knowledge, provides any guidelines: (i) about the network structure of effective collaboration; (ii) what type of collab-oration structure is more conducive compared to others; and (iii) on how individual healthcare professional should develop relations with others over time in a collaborative environment for better performance. This study considers only the physician collaboration and addresses all of these three issues by exploring PCNs using measures of social network analysis (SNA) and exponential random graph (ERG) models.
Physician collaboration network (PCN)
Collaboration in healthcare is defined as healthcare professionals accepting complementary roles and jointly working together, sharing accountability for problem-solving and making decisions to develop and implement plans for patient care [33,34]. Collaboration among physicians, nurses and other healthcare professionals increases team members’perception of each other’s type of knowledge and skills, leading to continued improve-ment in decision-making [35]. It can take place in both face-to-face interactions and electronically via fast-paced encounters such as e-mail. In whatever location or form, collaboration includes an exchange of beliefs and ideas that acknowledges the perspectives of all collaborators, whether or not agreement is accomplished in the inter-action [36]. To minimise misunderstandings, it is also essential to define what is not implied by the term ‘collaboration’. It does not imply supervision, nor is it simply a one-way or two-way information exchange. Efficient professional collaborative relationships require mutual respect [37]. They also call for trust and dili-gence. In complex and sophisticated healthcare systems, collaboration is generally challenging. Collaboration may seem idealistic and perhaps even non-realistic. However, Kramer and Schmalenberg [37] state that collaborative partnerships are worth the effort because they result in improved effects for patients as well as individual development for collaborators.
Collaboration between physicians has been poorly inves-tigated; the overwhelming focus of research on physicians has been on their collaboration with patients [38]. Inter-estingly, research on collaboration between physicians has focused on the discussion of medical mistakes, collegial control and other negatively recognised aspects of medical care [39-42]. One area that has been seen critical is the culture of medicine and the socialisation of medical students, interns, and residents into that culture by physi-cians [43,44]. Atkinson [38] argues that“biomedical know-ledge is socially produced and culturally specific . . . [and] dependent upon certain fundamental features of medical culture, which is itself produced and reproduced through
processes of socialisation” (p. 46). His study of haema-tologists’consultations with physicians of other specialties demonstrates the method of generating medical know-ledge through collaboration among physicians. According to Atkinson, physicians’communication is not the way to the accomplishment of medical work; the communication is the work.
In this study, it is assumed that collaborations among physicians emerge when they visit common hospitalised patients. It is a standard professional practice around the world that when physicians visit patients, they give advice or suggestions to patients based on their health condition and previous medication history deposited in the patient log book. All previous advice or suggestions by any physician to a patient have been taken into consideration during any subsequent physician visit to that patient. This kind of practice culture in healthcare organisations or hos-pitals enables us to map and, eventually, to model PCNs.
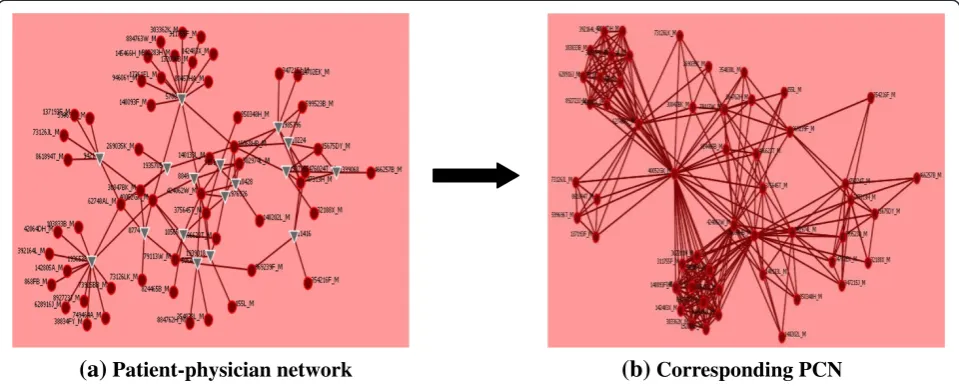
When physicians visit common patients within the same hospital or healthcare organisation PCN emerges among them. Figure 1 illustrates an example of such a PCN con-struction. In a hospital (say H1), patientPa1 is visited by Ph1,Ph2andPh4physicians, and patientPa2is visited by Ph2,Ph3andPh4 physicians, and physicianPh3 andPh4 visit patientPa3. This is depicted in thepatient-physician network in Figure 1(a). The corresponding PCN for this patient-physician network is demonstrated in Figure 1(b). In this PCN, there are network connections with weight 1 betweenPh1andPh2, betweenPh1andPh4, and between Ph2andPh3because they visit only one common patient. The weight of the links betweenPh2andPh4, and between Ph3andPh4are 2 as they have two common patients.
Methods
In explaining different SNA measures and ERG model, this study uses the terms actor(s) and node(s) interchange-ably. Similarly, the words link(s) and tie(s) are exchange-able in this paper.
Measures of social network analysis (SNA)
This study utilises SNA measures of degree centralisa-tion, betweenness centralisation, and network density. The selection of these three measures is guided by two network theories: (i) Bavelas’Centralisation Theory [45]; and (ii) Freeman’s Centrality Theory [46]. These two theories can explain structural influences of colla-boration and communication networks on the group performance.
Degree centralisation and betweenness centralisation
thus, the later one needs to be explained first before describing the former one. Centrality is an important con-cept in studying networks. In concon-ceptual terms, centrality measures how central an individual is positioned in a network.Degree centralityis one of basic measures of net-work centrality. For an actor, it is the proportion of nodes that are adjacent to that actor in a network. It highlights the node with the most links to other actors in a network, and can be defined by the following equation for the actor iin a network havingNactors [13]:
C0Dð Þ ¼ni d nð Þi
N−1 ð1Þ
Where, the subscript Dfor degree and d(ni) indicates
the number of actors with whom actor i is connected. The maximum value for C0Dð Þni is 1 when actor i is linked with all other actors in the network. For an isolate actor, its value is 0.
Betweenness centrality views an actor as being in a favoured position to the extent that the actor falls on the shortest paths between other pairs of actors in the net-work. That is, actors that occur on many shortest paths between the other pair of nodes have higherbetweenness centralitythan those they do not [46]. The betweenness centralityfor an actorni (i.e. CB(ni)) can be represented by the following equation [13]:
C0Bð Þ ¼ni X
j<k gjkð Þni
gjk
N−1 ð ÞðN−2Þ
½ =2 ð2Þ
Where, i≠ j≠ k; gjk(ni) represents the number of the
shortest paths linking the two actors that contain actori; and gjkis the number of the shortest paths linking actor
jand k. For the central actor of a start, C0Bð Þni will take its highest value of 1; however, for any peripheral actor of a starC0Bð Þni will take its minimum value of 0.
A centralisation measure quantifies the range or vari-ability of individual actor indices. The set of degree centralities, which represents the collection ofdegree indi-ces ofN actors in a network, can be summarised by the
following equation to measure networkdegree centralisa-tion[47]:
CD¼ XN
i¼1
CDð Þn −CDð Þni
½
N−1 ð ÞðN−2Þ
½ ð3Þ
Where, {CD(ni)} are thedegreeindices of Nactors and
CD(n*) is the largest observed value in thedegreeindices.
For a network, degree centralisation (i.e. the index CD)
reaches its maximum value of 1 when one actor chooses all other (N-1) actors and the other actors interact only with this one (i.e. the situation in a star graph). This index (i.e. CD) attains its minimum value of 0 when all
degrees are equal (i.e. the situation in a circle graph). Thus,CD indicates varying amounts of centralisation of
degreecompared to bothstarandcirclegraph.
Similarly, the set ofbetweenness centralities, which rep-resents the collection ofbetweennessindices ofNactors in a network, can be summarised by the following equation to measure networkbetweenness centralisation[47]:
CB¼ XN
i¼1
C0Bð Þn −C0Bð Þni
h i
N−1
ð Þ ð4Þ
Where, C0Bð Þni
are thebetweennessindices ofNactors andC0Bð Þn is the largest observed value in thebetweenness indices. Freeman [46] demonstrates that betweenness cen-tralisation reaches its maximum value of 1 for the star graph. Its minimum value of 0 occurs when all actors have exactly the samebetweennessindex.
Network density
The density of a network represents the proportion of existing ties (or, links) relative to the maximum number of possible ties among all actors of that network [13]. The densityvalue for a network is 1 only when all the actors of that network are connected with each other. On the other hand, for a completely sparse network, the density value is 0, which indicates there is no link exists between any two actors of that network. For an undirected network of size
Pa1 Ph4
Ph2
Pa2 Ph3
Ph1
Ph2 Ph4
Ph1 Ph3
(a)
Patient-physician network(b)
Corresponding PCN1
1 1
2 Pa3
[image:5.595.58.539.89.190.2]2
Figure 1Conceptualisation of the collaboration network among physicians.(a)Patient-physiciannetwork, and (b) Corresponding PCN (Pa
N(i.e. haveNactors), theoretically there are [N* (N−1)]/ 2 (i.e.NC
2) possible links among itsNactors. If there are
Ntlinks among itsNactors in that network, then,
math-ematically,densitycan be defined as [13]:
Density¼ 2 N
t
NðN−1Þ ð5Þ
Exponential random graph (ERG) models
ERG model can effectively identify structural properties in social networks [48]. This theory-driven modelling ap-proach also allows to test the significance of structural parameters in the process of the formation of a given network [18,49]. For instance, a given cost effective PCN may be explored using ERG model to examine what micro structures play a statistically significant role in the devel-opment process of this PCN. It simplifies a complex struc-ture down to a combination of basic parameters. The advantage of this approach is that it is very general and scalable as the architecture of the graph is represented by locally determined explanatory variables, and the choice of explanatory variables is quite flexible and can be easily revised. The disadvantage of this approach is the difficulty in estimating the execution time. The reason for that is that ERG models are based on simulation and execution time for simulation is always unpredictable [15]. Another disadvantage of ERG models is the complex interpretation when multiple parameters are considered and the diffi-culty to get convergence sometimes [15].
This paper follows the notation and terminology described in Robins et al. [50]. For each pairiand jof a set ofNactors, Xijis a network tie variable withXij = 1
if there is a network tie fromitoj, andXij= 0 otherwise.
This paper specifiesxij as the observed value ofXijwith
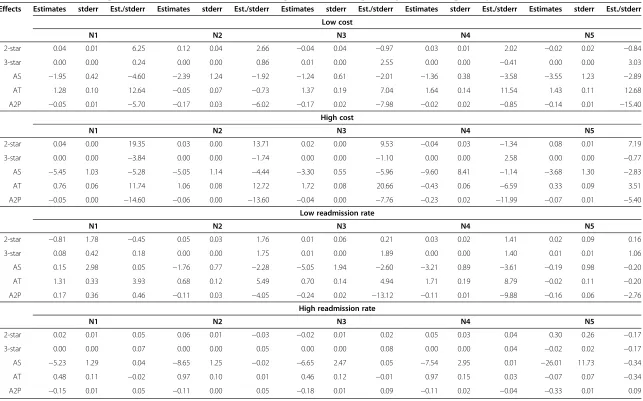
X the matrix of all variables and x the matrix of ob-served ties of the network. X may be directed or non-directed. A configuration is a set of nodes and a subset of ties among them. For example, an edgeis a subset of two nodes in which one node is connected by a tie to other, and a 3-star is a subset of four nodes in which one node is connected by a tie to each of the other three nodes. Similarly, n-star is a subset of n nodes in which one node is connected by a tie to each of the other(n-1) nodes. Configurations are defined hierarchically, so that a triangle also includes three 2-stars. The general form of the class of (homogeneous) ERG models is as follows [50]:
Pr Xð ¼xÞ ¼1 kexp
X
AηAgAð Þx
n o
ð6Þ
Where, (i) the summation is over configuration types A; different sets of configuration types represent differ-ent models (e.g. dyadic independence or Markov random graph); (ii) ηA is the parameter corresponding to a
configuration of typeA; (iii) gA(x)is the network
statis-tic corresponding to configuration A(for homogeneous Markov graph models this is the number of configura-tions of type A observed in the network: for example, the number of triangles); and (iv) κ is a normalising quantity to ensure that Eq. (6) is a proper probability distribution.
A commonly used sub-class of ERG models is the Markov random graph in which a possible tie from itoj is assumed conditionally dependent only on other possible ties involvingiand/orj[51]. This sub-class of ERG model is also known as the low-order model. An example of a Markov random graph model for non-directed networks, withedge(or,density),2-star,3-starandtriangle parame-ters, is given below [52]:
Pr Xð ¼xÞ ¼1
k expfθL xð Þ þσ2S2ð Þ þx σ3S3ð Þ þx τT xð Þg ð7Þ
In Eq. (7), θ is the density or edgeparameter and L(x) refers to the number of edges in the graph x; σk and
Sk(x)refer to the parameter associated withk-stareffects
and the number ofk-stars inx; whileτandT(x)refer to the parameter for triangles and the number of triangles, respectively. For a given observed network x, parameter estimates indicate the strength of effects in the data. For instance, a large and positive estimate for σ2 suggests that, given the observed number of edges and stars, net-works with more2-starsare more likely. The configura-tions and parameters of Markov random graph model (i.e. low-order model) is shown on Figure 2a. These pa-rameters relate to some well-known structural regularity in the network literature and represent structural ten-dencies in the network (e.g. mutuality and transitivity). They were chosen because they are conceptualised as forces which drive the formation of the network itself. For example, transitivity is conceptualised as a force which drives the formation of the network itself (the friends of our friends are more likely to be our friends). Snijders et al. [15] later propose three new configura-tions (i.e. alternating k-stars, alternating k-triangles and alternating independent two-paths) that can be included in specifications for ERG models. They define a new sub-class of Markov random graph model (i.e. high-order model), which considers parameters of both Figure 2a,b. This study utilises both high- and low-order ERG models for modelling PCNs.
estimation for Markov random graph models is the maximum pseudo likelihood [53]. The properties of the pseudo-likelihood estimator are not well understood and the pseudo-likelihood estimates can at best be thought of as approximate. Also, it is not clear from existing research as to when pseudo-likelihood estimates may be acceptable. Therefore, Monte Carlo Markov chain maximum (MCMC) likelihood estimation, when available, is the preferred estimation procedure. This study also uses this estimator. That means this study utilises Markov random sub-class of ERG models for modelling cross-sectional PCNs and maximum Monte Carlo Markov chain max-imum (MCMC) estimator for estimation purpose.
Research dataset
This research utilises health insurance claim dataset to explore physician collaborations using measures of SNA and ERG models. This dataset is provided by a non-profit health insurance organisation (i.e. Hospital Con-tribution Fund, HCF), which is the third largest health insurance organisation in Australia. It includes mem-bers’ claim data from January 2005 to February 2009. This dataset contains mainly three different categories of claim information: (i) ancillary claim (lodged by hospital); (ii) medical claim (lodged by doctor or physi-cians); and (iii) hospital claim (lodged by hospital). Ancillary claims are auxiliary claims for medical ser-vices such as dental, optical, physiotherapy, dietician, and pharmaceutical. All claims lodged by specialist phy-sicians, except of the ancillary type, aremedical claims. The claims for the services provided to hospitalised patients in private or public hospitals that are approved by the Department of Health, Australia are considered as hospital claims. In general, patients have medical
claims, hospital claims, and very few ancillary claims for their admissions to hospitals. This study uses the claim information to construct PCN for a particular type of hospitalised patients (e.g. knee surgery patient).
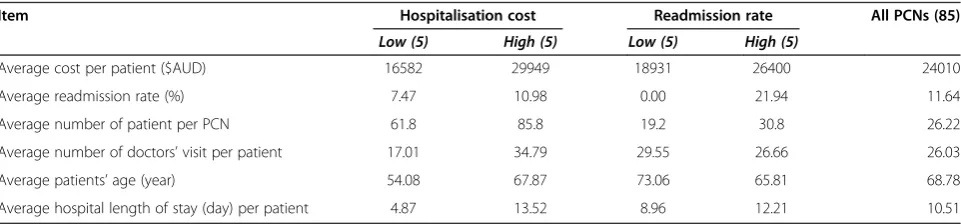
As people have hospital admissions for a wide range of illness and patients with a particular disease need to be seen by particular specialist physicians, different types of PCNs (e.g. a PCN for knee surgery patients and a PCN for heart surgery patients) are being evolved inside a hospital for hospitalised patients suffering from different types of diseases. For research analysis purpose, this study considers PCNs only for total hip replacement (THR) patients from 85 different hospitals where at least 5 THR patients get admitted during the data collection period. So, 85 PCNs evolved within these 85 hospitals. In these hospitals, 2229 patients get admitted during our data collection period. These patients lodged in total 1383 ancillary claims, 65871 medical claims, and 23369 hospital claims. The basic statistics of these 85 PCNs is given in Table 1 (last column).
To explore physician collaborations using SNA mea-sures, these 85 PCNs are used in this research. However, for ERG modelling, this study utilises 20 PCNs. In particu-lar, this study considers 5 most expensive PCNs (termed ashigh-costPCNs) and 5 least expensive PCNs (termed as low-costPCNs) to explore, using ERG models, how micro-level network structures varied for PCNs having different total hospitalisation cost. For modelling PCN in terms of readmission rate, this study considers 5 PCNs that have the highest readmission rate (termed as high-readmission PCNs) and compare their structures with 5 PCNs which have the lowestreadmission rate(termed aslow-readmission PCNs). The basic statistics of these 20 PCNs is given in Table 1 (the first 5 columns).
Density or Edge (θ)
Two-Star (σ2)
Three-Star (σ3)
Triangle (τ)
Alt-K-Stars (AS)
Alt-K-Triangles (AT)
Alt-K-2-Paths (A2P)
[image:7.595.60.540.517.714.2]Dependent variable: Hospitalisation cost and readmission rate
Hospitalisation cost
In calculatinghospitalisation cost, this study considers all payments made by the health insurance organisation for each THR patient to the health service providers, regard-less of how much that patient pays in return to the health insurance organisation (which depends on the health in-surance policy type and percentage of coverage amount).
Readmission rate
For any PCN, readmission rate represents the ratio of patients (in percentage) who have hospital admissions more than once for their THR surgeries. That means,
Readmission Rate PCNð Þ
¼No:of THR patient sð Þwho admitted more than once
Total admitted THR patients 100%
ð8Þ
Control variable: patient age
For each PCN, the average age for all patients is calcu-lated. This average age is considered as control variable to investigate whether thepatient agehas any impact for the relation of SNA measures of PCN with hospitalisa-tion costand hospitalreadmission rate.
Results
This section reports the results of this study.
Mapping physician collaboration network (PCN) from insurance claim dataset
From themedical claimdetails of HCF dataset, the num-ber of physicians visit a particular hospitalised patient during her or his hospitalisation period can be revealed because physicians make a medical claim to HCF for every single visit to hospitalised patients. Based on this information and by applying the PCN development ap-proach (as illustrated in Figure 1) and process (described in section 3), the structure of PCN of each hospital for THR patients has been constructed. An example of the
construction of PCN structure from the research dataset is given in Figure 3. Organisation Risk Analyser (ORA), which is a meta-network assessment and analysis tool [54], is utilised to construct such PCNs.
Social network analysis (SNA) measure and physician collaboration network (PCN)
SNA measures and their impact on the hospitalisation costand readmission rate are illustrated in Table 2. This table also shows the descriptive statistics (i.e. mean and standard deviation) of each variable. Although degree centralisation does not show a correlation with hospita-lisation cost (rho = 0.112, p>0.05 at 2-tailed), it shows negative correlation withreadmission rate(rho =−0.373, p<0.01 at 2-tailed). An increase in degree centralisation produces a downturn for readmission rate. Density of PCN is positively correlated with bothhospitalisation cost (rho = 0.282, p<0.01 at 2-tailed) and readmission rate (rho = 0.358, p<0.01 at 2-tailed). Bothhospitalisation cost and readmission rate of a hospital change proportionally with the change in thedensityof the PCN of that hospital. On the other hand, the correlation coefficient values of Table 2 reveals that betweenness centralisation of PCN is negatively correlated with both hospitalisation cost (rho = −0.264, p<0.05 at 2-tailed) andreadmission rate (rho = −0.283, p<0.01 at 2-tailed). As it is always expected to have low hospitalisation cost and readmis-sion rate, this result indicates that low betweenness centralisation is not conducive for healthcare service providers or hospitals. We also develop simple linear re-gression models for each of hospital outcome variables (i.e.hospitalisation costandreadmission rate) and PCN estimates (i.e.degree centralisation,betweenness centralisa-tion anddensity). These models, as described in Table 3, allow checking relative influence and independence in the associations of independent network variables and dependent hospital outcome variables. All models, except the first model (i.e. considering degree centralisation and hospitalisation cost), show statistically significant output.
[image:8.595.58.539.621.733.2]The effect of patient age as control (or moderating) variable is summarised in Table 4. We develop regression models by considering each of the network measures and
Table 1 Summary statistics of 5 low-cost, 5 high-cost, 5 low-readmission, 5-high readmission rate and the total 85 PCNs
Item Hospitalisation cost Readmission rate All PCNs (85)
Low (5) High (5) Low (5) High (5)
Average cost per patient ($AUD) 16582 29949 18931 26400 24010
Average readmission rate (%) 7.47 10.98 0.00 21.94 11.64
Average number of patient per PCN 61.8 85.8 19.2 30.8 26.22
Average number of doctors’visit per patient 17.01 34.79 29.55 26.66 26.03
Average patients’age (year) 54.08 67.87 73.06 65.81 68.78
its product withpatient age. To show controlling effect, the product of network measure and patient age must show significant association with hospital outcome vari-ables in these regression models [55]. Out of these six models, this product shows a significant association in only two cases (i.e. the second and the third models of Table 4). That means patient age moderates only the relations of betweenness centralisation and density of the PCN with hospitalisation cost. In most cases (i.e. 4 out of 6),patient agedoes not moderate the relation be-tween PCN attributes and hospital outcome measures. This can be explained by the fact that we do consider average age of all patients in calculatingpatient agefor a PCN. On the other hand, studies of present healthcare literature consider patient age at the individual level, not at the aggregate level as like this study.
Exponential random graph (ERG) model and physician collaboration network (PCN)
Pneta[1] has been used in this study to fit ERG models with different types of PCNs (i.e.low-costversushigh-cost and low-readmission versushigh-readmission). After fol-lowing several iterative processes, the model (i.e. 2-star, 3-star, alternating-k-stars, alternating- k-triangles and alternating-k-two-pathsmodel) had been found to fit with PCNs. The results for this model are shown in Table 5. The weights of different micro-structures (e.g.2-starand3-star) of this model can be tested using t-value(also known as t-statistics), which is defined by dividing theestimateby its standard error. Thus, the t-value measures how many standard errorstheestimateis away from zero. Generally, any t-value greater than +2 or less than−2 (i.e. absolute t-value is greater than 2) is acceptable. The higher the
(b)
Corresponding PCN
[image:9.595.58.538.90.283.2](a)
Patient-physician network
[image:9.595.55.542.562.718.2]Figure 3Construction of PCN from research dataset.The red circle represents physician and the gray triangle represents patient.
Table 2 Descriptive statistics (M indicates mean and STD indicates standard deviation) and pair wise correlation coefficient values for all variables (i.e. SNA variables, hospitalisation cost and readmission rate) used in this study
[1] [2] [3] [4] [5]
[1]Degree centralisation
(M = 0.75 and STD = 0.13)
[2]Betweenness centralisation −0.062
(M = 0.25 and STD = 0.14)
[3]Network density 0.045 −0.046
(M = 0.27 and STD = 0.11)
[4]Hospitalisation cost 0.112 −0.264* 0.282**
(M = 24009.9 and STD = 6783.3)
[5]Readmission rate −0.373** −0.283** 0.358* 0.098
(M = 11.64 and STD = 8.48)
**
. Correlation is significant at the 0.01 level (2-tailed).
*
t-value, the greater the confidence is shown by the param-eter under consideration as a predictor. Lowt-valueis the indication of a low reliability of the predictive power of that parameter [56]. To compare t-values of different networks, researchers utilise thet-testmethod [49].
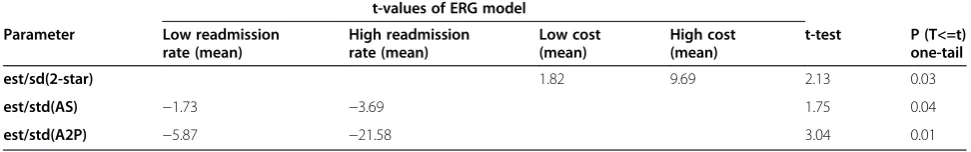
The parameter interpretation of the fitted ERG model is summarised as follows. The positive2-starparameter indicates that there is a tendency for multiple network partners. There is a significant difference in t-value of the2-star parameter betweenhigh-cost PCNs and low-cost PCNs (Table 5). A t-test in Table 6 shows this significance (t (10) = 2.13, p<0.05). The results show that on average, the2-starparameter forlow-costPCNs (M = 1.82, SE = 1.33) is less positive (int-values) than the parameter for high-cost PCNs (M = 9.67, SE = 3.45). This indicates that the tendency for multiple network partners is more forhigh-costPCNs thanlow-costPCNs. It can be suggested from this trend that most of the actors ofhigh-costPCNs have multiple network partner-ships with others. This means that high-cost PCNs are well connected, but there is a low probability of having any network-hub (i.e. a highly connected actor), which indicates that these networks (i.e. high-cost PCNs) are decentralised.
Therefore, as PCNs become more centralised, the per-formance (i.e. inverse of cost) of the network will increase compared to decentralised PCNs.
There is a significant difference in t-value of the alternating-k-star parameter between high- readmission PCNs and low-readmission PCNs (Table 5). A t-test in Table 6 shows this significance (t (10) = 1.75, p<0.05). The results show that on average, thek-starparameter for high-readmissionPCNs (M=−3.69, SE = 0.87) is more negative than the parameter forlow-readmissionPCNs (M =−1.73, SE = 0.71). The negativealternating-k-starparameter indi-cates that networks with some higher degree nodes are less probable, which means there is no actor playing the role of network-hubs. This means that high-readmission PCNs are more decentralised. This indicates that as PCNs become more centralised, the performance (i.e. inverse of readmission rate) of the network will improve compared to decentralised PCNs.
[image:10.595.57.539.112.209.2]A significant difference in t-value for the alternating-k-2-paths parameter has been noticed between high-readmission PCNs andlow-readmission PCNs (Table 5). A t-test in Table 6 shows this significance (t (10) =3.04, p<0.05). The results show that on average, the alternating-k-two-paths parameter for high-readmission PCNs (M =
Table 3 Linear regression models between each of network attributes (i.e.degree centralisation,betweenness
centralisationanddensity) of PCN and hospital performance measures (i.e.hospitalisation costandreadmission rate)
Model Dependent variable Independent variable R2value
β Constant Significance
1 Hospitalisation cost Degree centralisation 0.012 5906.42 19545.39 0.309
2 Readmission rate Degree centralisation 0.139 −37.87 45.48 0.003
3 Hospitalisation cost Betweenness centralisation 0.107 −12384.79 27101.96 0.015
4 Readmission rate Betweenness centralisation 0.112 −25.18 18.19 0.010
5 Hospitalisation cost Density 0.118 17310.51 19635.69 0.009
[image:10.595.55.540.551.733.2]6 Readmission rate Density 0.196 49.08 3.427 0.000
Table 4 Linear regression models for checking controlling effect ofpatient ageon the relation between each of
network attributes (i.e.degree centralisation,betweenness centralisationanddensity) of PCN and hospital performance
measures (i.e.hospitalisation costandreadmission rate)
Model Dependent variable R2value Constant Independent variable β Significance
1 Hospitalisation cost 0.102 20016.04 Degree centralisation -26621.75 0.084
Degree centralisation * Age 463.16 0.102
2 Hospitalisation cost 0.227 27106.44 Betweenness centralisation -102698.68 0.000
Betweenness centralisation * Age 1318.36 0.000
3 Hospitalisation cost 0.188 19216.11 Density -60258.64 0.016
Density * Age 1155.44 0.001
4 Readmission rate 0.113 45.82 Degree centralisation -50.37 0.078
Degree centralisation * Age 0.18 0.622
5 Readmission rate 0.094 18.17 Betweenness centralisation -75.92 0.110
Betweenness centralisation * Age 0.745 0.273
6 Readmission rate 0.081 1.318 Density 20.08 0.677
Effects Estimates stderr Est./stderr Estimates stderr Est./stderr Estimates stderr Est./stderr Estimates stderr Est./stderr Estimates stderr Est./stderr
Low cost
N1 N2 N3 N4 N5
2-star 0.04 0.01 6.25 0.12 0.04 2.66 −0.04 0.04 −0.97 0.03 0.01 2.02 −0.02 0.02 −0.84
3-star 0.00 0.00 0.24 0.00 0.00 0.86 0.01 0.00 2.55 0.00 0.00 −0.41 0.00 0.00 3.03
AS −1.95 0.42 −4.60 −2.39 1.24 −1.92 −1.24 0.61 −2.01 −1.36 0.38 −3.58 −3.55 1.23 −2.89
AT 1.28 0.10 12.64 −0.05 0.07 −0.73 1.37 0.19 7.04 1.64 0.14 11.54 1.43 0.11 12.68
A2P −0.05 0.01 −5.70 −0.17 0.03 −6.02 −0.17 0.02 −7.98 −0.02 0.02 −0.85 −0.14 0.01 −15.40
High cost
N1 N2 N3 N4 N5
2-star 0.04 0.00 19.35 0.03 0.00 13.71 0.02 0.00 9.53 −0.04 0.03 −1.34 0.08 0.01 7.19
3-star 0.00 0.00 −3.84 0.00 0.00 −1.74 0.00 0.00 −1.10 0.00 0.00 2.58 0.00 0.00 −0.77
AS −5.45 1.03 −5.28 −5.05 1.14 −4.44 −3.30 0.55 −5.96 −9.60 8.41 −1.14 −3.68 1.30 −2.83
AT 0.76 0.06 11.74 1.06 0.08 12.72 1.72 0.08 20.66 −0.43 0.06 −6.59 0.33 0.09 3.51
A2P −0.05 0.00 −14.60 −0.06 0.00 −13.60 −0.04 0.00 −7.76 −0.23 0.02 −11.99 −0.07 0.01 −5.40
Low readmission rate
N1 N2 N3 N4 N5
2-star −0.81 1.78 −0.45 0.05 0.03 1.76 0.01 0.06 0.21 0.03 0.02 1.41 0.02 0.09 0.16
3-star 0.08 0.42 0.18 0.00 0.00 1.75 0.01 0.00 1.89 0.00 0.00 1.40 0.01 0.01 1.06
AS 0.15 2.98 0.05 −1.76 0.77 −2.28 −5.05 1.94 −2.60 −3.21 0.89 −3.61 −0.19 0.98 −0.20
AT 1.31 0.33 3.93 0.68 0.12 5.49 0.70 0.14 4.94 1.71 0.19 8.79 −0.02 0.11 −0.20
A2P 0.17 0.36 0.46 −0.11 0.03 −4.05 −0.24 0.02 −13.12 −0.11 0.01 −9.88 −0.16 0.06 −2.76
High readmission rate
N1 N2 N3 N4 N5
2-star 0.02 0.01 0.05 0.06 0.01 −0.03 −0.02 0.01 0.02 0.05 0.03 0.04 0.30 0.26 −0.17
3-star 0.00 0.00 0.07 0.00 0.00 0.05 0.00 0.00 0.08 0.00 0.00 0.04 −0.02 0.02 −0.17
AS −5.23 1.29 0.04 −8.65 1.25 −0.02 −6.65 2.47 0.05 −7.54 2.95 0.01 −26.01 11.73 −0.34
AT 0.48 0.11 −0.02 0.97 0.10 0.01 0.46 0.12 −0.01 0.97 0.15 0.03 −0.07 0.07 −0.34
A2P −0.15 0.01 0.05 −0.11 0.00 0.05 −0.18 0.01 0.09 −0.11 0.02 −0.04 −0.33 0.01 0.09
Health
Services
Research
2013,
13
:234
Page
11
of
14
ntral.com/1
[image:11.794.63.706.103.504.2]−21.58, SE = 4.55) is more negative than the alternating-k-two-paths for low-readmission PCNs (M = −5.87, SE = 2.47). The negative parameter of alternating-k-two-pathindicates that the network does not tend to form cy-cles and this tendency is higher inhigh-readmissionPCNs. So inhigh-readmissionPCNs, the tendency to form cycles will be less.
Discussion and conclusion
In this study, PCNs are constructed from the information of physicians’visits to patients during their hospitalisation period. It is assumed that collaboration emerges between two physicians when they visit a common patient. It is a standard professional practice that when physicians visit patients they give advice or suggestions to patients based on their health condition and previous medication history deposited in the patient log book. All previous advice or suggestions prescribed by any physician to a patient have been taken into consideration during any subsequent physician visit to that patient. In addition, physicians often have been informed about the patient condition by other physicians who previously visited that patient. This kind of practice culture in healthcare organisations or hospitals establishes the validity and reliability of the construction process of PCN, and the generic nature of the research findings.
It is noticed that SNA measures ofdensityfor PCN has a positive correlation with hospitalisation cost and re-admission rate. In a dense PCN, an increased number of links exists among physicians. Although connections with peers enable physicians a faster sharing of known know-ledge [57], links with many peers significantly impacts an individual’s opportunity to share or create knowledge in a network (e.g. PCN). This is because when an individual has many links in a network, she needs to spend more time to maintain these relationships. Moreover, she will receive repetitive or contradictory knowledge, in addition to new knowledge, from many individuals which will make it difficult to summarise these shared knowledge [58]. Un-like density, the SNA measure of betweenness centralisa-tionhas negative correlation with bothhospitalisation cost and readmission rate. From the perspective of a PCN structure, a highbetweenness centralisationindicates that the structure of the corresponding PCN follows astar-like or centralised structure since betweenness centralisation
reaches its highest value of 1 for a star network. A star-like or centralised network has few actors with higher betweenness centralityvalues. In this type of network, only a small number of actors play major collaboration and communication role. Therefore, in their corresponding hospitals, healthcare managers or administrators have to encourage or establish a star-like or centralised PCN in order to reduce bothhospitalisation costandreadmission rate. A PCN with a flat network structure (i.e. members of that PCN have almost equal network participation) will have highhospitalisation costandreadmission rate.
Although this study finds that social network measures have statistically significant correlations with hospitalisa-tion cost and readmission rate the corresponding correl-ation coefficient values do not show perfect correlcorrel-ations (i.e. a correlation coefficient value of 1) among them. The correlation coefficient values are ranging from 0.112 to 0.358 in absolute values. That means none of the relations shows perfect correlation. However, five of these values (see Table 2) are statistically significant at 0.01 and 0.05 levels (2-tailed). This is because of the sample size used in this study. This study uses 85 PCNs to explore the effects of different SNA measures onhospitalisation costand re-admission rate. A small correlation coefficient value could be statistically significant if sample size is high; whereas, for a small sample size a high correlation coefficient value would not be statistically significant [59]. A correlation co-efficient value of 0.04, for instance, would be statistically significant for a sample size of 10,000 [59]. We also quan-tify the impact of social network measures on hospital outcome variables using simple linear regression models (see Table 3).
[image:12.595.55.541.103.179.2]From the ERG model (i.e. 2-star, 3-star, alternating-k-stars,alternating- k-trianglesandalternating-k-two-paths model), significant differences are noticed in t-values for different micro-structures betweenhigh-readmissionPCNs andlow-readmissionPCNs. Thealternating-k-star param-eter shows a stronger negative value forhigh-readmission PCNs compared to low-readmission PCNs. Similarly, alternating-k-two-path shows more negative values for high-readmission PCNs compared to low-readmission PCNs. In summary,high-readmissionPCNs are attributed with tronger negative values for alternating-k-star and alternating-k-two-pathparameters. Negativet-value for an alternating-k-star parameter implies that networks with
Table 6t-testfor thet-valuesof different parameters of ERG model
t-values of ERG model
Parameter Low readmission
rate (mean)
High readmission rate (mean)
Low cost (mean)
High cost (mean)
t-test P (T<=t)
one-tail
est/sd(2-star) 1.82 9.69 2.13 0.03
est/std(AS) −1.73 −3.69 1.75 0.04
well-connected nodes are less probable (i.e. lack of the presence of network-hub). Negative t-value for an alternating-k-two-path parameter reveals that network actors are less likely to form cycles (i.e. networks are most sparse). From the interpretation of the findings of these two parameters (i.e. alternating-k-star and alternating-k-two-path) it can be concluded thathigh-readmissionPCNs are decentralised. And low-readmission PCNs are more centralised compared tohigh-readmissionPCNs.Low-cost PCNs andhigh-costPCNs also have micro-structural dif-ferences that are statically significant. Thet-valueof2-star parameter is more positive for high-costPCNs compared to low-cost PCNs. So, in high-cost PCNs, actors tend to have multiple partnerships with other network actors. That meanshigh-costPCNs are well connected and have a low chance of having any network-hub (i.e. highest degree actors). Therefore, high-cost PCNs are less centralised. And low-cost PCNs are more centralised compared to high-cost PCNs. To summarise, the findings from ERG models, bothlow-readmission rateandlow-costPCNs are more centralised compared to their counterparts. There-fore, in their corresponding PCNs, physicians have to be close to each other; and they should not work standalone or in disconnected small groups. A centralised PCN en-ables effective knowledge sharing among its member phy-sicians, which eventually leads to better patient care [57].
In respect of the network data analysis using ERG model, this study intends to explore micro-level struc-tures (e.g. 2-star and 3-star) that are associated with dif-ferent PCNs characterised by the highesthospitalisation cost versus lowest hospitalisation cost and highest re-admission rate versus lowest readmission rate. For this purpose, this study considers only the top 5 PCNs from all these four groups instead of considering all 85 PCNs of our research dataset.
This research is not without its limitations. First, we test relations between PCN attributes and healthcare care outcome measures and ERG models using the health insurance dataset only for THR patients. Thus, we need to consider dataset for other patients such as knee surgery patients or patients suffering from brain cancer in order to claim the general nature of the find-ings of this study. Second, we consider only quantitative measures (i.e. hospitalisation cost and readmission rate) as outcome variables. We do not consider any qualitative measures (e.g. patients’satisfaction) as outcome variables. Finally, we consider only 20 PCNs for ERG modelling, which significantly limits the interpretation of the ERG findings. This is because, in this study we aim to explore structural differences in PCNs classified as high and low in terms ofhospitalisation costandreadmission rate.
To conclude, this study first proposes a way to capture networks that evolve among physicians during the course of providing treatments to hospitalised patients. Second,
SNA measures are utilised to explore PCNs. It is noticed that density has positive correlation with hospitalisation cost and readmission rate; whereas, betweenness central-isation is negatively associated with hospitalisation cost andreadmission rate.Degree centralisationshows no sig-nificant correlation withhospitalisation costand negative correlation with readmission rate. Finally, an ERG model is fitted with different types of PCNs (i.e. low-costversus high-cost and low-readmission versus high- readmission). From the ERG model, it is found that PCNs, which are at-tributed with less negative t-values for alternating-k-star andalternating-k-two-pathparameters, and lowert-values for2-star parameter, are more conducive to performance in terms of low hospitalisation costand low readmission ratefor patient hospital admissions. Healthcare managers and hospital administrators may follow the findings of this study in promoting the physician collaborations structure within their organisations.
Endnote
a
http://www.sna.unimelb.edu.au/pnet/pnet.html.
Competing interests
The authors declare that they have no competing interests.
Authors’contributions
SU: study design, data collection, data analysis and writing. LH: study design, writing. JH: data analysis and writing. AA: writing. All authors read and approved the final manuscript.
Author details 1
Complex System Research Centre, The University of Sydney, Sydney NSW 2006, Australia.2Sydney School of Public Health, Sydney Medical School, The University of Sydney, Sydney NSW 2006, Australia.
Received: 3 June 2011 Accepted: 20 June 2013 Published: 26 June 2013
References
1. Sawyer M, Weeks K, Goeschel CA, Thompson DA, Berenholtz SM, Marsteller JA, Lubomski LH, Cosgrove SE, Winters BD, Murphy DJ:Using evidence, rigorous measurement, and collaboration to eliminate central catheter-associated bloodstream infections.Crit Care Med2010,38:S292. 2. Uddin S, Hossain L, Kelaher M:Effect of physician collaboration network on hospitalization cost and readmission rate.Eur J Public Health2012,
22(5):629–633.
3. Chukmaitov A, Devers KJ, Harless DW, Menachemi N, Brooks RG:Strategy, structure, and patient quality outcomes in ambulatory surgery centers (1997–2004).Med Care Res Rev2011,68(2):202–225.
4. De Vreede GJ, Briggs RO:Collaboration engineering: designing repeatable processes for high-value collaborative tasks.InHICSS '05 Proceedings of the 38th Annual Hawaii International Conference on Systems Sciences; 2005:17c.
5. Knoben J, Oerlemans L:Proximity and inter-organizational collaboration: a literature review.Int J Manag Rev2006,8(2):71–89.
6. Cowan M, Shapiro M, Hays R, Afifi A, Vazirani S, Ward C, Ettner S:The effect of a multidisciplinary hospitalist/physician and advanced practice nurse collaboration on hospital costs.J Nurs Adm2006,36(2):79.
7. Tschannen D, Kalisch B:The effect of variations in nurse staffing on patient length of stay in the acute care setting.West J Nurs Res2009,
31(2):153.
9. Knaus WA, Draper EA, Wagner DP, Zimmerman JE:An evaluation of outcome from intensive care in major medical centers.Annals of Internal Medicine1986,104(3):410.
10. Baggs J, Schmitt M, Mushlin A, Mitchell P, Eldredge D, Oakes D, Hutson A:
Association between nurse-physician collaboration and patient outcomes in three intensive care units.Crit Care Med1999,27(9):1991. 11. Lindeke L, Sieckert A:Nurse-physician workplace collaboration.Online J
Issues Nurs2005,10(1):10.
12. Uddin MS, Hossain L:Exploring physical, mental and psychological health for elders through their personal networks. InIn e-Health Networking, Applications and Services.Sydney: IEEE; 2009:29–35.
13. Wasserman S, Faust K:Social network analysis: Methods and applications.
Cambridge: Cambridge University Press; 2003.
14. Carrington P, Scott J, Wasserman S:Models and methods in social network analysis.Cambridge: Cambridge Univ Pr; 2005.
15. Snijders TAB, Pattison PE, Robins GL, Handcock MS:New specifications for exponential random graph models.Sociol Methodol2006,36(1):99–153. 16. Robins G, Pattison P, Woolcock J:Missing data in networks: exponential
random graph (P*) models for networks with non-respondents. Soc Networks2004,26(3):257–283.
17. Saul ZM, Filkov V:Exploring biological network structure using exponential random graph models.Bioinformatics2007,23(19):2604–2611. 18. Hamra J, Uddin S, Hossain L:Exponential random graph modeling of
communication networks to understand organizational crisis.InSIGMIS annual conference on Computer personnel research: 2011.78: ACM; 2011:71. 19. Chen LM, Jha AK, Guterman S, Ridgway AB, Orav EJ, Epstein AM:Hospital
cost of care, quality of care, and readmission rates: penny wise and pound foolish?Arch Intern Med2010,170(4):340.
20. Ross JS, Chen J, Lin Z, Bueno H, Curtis JP, Keenan PS, Normand SLT, Schreiner G, Spertus JA, Vidán MT:Recent national trends in readmission rates after heart failure hospitalization.Circ Heart Fail2010,3(1):97. 21. Reiter KL, Sandoval GA, Brown AD, Pink GH:CEO compensation and
hospital financial performance.Med Care Res Rev2009,66(6):725–738. 22. Mahmoud N, Turpin R, Yang G, Saunders W:Impact of surgical site
infections on length of stay and costs in selected colorectal procedures. Surg Infect2009,10(6):539.
23. Husted H, Holm G, Jacobsen S:Predictors of length of stay and patient satisfaction after hip and knee replacement surgery: fast-track experience in 712 patients.Acta Orthop2008,79(2):168–173. 24. Hunt JS, Siemienczuk J, Pape G, Rozenfeld Y, MacKay J, LeBlanc BH,
Touchette D:A randomized controlled trial of team-based care: impact of physician-pharmacist collaboration on uncontrolled hypertension. J Gen Intern Med2008,23(12):1966–1972.
25. Arbuthnott A, Sharpe D:The effect of physician-patient collaboration on patient adherence in non-psychiatric medicine.Patient Educ Couns2009,
77(1):60–67.
26. Burns LR, Muller RW:Hospital physician collaboration: landscape of economic integration and impact on clinical integration.Milbank Q2008,
86(3):375–434.
27. Gaboury I, Bujold M, Boon H, Moher D:Interprofessional collaboration within Canadian integrative healthcare clinics: Key components.Soc Sci Med2009,69(5):707–715.
28. Cunningham FC, Ranmuthugala G, Plumb J, Georgiou A, Westbrook JI, Braithwaite J:Health professional networks as a vector for improving healthcare quality and safety: a systematic review.BMJ Quality & Safety
2012,21(3):239–249.
29. Sommers L, Marton K, Barbaccia J, Randolph J:Physician, nurse, and social worker collaboration in primary care for chronically ill seniors.Arch Intern Med2000,160(12):1825–1833.
30. Netting F, Williams F:Case manager-physician collaboration: implications for professional identity, roles, and relationships.Health Soc Work1996,21(3): 31. Fattore G, Frosini F, Salvatore D, Tozzi V:Social network analysis in primary
care: the impact of interactions on prescribing behaviour.Health Policy
2009,92(2):141–148.
32. Meltzer D, Chung J, Khalili P, Marlow E, Arora V, Schumock G, Burt R:
Exploring the use of social network methods in designing healthcare quality improvement teams.Soc Sci Med2010,71(6):1119–1130. 33. Fagin CM:Collaboration between nurses and physicians: no longer a
choice.Acad Med: journal of the Association of American Medical Colleges
1992,67(5):295.
34. Baggs JG, Schmitt MH:Collaboration between nurses and physicians. J Nurs Scholarsh1988,20(3):145–149.
35. Christensen C, Larson JR:Collaborative medical decision making. Med Decis Making1993,13(4):339–346.
36. Lindeke LL, Sieckert AM:Nurse-physician workplace collaboration. Online J Issues Nurs2005,10(1):5.
37. Kramer M, Schmalenberg C:Securing" good" nurse/physician relationships.Nurs Manage2003,34(7):34.
38. Atkinson P:Medical talk and medical work: the liturgy of the clinic.London: Sage Publications Ltd; 1995.
39. Bosk CL:Forgive and remember: managing medical failure.Chicago: University of Chicago Press; 1979.
40. Freidson E:Doctoring together: A study of professional social contro.Chicago: University of Chicago Press; 1980.
41. Millman M:The unkindest cut: Life in the backrooms of medicine.Morrow Quill Paperbacks; 1977.
42. Pettinari CJ:Task, talk and text in the operating room: study in medical discourse (Advances in discourse processes) (v. 33).Recherche1989,
67:02.
43. Atkinson P:The ethnography of a medical setting: reading, writing, and rhetoric.Qual Health Res1992,2(4):451–474.
44. Hunter KM:Doctors' stories: The narrative structure of medical knowledge.
Princeton Univ Pr; 1993.
45. Bavelas A:Communication patterns in task-oriented groups.J Acoust Soc Am1950,22:725–730.
46. Freeman L:Centrality in social networks: conceptual clarification. Soc Networks1978,1(3):215–239.
47. Freeman L, Roeder D, Mulholland R:Centrality in social networks: II. experimental results.Soc Networks1979,2(80):119–141.
48. Wasserman S, Pattison P:Logit models and logistic regressions for social networks: I. An introduction to Markov graphs and P.Psychometrika1996,
61(3):401–425.
49. Uddin S, Hamra J, Hossain L:Exploring communication networks to understand organizational crisis using exponential random graph models.Comput Math Organ Theory2013,19(1):25–41.
50. Robins G, Snijders T, Wang P, Handcock M, Pattison P:Recent developments in exponential random graph (p*) models for social networks.Soc Networks2007,29(2):192–215.
51. Frank O, Strauss D:Markov graphs.Alexandria, VA, ETATS-UNIS: American Statistical Association; 1986.
52. Robins G, Pattison P, Kalish Y, Lusher D:An introduction to exponential random graph (p*) models for social networks.Soc Networks2007,29(2):173–191. 53. Strauss D, Ikeda M:Pseudolikelihood estimation for social networks.
J Am Stat Assoc1990,85(409):204–212.
54. Carley K:Center for Computational Analysis of Social and Organizational Systems (CASOS), Institute for Software Research International (ISRI).5000 Forbes Avenue Pittsburgh, PA 15213–3890: School of Computer Science, Carnegie Mellon University; 2010.
55. Baron RM, Kenny DA:The moderator-mediator variable distinction in social psychological research: conceptual, strategic, and statistical considerations.J Pers Soc Psychol1986,51(6):1173–1182.
56. Snijders TAB, Van de Bunt GG, Steglich CEG:Introduction to stochastic actor-based models for network dynamics.Soc Networks2010,32(1):44–60. 57. Ryu S, Ho S, Han I:Knowledge sharing behavior of physicians in
hospitals.Expert Syst Appl2003,25(1):113–122.
58. Burt R:Structural holes: The social structure of competition.Cambridge, Massachusetts: Harvard Univ Pr; 1992.
59. Field A:Discovering statistics using SPSS.London: Sage Publications Ltd; 2009.
doi:10.1186/1472-6963-13-234

![Figure 2 Configurations and parameters for exponential random graph models [50].](https://thumb-us.123doks.com/thumbv2/123dok_us/8294502.287426/7.595.60.540.517.714/figure-configurations-and-parameters-exponential-random-graph-models.webp)