R E S E A R C H A R T I C L E
Open Access
Validation of reference genes for gene expression
analysis in olive (
Olea europaea
) mesocarp tissue
by quantitative real-time RT-PCR
Debashree L Ray
1and Joshua C Johnson
1,2*Abstract
Background:Gene expression analysis using quantitative reverse transcription PCR (qRT-PCR) is a robust method wherein the expression levels of target genes are normalised using internal control genes, known as reference genes, to derive changes in gene expression levels. Although reference genes have recently been suggested for olive tissues, combined/independent analysis on different cultivars has not yet been tested. Therefore, an assessment of reference genes was required to validate the recent findings and select stably expressed genes across different olive cultivars.
Results:A total of eight candidate reference genes [glyceraldehyde 3-phosphate dehydrogenase (GAPDH),serine/ threonine-protein phosphatase catalytic subunit (PP2A),elongation factor 1 alpha (EF1-alpha),polyubiquitin (OUB2), aquaporin tonoplast intrinsic protein (TIP2),tubulin alpha (TUBA),60S ribosomal protein L18-3 (60S RBP L18-3) and polypyrimidine tract-binding protein homolog 3 (PTB)] were chosen based on their stability in olive tissues as well as in other plants. Expression stability was examined by qRT-PCR across 12 biological samples, representing mesocarp tissues at various developmental stages in three different olive cultivars, Barnea, Frantoio and Picual, independently and together during the 2009 season with two software programs, GeNorm and BestKeeper. Both software packages identifiedGAPDH,EF1-alphaandPP2Aas the three most stable reference genes across the three cultivars and in the cultivar, Barnea.GAPDH,EF1-alphaand60S RBP L18-3were found to be most stable reference genes in the cultivar Frantoio while60S RBP L18-3, OUB2andPP2Awere found to be most stable reference genes in the cultivar Picual. Conclusions:The analyses of expression stability of reference genes using qRT-PCR revealed thatGAPDH,EF1-alpha, PP2A, 60S RBP L18-3andOUB2are suitable reference genes for expression analysis in developingOlea europaeamesocarp tissues, displaying the highest level of expression stability across three different olive cultivars, Barnea, Frantoio and Picual, however the combination of the three most stable reference genes do vary amongst individual cultivars. This study will provide guidance to other researchers to select reference genes for normalization against target genes by qPCR across tissues obtained from the mesocarp region of the olive fruit in the cultivars, Barnea, Frantoio and Picual.
Keywords:Reference genes, qRT-PCR,Olea europaea, Gene expression
Background
Quantitative reverse transcription PCR (qRT-PCR) is a well-established procedure to study changes in gene ex-pression levels, due to its high sensitivity, reproducibility and large dynamic range [1-6]. In qRT-PCR experiments using a relative quantification approach, the expression
level of the target genes are normalised using internal con-trol genes known as reference genes to derive changes in gene expression levels. This normalisation strategy im-proves the fidelity of the quantification process by control-ling any variation in the expression level of the biological samples that might have been introduced due to various factors such as RNA integrity, initial sample amount, re-verse transcription efficiency etc. Some of the most com-mon and best known housekeeping genes involved in basic cellular and metabolic processes that have been used as candidate reference genes over the last few decades in * Correspondence:[email protected]
1College of Engineering & Science, Victoria University, PO Box 14428, Melbourne, VIC 8001, Australia
2Institute for Sustainability & Innovation, Victoria University, PO Box 14428, Melbourne, VIC 8001, Australia
plants and animals includeGAPDH,18Sor26S RNA, EF1-alpha,ubiquitin carrier protein, actin,α-tubulin,β-tubulin
andTATA-Box binding protein[3,5,7,8]. It is assumed that these reference genes have constant level of expression in different tissues and under different treatments and has no inter-individual variability [9,10]. Experimentally, it is im-possible to find a single, ideal reference gene for normalisa-tion in various samples, under different condinormalisa-tions as the transcription of any gene will not be absolutely resistant to fluctuations in the cell cycle or nutrition status [5,7]. It has been shown that in many experiments the use of a single reference is not acceptable as it would likely produce erroneous conclusions in expression patterns [11,12]. Recent reports have also shown that the most commonly used traditional reference genes may be inappropriate for normalization in qPCR experiments due to their expression variability under different experimental conditions [8,13]. The importance of expression stability in the choice of ref-erence genes has prompted the development of various software packages including GeNorm [4], BestKeeper [14] and NormFinder [15] to identify such genes. Therefore, for accurate analysis of RNA transcription it is crucial to choose reference genes that have been shown to be minim-ally regulated in a given species, in a given organs/tissues, at a given developmental period and under specific envir-onmental conditions.
In plants a number of reference gene validation re-ports have been published covering both model and
agriculturally important crop species including,
Arabi-dopsis [8], rice [16], wheat [5] grapevine [3], barley [7],
soybean [9] and cotton [10]. In Arabidopsis thaliana,
analysis of the Affymetrix ATH1 microarray data has re-vealed that there are hundreds of potential reference genes that outperform traditional reference genes in terms of expression stability, where most of these genes are expressed at much lower levels than the traditional reference genes. This list of new Arabidopsis reference genes were successfully employed to search for reference genes in unrelated species such asVitis vinifera[17] and
Coffea arabica[18].
The olive tree (Olea europaea) represents one of the oldest agricultural tree crops with cultivation of olives be-ginning in the Mediterranean basin more than 3000 years ago [19]. Over the past few decades an increased aware-ness of the reported health benefits of olive oil over other fats and oils [20-24] has seen olive oil consumption in-crease globally [19,25] and cultivation of olives has spread globally into new areas such as Australia, North America and South America [19]. In the past few years high throughput next generation sequencing (NGS) technolo-gies have been used to study the transcriptome of olive drupes during different developmental stages and tissues [26-28]. These sequencing data are a valuable resource for gene discovery and characterisation in olives. However, in
order to normalise the expression data of genes in olives it is important to identify stable reference genes which show consistent expression within olive samples for a specific set of chosen experimental conditions and tis-sue types in olives.
In olives, an analysis of cDNAs that are associated with alternate bearing in olive was conducted wherein
seven commonly used reference genes [Olest34,
alpha-tubulin, beta-tubulin, beta-actin, 26S rRNA, 18S rRNA
andGAPDH] were chosen to identify the reference gene which is least spatially and temporally variable [28].
GAPDHwas decided to be used as an appropriate refer-ence gene for the major tissues (leaves, fruits and pedi-cels) of olive to normalise the copy numbers of the cDNAs tested [28]. Although the authors did provide data to justify this selection there was not an in-depth analysis of potential reference gene candidates.
More recently, two studies were conducted to identify stable reference genes in olives during fruit development and ripening. Noniset al.[29] focused on the stability of 13 putative reference genes evaluated on 21 samples col-lected over different developmental stages of olive fruits and leaves subjected to wounding from the cultivar Fran-toio during the 2009 season. Thirteen candidate reference genes belonging to 8 gene families were chosen based on their stability in other plants as well as the availabilty of pu-tative ESTs for these genes in a publicly available database of olive ESTs [26]. Results showed that serine/threonine-protein phosphatase catalytic subunit-1 (PP2A1) was the most transcriptionally stable reference gene, followed by
GAPDH2, while GAPDH1 showed the widest variation and was considered the least stable gene. Another study was conducted on the validation analysis of 29 reference genes at 12 different sampling points of olive fruit develop-ment from the cultivar, Istrska belica using two evaluation approaches, GeNorm and RefFinder programs [30]. Com-bining both the programs together, TIP41-like family pro-tein (TIP41) and TATA binding protein (TBP) were identified as the two most stable reference genes during fruit development in this cultivar.
Thus, the current study involved the use of two software packages, GeNorm (qBase Plus) and BestKeeper, to validate the expression stability of eight candidate reference genes chosen based on their stability in olive tissues as well as in other plants, during mesocarp development across three different olive cultivars Barnea, Frantoio and Picual inde-pendently and together during the 2009 season by qPCR.
Results
Assessment of RNA integrity and verification of PCR products Agarose gel electrophoresis images of total RNA extracted from all olive samples revealed two distinct bands represent-ing 18S- and 28S- RNA bands (data not shown) and the RNA integrity number (RIN) values for all samples ranged from 8.3-9.9 (data not shown). Amplification of the eight candidate reference genes by PCR revealed products of the expected sizes (Additional file 1) and subsequent se-quencing of these products revealed that all amplified fragments were identical to sequences used for de-signing primers for the reference genes (Table 1) (se-quencing data not shown).
Determination of PCR amplification efficiency and melting curve analysis
The amplification efficiencies (E) for the eight candidate reference genes ranged between 1.513-2.243, standard
errors (SD) between 0.005-0.081 and the R2 value
be-tween 85.5-99.6% (Table 1) (Additional file 2). Amplifi-cation of all reference genes revealed the presence of a single peak in the melt curve analysis except TIP2 which showed the presence of two peaks, a large peak at 83°C and a smaller peak at a lower temperature (~78.5°C) (Additional file 3). No signal was detected in the nega-tive controls for all eight reference genes.
Expression levels of candidate reference genes
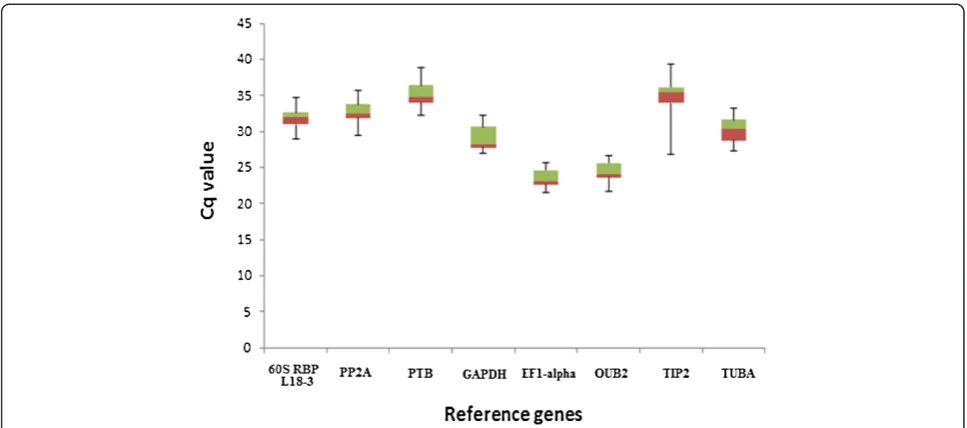
The eight reference genes displayed a wide expression range with quantification cycle (Cq) values ranging from 21 to 39 (Figure 1) (Additional file 4). Highly expressed genes with Cq values between 21-25 cycles wereEF1-alpha
andOUB2. Genes with intermediate expression levels with
Cq values ranging from 28-32 cycles wereGAPDH,PP2A,
60S RBP L18-3 and TUBA. Genes with lower expression levels with Cq values >34 cycles werePTBandTIP2.
Stability assessment of reference genes
[image:3.595.59.540.443.699.2]The ranking of the eight candidate reference genes ac-cording to their expression stability across the three olive cultivars Barnea, Frantoio and Picual together and as independent cultivars as calculated by the geNorm are shown in Table 2.
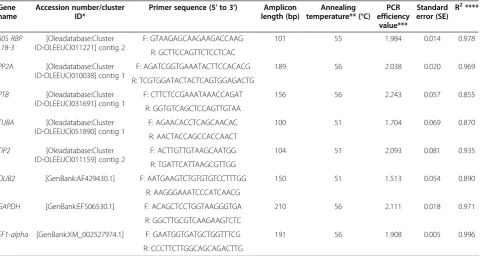
Table 1 Eight candidate reference genes assessed for gene expression normalisation inOlea europaeaand amplicon characteristics
Gene name
Accession number/cluster ID*
Primer sequence (5' to 3') Amplicon length (bp)
Annealing temperature** (°C)
PCR efficiency
value***
Standard error (SE)
R2****
60S RBP L18-3
[Oleadatabase:Cluster ID-OLEEUCl011221] contig 2
F: GTAAGAGCAAGAAGACCAAG 101 55 1.984 0.014 0.978
R: GCTTCCAGTTCTCCTCAC
PP2A [Oleadatabase:Cluster ID-OLEEUCl010038] contig 1
F: AGATCGGTGAAATACTTCCACACG 189 56 2.038 0.020 0.969
R: TCGTGGATACTACTCAGTGGAGACTG
PTB [Oleadatabase:Cluster ID-OLEEUCl031691] contig 1
F: CTTCTCCGAAATAAACCAGAT 156 56 2.243 0.057 0.855
R: GGTGTCAGCTCCAGTTGTAA
TUBA [Oleadatabase:Cluster ID-OLEEUCl051890] contig 1
F: AGAACACCTCAGCAACAC 100 51 1.704 0.069 0.870
R: AACTACCAGCCACCAACT
TIP2 [Oleadatabase:Cluster ID-OLEEUCl011159] contig 2
F: ACTTGTTGTAAGCAATGG 104 51 2.093 0.081 0.935
R: TGATTCATTAAGCGTTGG
OUB2 [GenBank:AF429430.1] F: AATGAAGTCTGTGTGTCCTTTGG 150 51 1.513 0.054 0.890
R: AAGGGAAATCCCATCAACG
GAPDH [GenBank:EF506530.1] F: ACAGCTCCTGGTAAGGGTGA 210 56 2.111 0.018 0.971
R: GGCTTGCGTCAAGAAGTCTC
EF1-alpha [GenBank:XM_002527974.1] F: GAATGGTGATGCTGGTTTCG 191 56 1.908 0.005 0.996
R: CCCTTCTTGGCAGCAGACTTG
*Cluster ID obtained from theOleadatabase [26]. **Annealing temperature used in PCR experiments.
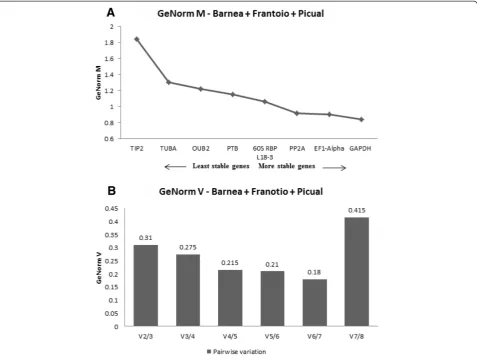
The combined analysis across the three cultivars showed that the expression stability (M) of the eight reference genes studied varied dramatically with values
ranging from 1.85 to 0.85 (Figure 2A). TIP2 was the
least stable gene with an M value of 1.85, whereas
GAPDHwas identified as the most stable gene, with an M value of 0.85 (Figure 2A). In addition to this,
pair-wise variation Vn/Vn+1 between two sequential
nor-malisation factors NFn and NFn+1 was also calculated
to determine the optimal number of reference genes to be used for normalisation. According to GeNorm V, V6/7 showed the lowest pairwise variation of 0.18 (Figure 2B) indicating that six reference genes with the lowest M values were the optimal number of reference genes which should be used for the most accurate normalisation.
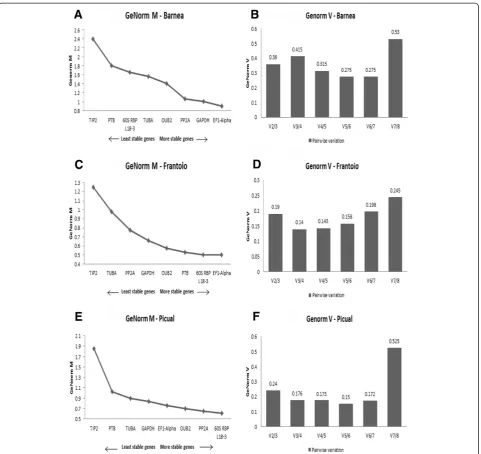
GeNorm was further used to evaluate the expression stability of the eight reference genes in each cultivar in-dependently. In Barnea, the M values ranged from 0.9 to
2.4 where, TIP2 was the least stable gene with an M
value of 2.4, whereas EF1-alpha was identified as the
most stable gene, with an M value of 0.9 (Figure 3A). According to GeNorm V, V5/6 showed the lowest pair-wise variation of 0.275 (Figure 3B). In Frantoio, the M values ranged from 0.5 to 1.25 where,TIP2was the least
stable gene with an M value of 1.25, whereasEF1-alpha
was identified as the most stable gene, with an M value of 0.5 (Figure 3C). According to GeNorm V, V3/4 showed the lowest pairwise variation of 0.14 (Figure 3D). In Picual, the M values ranged from 0.61 to 1.85 where,
TIP2was the least stable gene with an M value of 1.85,
[image:4.595.56.540.88.302.2]whereas60S RBP L18-3was identified as the most stable
Figure 1Expression levels of eight candidate reference genes.The values are given as real-time PCR quantification cycle (Cq) values for individual reference genes in a total of 12 samples (in duplicate) from the individual timepoints in the 2009 (96, 109, 116 and 136 DAF) crop season from cultivars Barnea, Frantoio and Picual. The boxes represent the 25thand 75thpercentiles and the line within the boxes represents the median. The whiskers indicate the range of Cq values of the data of the 24 samples per reference gene.
Table 2 Ranking of the eight candidate reference genes according to their expression stability in two different algorithms GeNorm and BestKeeper in Barnea, Frantoio and Picual individually and together
Barnea + Frantoio + Picual Barnea Frantoio Picual
Ranking GeNorm BestKeeper GeNorm BestKeeper GeNorm BestKeeper GeNorm BestKeeper
1 GAPDH PP2A EF1-Alpha PP2A EF1-Alpha GAPDH 60S RBP L18-3 60S RBP L18-3
2 EF1-Alpha EF1-Alpha GAPDH EF1-Alpha 60S RBP L18-3 EF1-Alpha PP2A OUB2
3 PP2A GAPDH PP2A GAPDH PTB OUB2 OUB2 PP2A
4 60S RBP L18-3 PTB OUB2 OUB2 OUB2 60S RBP L18-3 EF1-Alpha EF1-Alpha
5 PTB 60S RBP L18-3 TUBA 60S RBP L18-3 GAPDH PTB GAPDH GAPDH
6 OUB2 TIP2 60S RBP L18-3 PTB PP2A PP2A TUBA PTB
7 TUBA OUB2 PTB TIP2 TUBA TUBA PTB TIP2
[image:4.595.62.539.595.733.2]gene, with an M value of 0.61 (Figure 3E). According to GeNorm V, V5/6 showed the lowest pairwise variation of 0.15 (Figure 3F).
BestKeeper was also used to calculate and compare the gene expression variation for the eight candidate reference genes based on the geometric mean of their Cq values and displayed as the standard deviation (SD) and coefficient of variance (CV) (Table 3). The variation in gene expression
of two reference genesTIP2 andTUBAwas greater than
two-fold (SD greater than 1) in all three varieties individu-ally and together.OUB2also had SD greater than 1 in the combined analysis of the three cultivars. The other refer-ence genes had SD≤1 and thus are considered to be sta-bly expressed (p≤0.05). The ranking of these reference genes was based on their pairwise correlation with the BestKeeper index value which is indicated by the Pearson correlation coefficient (r). In the combined analysis of the
three cultivars (Tables 2 and 3A), BestKeeper
recom-mendedPP2Aas the most stable gene with a correlation
coefficient of 0.805. The comparison of the five other can-didate reference genes with this r value resulted in a ranking as follows, from the least stable to the most stable: 60S RBP L18-3> PTB>GAPDH>EFI-alpha>
PP2A. In Barnea, PP2A was identified as the most
stable gene with a correlation coefficient of 0.886
which was followed byEF1-alpha, GAPDH, OUB2, 60S
RBP L18-3 and PTB (Tables 2 and 3B). In Frantoio,
GAPDH was identified as the most stable gene with a correlation coefficient of 0.835 which was followed by
EF1-alpha, OUB2, 60S RBP L18-3, PTBandPP2A (Ta-bles 2 and 3C).In Picual,60S RBP L18-3was identified as the most stable gene with a correlation coefficient of
0.969 which was followed by OUB2, PP2A, EF1-alpha,
[image:5.595.60.538.89.448.2]GAPDHandPTB(Tables 2 and 3D).
Discussion
This is one of the first reports conducted to assess the expression stability of candidate reference genes at dif-ferent developmental stages of the olive mesocarp and the first to assess the stability of these genes across dif-ferent cultivars. For an accurate comparison of mRNA levels in different samples, it is crucial to normalize the expression of target genes against appropriate reference genes. An ideal reference gene should be expressed at constant level in all types of cells, at any time in cell
[image:6.595.59.541.87.541.2]given species and organs/tissues under specific experi-mental conditions [8,13]. Normalization with multiple reference genes has become a gold standard in qPCR expression analysis [3,9,10] and also a requisite accord-ing to MIQE (Minimum Information for Publication of Quantitative Real-Time PCR Experiments) guidelines [2]. To this end, a number of software packages have been de-veloped to assess the stability of candidate reference genes in different biological experimental settings, including, GeNorm, BestKeeper and NormFinder. However, the valid-ation of reference genes is not very common in plant research [10,16,18].
Recently two studies were conducted to identify stable reference genes in olives during fruit development and
ripening [29,30]. Although stable reference genes were suggested for the olive fruit developmental stages, a few
reference genes, such as EF1-alpha, GAPDH, 14-3-3
[image:7.595.60.540.114.513.2]protein performed differently in these two experiments during the olive fruit development with differences in their M-values and ranking order. These differences clearly show that the stability of the reference genes must be validated with each experimental setup. As two different cultivars were used in these two studies it is possible that differences in cultivars might explain these differences in gene expression between the reference genes indicating that even for different cultivars the stability of the reference genes should be assessed. Therefore, in this study a combination of three different
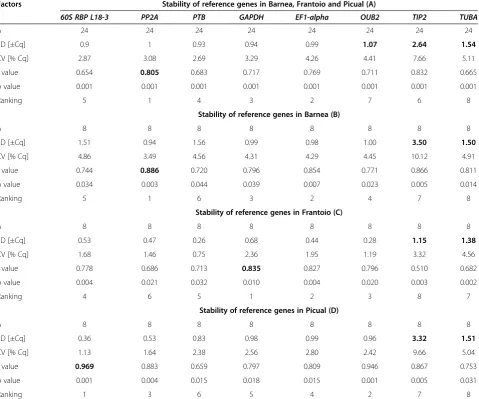
Table 3 BestKeeper descriptive statistical analyses of eight reference genes in Barnea, Frantoio and Picual mesocarp together (A) and individually (B, C and D)
Factors Stability of reference genes in Barnea, Frantoio and Picual (A)
60S RBP L18-3 PP2A PTB GAPDH EF1-alpha OUB2 TIP2 TUBA
n 24 24 24 24 24 24 24 24
SD [±Cq] 0.9 1 0.93 0.94 0.99 1.07 2.64 1.54
CV [% Cq] 2.87 3.08 2.69 3.29 4.26 4.41 7.66 5.11
r value 0.654 0.805 0.683 0.717 0.769 0.711 0.832 0.665
p value 0.001 0.001 0.001 0.001 0.001 0.001 0.001 0.001
Ranking 5 1 4 3 2 7 6 8
Stability of reference genes in Barnea (B)
n 8 8 8 8 8 8 8 8
SD [±Cq] 1.51 0.94 1.56 0.99 0.98 1.00 3.50 1.50
CV [% Cq] 4.86 3.49 4.56 4.31 4.29 4.45 10.12 4.91
r value 0.744 0.886 0.720 0.796 0.854 0.771 0.866 0.811
p value 0.034 0.003 0.044 0.039 0.007 0.023 0.005 0.014
Ranking 5 1 6 3 2 4 7 8
Stability of reference genes in Frantoio (C)
n 8 8 8 8 8 8 8 8
SD [±Cq] 0.53 0.47 0.26 0.68 0.44 0.28 1.15 1.38
CV [% Cq] 1.68 1.46 0.75 2.36 1.95 1.19 3.32 4.56
r value 0.778 0.686 0.713 0.835 0.827 0.796 0.510 0.682
p value 0.004 0.021 0.032 0.010 0.004 0.020 0.003 0.002
Ranking 4 6 5 1 2 3 8 7
Stability of reference genes in Picual (D)
n 8 8 8 8 8 8 8 8
SD [±Cq] 0.36 0.53 0.83 0.98 0.99 0.96 3.32 1.51
CV [% Cq] 1.13 1.64 2.38 2.56 2.80 2.42 9.66 5.04
r value 0.969 0.883 0.659 0.797 0.809 0.946 0.867 0.753
p value 0.001 0.004 0.015 0.018 0.015 0.001 0.005 0.031
Ranking 1 3 6 5 4 2 7 8
olive cultivars Barnea, Frantoio and Picual were assessed both individually and together to evaluate the expression stability of eight candidate reference genes during olive mesocarp development.
The primers that were designed for the eight reference genes amplified single PCR products of the expected size from the olive cDNA pools as shown by gel electrophoresis (Additional file 1) and melt-curve analysis (Additional file 3) suggested that single products were amplified and that only TIP2 showed the formation of some primer-dimers. This specificity was confirmed by sequencing all eight PCR products which confirmed their identity to sequences used for designing primers for the reference genes.
Previous research has shown that analysis of expression stability of reference genes using different combinations of GeNorm, BestKeeper and NormFinder can result in minor to substantial discrepancies in the final ranking of the suit-able reference genes which is typically explained by the dif-ferences in the mathematical models associated with each program [3,17]. In this study the results obtained by the two algorithms did not show much discrepancy and both the programs were compared for the final choice of suitable ref-erence genes. The ranking of the eight candidate refref-erence genes based on their stability (M) and correlation coefficient values as calculated using GeNorm (qBase Plus) and Best-Keeper algorithms respectively across the three cultivars to-gether and as individual cultivars are shown in Tables 2 and 3. According to GeNorm analysis in the three cultivars to-gether, the two traditional reference genesGAPDHand EF1-alpha were the most stable with lowest M-values, followed
by the reference genePP2A,60S RBP L18-3andPTBwere
placed in the middle of the ranking, whileOUB2,TUBAand
TIP2displayed inappropriate expression stability with higher M-values and thus appear to be regulated in these tissues.
According to BestKeeper analysis of the three cultivars
together, PP2A was ranked as the most suitable
refer-ence gene with the highest correlation coefficient of
0.805, followed byEF1-alphaandGAPDH. PTBand60S
RBP were placed in the middle of the ranking, while
OUB2, TUBA and TIP2 showed SD ≥1 and thus were
considered inconsistent. Although TIP2 has the highest
correlation coefficient of 0.832, it cannot be used for nor-malisation because of its unacceptable SD value (SD > 1).
Thus,GAPDH, EF1-alphaand PP2Awere determined
to be the three most stable reference genes analysed across the three cultivars when analysed together, albeit with slightly different rankings using the different analyt-ical approaches. Many studies with similar findings, wherein different software packages identify the same reference genes as the most stable genes but not in the exact same ranking order have been reported in both an-imals and plants [31,32].
These findings are in broad agreement with the Nonis
et al. [29] data which showed that PP2A1 was the most
transcriptionally stable reference gene during olive fruit
development, followed by GAPDH2, while GAPDH1
showed the widest variation and was considered the
least stable gene. BLASTx of theGAPDHcontig [GenBank:
EF506530.1] used in this study showed that it is 97%
identical to Glycine max GAPDH Subunit A [GenBank:
NP_001238484.1]. BLASTx of the two different GAPDH
transcripts used by Nonis et al [29] showed that
[OLEEUCl022518|Contig2] and
[OLEEUCl004899|Con-tig2] are 89-90% identical to Glycine max GAPDH
Subunit C [GenBank: NP_001237544.1]. The PP2A contig [OLEEUCl010038 contig1] used in this study is 98%
iden-tical toGlycine maxPP2A-2 [GenBank: XP_003532043.1].
BLASTx of the two different PP2A transcripts used by
Nonis et al[29] showed that [OLEEUCl021775|Contig2]
is 92% identical to Glycine max PP2A-3 [GenBank:
XP_003533904.1] and [OLEEUCl021848|Contig 2] is
97% identical to Glycine max PP2A-1 [GenBank: XP_
003534171.1]. BothPP2Atranscripts used by Nonis et
al[29] performed well in that study [29]. These studies
clearly suggests that the PP2A gene family is stably
expressed in olive fruit developmental stages. In
addition, PP2A was also identified as a suitable
refer-ence gene in cotton across different plant organs [10] as well as inArabidopsis[8].GAPDH, a traditional ref-erence gene, was considered the most suitable refer-ence gene in coffee leaves under drought-stress and in different cultivars [18], however performed poorly across tissues and organs of tomato at different
devel-opmental stages [33].EF1-alphawas found to be stably
expressed in olive fruit developmental stages in two different studies, however with differences in M-values and ranking orders [29,30]. Under conditions of biotic
and abiotic stress,EF1-alphawas found to be very
sta-bly expressed in potato [34], whileEF1-betawas found
to be the most stable in soybean [35]. EF1-alpha was
also found to be stable in expression across different tissues of rice [16].
PTBand60S RBP L18-3were placed in the middle of the ranking order across the three cultivars as a whole by both software packages, again differing in their order (Table 2).
PTBwas identified as one of the most stable reference gene in cotton during fruit development [10].60S RBPwas iden-tified as one of the suitable reference genes to normalize gene expression data in two different grapevine organs (leaves and berries) [3]. Reseticet al [30] also placed 60S RBP in the middle of the ranking order for assessing the average expression stability during olive fruit development.
Both GeNorm and BestKeeper ranked OUB2, TUBA
and TIP2 as poor performers as reference genes across
the three cultivars as a whole. Nonis et al [29] has
rankedOUB2in the middle of the ranking order with an
M value of 0.48 whileUBQ10displayed a higher M value
was identified as one of the most stable reference gene
across different plant organs in cotton [10]. UBQ10
ex-hibits very stable expression inArabidopsis [8] however performed poorly as a reference in soybean [9] and in grapevine [17].TUBAdisplayed a higher M value of 0.80
in olive fruit tissues by Resetic et al [30]. TUBA was
identified as being very stably expressed across develop-ment in soybean while was highly unstable across tissues and organs of tomato at different developmental stages
[33]. It is interesting to note that though TIP41 was
chosen as one of the best reference genes in olive fruit tissues in the cultivar Istrska belica [30], this reference
gene performed poorly in the present study. WhileTIP2
outperformed several traditional reference genes in Ara-bidopsisacross different tissues, organs and developmen-tal stages [8], it performed poorly in grapevine. This analysis clearly suggested that reference genes are regu-lated differently in different plant species and/or cultivar [10] and also highlights the importance of validating pu-tative reference genes in different species/tissues/culti-var/conditions.
GeNorm and BestKeeper was further used to evaluate the expression stability of the eight reference genes in each culti-var independently. It was interesting to note that the M values varied dramatically across the cultivars where M values in Barnea samples ranged from 0.9-2.4 while in Fran-toio and Picual samples they ranged between 0.5-1.85. In
Barnea,GAPDH,EF1-alphaandPP2Awere determined to
be the three most stable reference genes which is consistent with the analysis performed across the three cultivars to-gether. In Frantoio, slight variations between the two algo-rithms were observed. Combining data from both the
algorithms GAPDH, EF1-alpha and 60S RBP L18-3 were
the top three stable reference genes identified in Frantoio
while 60S RBP L18-3, OUB2and PP2Awere identified as
the top three stable reference genes in Picual. All three culti-vars rankedTIP2as the least stable gene. Thus it is observed that though few best/worst performing reference genes are common amongst cultivars, their ranking orders do vary and the top ranking genes should be used for their respect-ive cultivars for accurate normalization. This analysis further validated our earlier statement that reference genes may show slightly different expression stability across cultivars.
GeNorm also provides a measure for the optimal num-ber of stable controls that should be used for normalization based on pairwise variation analysis between subsequent normalisation factors. According to GeNorm V, a combin-ation of six most stable reference genes was calculated as being optimal for gene expression studies across the three cultivars when analysed together with the lowest pairwise variation value of 0.18 (Figure 2B). In Barnea, Frantoio and Picual, individually, the lowest pairwise variations were for V5/6, V3/4 and V5/6, respectively (Figure 3B, D, F). Ac-cording to Vandesompele [11] the optimal cut-off V
number should be around 0.15, however many other stud-ies using this application have resulted in higher pairwise variations [7,36-38]. The GeNorm threshold is not a strict cut-off value but it’s an ideal value to provide guidance to researchers to determine the optimal number of reference genes and that the observed trend of changing pairwise variation values is equally informative [9,39]. Depending on the aim of the study, the optimal number of stable controls that should be used for normalization against the target genes should be decided. In case of a comparatively small study, it is impractical to use excessive numbers of refer-ence genes for normalization and thus the minimal use of three most stable reference genes is recommended for cal-culating the normalization factors [11,31,40]. Therefore
GAPDH, EF1-alphaandPP2Awere recommended as the three most stable reference genes for normalization against the target genes across the three cultivars together and in
the cultivar Barnea. In Frantoio, GAPDH, EF1-alpha and
60S RBP L18-3 were recommended as the three most
stable reference genes while in Picual, 60S RBP L18-3,
OUB2 and PP2A were recommended as the three most
stable reference genes.
Conclusions
In this study we have investigated the expression of eight candidate reference genes at different developmental stages of the olive fruit across three different olive culti-vars independently and together, in an attempt to iden-tify most suitable reference genes for normalizing gene
expression across cultivars. GAPDH, EF1-alpha and
PP2Awere found to be the most stable reference genes
in olive mesocarp tissues across the cultivars and in the
cultivar, Barnea. GAPDH, EF1-alpha and 60S RBP
L18-3were found to be most stable reference genes in the
cultivar Frantoio while60S RBP L18-3, OUB2 andPP2A
were found to be most stable reference genes in the cul-tivar Picual. In summary, this is one of the first reports on the evaluation of candidate reference genes across
three different O. europaea cultivars and will provide
guidance to other researchers to select reference genes for normalization against target genes by qPCR in this species.
Methods
Plant materials
Total RNA isolation and cDNA synthesis
Total RNA was extracted from the mesocarp of olive fruit tissues harvested at four individual timepoints from olive cultivars Barnea, Frantoio and Picual using the RNeasy plant mini kit (Qiagen) according to the supplied protocol. On-column DNase digestion was performed using the RNase-free-DNase set (Qiagen).
DNase treated RNA was eluted in RNase free ddH2O
and stored at -80°C until required. The integrity of all RNA samples were assessed by gel electrophoresis and the quality of the RNA samples were judged by their RNA integrity number (RIN) calculated by the Agilent 2100 Bioanalyzer [41]. In this study only RNA samples
with RIN values≥8 were used for subsequent analysis.
For all samples, cDNA was synthesized from 100 ng of
total RNA in 20 μL reaction volumes using
Thermo-script RT-PCR system (Invitrogen) with oligo-dT pri-mer (50μM) according to the manufacturer’s protocol. The cDNA samples were diluted 5-fold and a final
vol-ume of 10 μL cDNA was used for all real time PCR
reactions.
Selection of candidate reference genes and primer design A total of eight reference genes were chosen based on their stability in olive tissues as well as in other plants from a publicly available database of olive ESTs [26], where consensus sequences derived from atleast 10 ESTs were chosen for designing primers for the amplification of each of the selected reference genes (Table 1).
Amongst the eight candidate reference genes, two
ref-erence genes, GAPDH and PP2A which performed the
best in the Nonis et al [29] study were included in this study, although different sequences/contigs were chosen (Table 1). Further, five reference genes common to both
the studies were also chosen, namely EF1-alpha, TIP2,
60S RBP L18-3, TUBAandOUB2. Another novel
refer-ence gene, PTB identified in the Arabidopsis thaliana
Affymetrix ATH1 microarray data [8] was also in-cluded in the analysis. Primers used for qPCR were
de-signed with Beacon Designer™ software (http://www.
premierbiosoft.com) (Table 1).
Amplification and sequencing of the reference genes All genes were amplified from the pooled cDNA and
were carried out in total volumes of 50 μL, containing
50 ng template cDNA, 1X PCR Buffer, 0.2 mM dNTPs, 1.5 mM MgCl2, 0.5μM each primer (forward and reverse)
and 2U PlatinumTaq polymerase. The cycling conditions
for the amplification of PCR products involved an initial denaturation of 95°C/5 minutes, followed by 35 cycles of 95°C/30s, primer-specific annealing temperature/30s (Table 1) and 72°C/1 minute. The PCR products were visually assessed on 1% agarose gels by electrophoresis and the products were sequenced directly using the ABI
Prism BigDye Terminator V3.1 Cycle Sequencing Kit (Applied Biosystems) in a final volume of 20μL accord-ing to a modified version of the standard protocol,
con-taining 1 μL BigDye Premix, 3.5 μL 5X reaction buffer
[250 mM Tris HCl (pH 9.0), 10 mM MgCl2], 1 μL of
forward or reverse primer (3-5 pM) and PCR products (~10 ng). The analysis of the sequencing results was conducted using the BioEdit software package 7.0.9, [http://www.mbio.ncsu.edu/bioedit/bioedit.html] [42] and the identity of the amplified PCR products was confirmed by BLASTn analysis against the non-redundant (nr) GenBank database to confirm the PCR specificity of the primer pairs.
Preparation of standards and experimental setup of qPCR Standards for qPCR were used to generate calibration curves to calculate the PCR efficiency of each primer set. For preparation of the standards, cDNA stocks synthe-sized from each RNA sample were pooled and aliquoted in single-use tubes. Five series of four-fold dilutions were prepared using the undiluted cDNA pool [1:1 (STD1), 1:4 (STD4), 1:16 (STD16), 1:64 (STD64), 1:256 (STD256)]. These dilution series were diluted further in a 1:5 dilution with sterile ddH2O and a final volume of 10μL cDNA was
used in each real time PCR reaction. To ensure methodo-logical reproducibility, a total of 12 samples harvested at four individual timepoints from olive cultivars Barnea, Frantoio and Picual were measured in duplicate in a single run, for each gene, where all duplicates were derived from independent RNA extractions and cDNA synthesis reac-tions. Details of all samples used in the qPCR study are in Additional file 5.
qRT-PCR methodology
All reactions were performed in 20μL volumes
contain-ing 2 μL of primer mix (5 μM of each forward and
re-verse primer) (Table 1), 10 μL of 5-fold diluted cDNA
(10 ng) and 4 μL SYBR Green I Master mix reagent
(Roche) with the LightCycler Carousel-Based system (Roche). The reactions were subjected to an initial de-naturation of 72°C/10 minutes, followed by 45 cycles of 95°C/10 seconds, primer-specific annealing/0-10seconds (Table 1) and 72°C/amplicon size (bp)/25 seconds. A melt-ing curve analysis was performed at the end of PCR with a ramp rate of 0.1°C/second. The expression stabilities of the tested genes were validated with two software pro-grams, GeNorm module in qBase Plus software version 2.4 (Biogazelle) and BestKeeper [14].
GeNorm
genes [4] to derive fold change gene expression. The average expression stability of the reference genes were analysed using the GeNorm module integrated in qBase-Plus. GeNorm is a statistical algorithm which relies on the principle that two ideal reference genes will be equally expressed in all samples irrespective of any ex-perimental condition or tissue type and are minimally regulated [3,7,31]. GeNorm M determines expression stability measure (M value) of all the reference genes under investigation based on the geometric averaging of multiple reference genes and mean pairwise variation of a gene from all other reference genes in a set of samples. Lower M values reflect greater stability of the reference genes. GeNorm M ranks the candidate genes from the most unstable gene to a single most stable gene.
GeNorm V calculates the normalisation factor (NFn) by
calculating the geometric mean of the expression levels of the stable most reference genes by step-wise inclusion of a less stable gene [8,31]. The program calculates the pairwise variation Vn/Vn+1 between two sequential
nor-malisation factors, NFn and NFn+1. A large variation
indicates that the added gene has significant contribu-tion to the normalisacontribu-tion and thus should be included for calculation. If the variation is low (Vn/Vn+1< 0.15)
this suggests that the added reference gene is not re-quired for calculation of the normalisation factor and thus can be excluded.
BestKeeper analysis
The stability of the eight reference genes was also evaluated using the Excel based tool Bestkeeper [14]. BestKeeper ranks the stability of candidate reference genes by performing a statistical analysis of the Cq values based on three variables: Pearson correlation coefficient (r), standard deviation (SD) and percentage covariance (CV). It performs numerous pair-wise correlation analysis of all pairs of candidate refer-ence genes by combining all highly correlated (and puta-tively stably expressed) reference genes into an index value (BestKeeper index) by calculating the geometric mean. If the reference genes are stably expressed, their expression levels will be highly correlated [14]. The correlation between each candidate reference gene and the index is calculated to de-termine the relationship between the index and the contrib-uting reference genes by Pearson correlation coefficient (r), coefficient of determination (r2) and the probability p values.
Additional files
Additional file 1:Agarose gel electrophoresis of PCR products of eight reference genes.Lanes: M: 100bp molecular weight marker; Lane1: glyceraldehyde 3-phosphate dehydrogenase, Lane2: 60S ribosomal protein L18-3, Lane 3: serine/threonine protein phosphatase 2A, Lane 4: polypyrimidine tract-binding protein, Lane5: tubulin alpha, Lane6: aqua-porin tonoplast intrinsic protein, Lane 7: polyubiquitin, Lane8: elongation factor 1 alpha, Lane 9: water-only negative control.
Additional file 2:Representative efficiency curves for individual reference genes. Mean Cq values were plotted against the five four-fold cDNA serial dilutions (1:1, 1:4, 1:16, 1:64, 1:256) using the qBase Plus software.Slope obtained for each plot has been shown top right.
Additional file 3:Melting curve peak of eight candidate reference genes.Fluorescence values were plotted against temperature (˚C) using the Light cycler Carousel (Roche).
Additional file 4:The transcription profiles of individual reference genes given as Cq values across all samples in Barnea, Frantoio and Picual.Average Cq values with the standard deviation (SD) for all samples shown. Repli: Replicate. Annotation for each sample with their name of olive cultivar, timepoint and year has been given in Additional file 5.
Additional file 5:Annotations for all olive cDNA samples, standards and negative controls used in the qPCR study.A. Annotations for olive cDNA samples. B. Annotations for standards and negative controls.
Abbreviations
cDNA:Complementary DNA; CV: Coefficient of variance; DAF: Days after flowering; RT-qPCR: Quantitative real-time reverse transcriptase polymerase chain reaction; SE: Standard error; SD: Standard deviation; 60S RBP L18-3: 60S ribosomal protein L18; PP2A: Serine/threonine protein phosphatase 2A; PTB: Polypyrimidine tract-binding protein; TUBA: Tubulin alpha; TIP2: Aquaporin tonoplast intrinsic protein; OUB2: Polyubiquitin; GAPDH: Glyceraldehyde 3-phosphate dehydrogenase; EF1-α: Elongation factor 1 alpha.
Competing interests
The authors declare that they have no competing interests.
Authors’contributions
DLR and JCJ designed the project. DLR performed the experimental procedures, data analysis and drafted the manuscript. JCJ supervised the study and critically revised the manuscript. Both authors read and approved the final manuscript.
Acknowledgement
This research was supported by a scholarship from Modern Olives and the College of Engineering and Science at Victoria University to DLR. Special thanks to L. Ravetti and C. Guillaume at Modern Olives for providing the olive material.
Received: 10 February 2014 Accepted: 12 May 2014 Published: 18 May 2014
References
1. Ponchel F, Toomes C, Bransfield K, Leong FT, Douglas SH, Field SL, Bell SM, Combaret V, Puisieux A, Mighell AJ, Robinson PA, Inglehearn CF, Isaacs JD, Markham AF:Real-time PCR based on SYBR-Green I fluorescence: An alternative to the TaqMan assay for a relative quantification of gene rearrangements, gene amplifications and micro gene deletions.
BMC Biotechnol2003,3:18.
2. Bustin SA, Benes V, Garson JA, Hellemans J, Huggett J, Kubista M, Mueller R, Nolan T, Pfaffl MW, Shipley GL, Vandesompele J, Wittwer CT:The MIQE guidelines: minimum information for publication of quantitative real-time PCR experiments.Clin Chem2009,55(4):611–622.
3. Gamm M, Héloir M-C, Kelloniemi J, Poinssot B, Wendehenne D, Adrian M: Identification of reference genes suitable for qRT-PCR in grapevine and application for the study of the expression of genes involved in pteros-tilbene synthesis.Mol Genet Genomics2011,285(4):273–285.
4. Hellemans J, Mortier G, Paepe AD, Speleman F, Vandesompele J:qBase relative quantification framework and software for management and automated analysis of real-time quantitative PCR data.Genome Biol2007, 8:R19.
6. Huggett J, Bustin SA:Standardisation and reporting for nucleic acid quantification, Accreditation and Quality Assurance - SpringerLink. ; 2011. 7. Jarošová J, Kundu JK:Validation of reference genes as internal control for
studying viral infections in cereals by quantitative real-time RT-PCR.BMC Plant Biol2010,10:146.
8. Czechowski T, Stitt M, Altmann T, Udvardi MK, Scheible W-R:Genome-wide identification and testing of superior reference genes for transcript normalization in Arabidopsis.Am Soc Plant Biol2005,139(1):5–17. 9. Hu R, Fan C, Li H, Zhang Q, Fu Y:Evaluation of putative reference genes
for gene expression normalization in soybean by quantitative real-time RT-PCR.BMC Mol Biol2009,10:93.
10. Artico S, Nardeli SM, Brilhante O, Grossi-de-Sa MF, Alves-Ferreira M: Identifi-cation and evaluation of new reference genes inGossypium hirsutumfor accurate normalization of real-time quantitative RT-PCR data.BMC Plant Biol2010,10:49.
11. Vandesompele J, Preter KD, Pattyn F, Poppe B, Roy NV, Paepe AD, Speleman F:Accurate normalization of real-time quantitative RT-PCR data by geo-metric averaging of multiple internal control genes.Genome Biol2002,3 (7):research0034.1.
12. Gutierrez L, Mauriat M, Guénin S, Pelloux J, Lefebvre JF, Louvet R, Rusterucci C, Moritz T, Guerineau F, Bellini C, Van Wuytswinkel O:The lack of a systematic validation of reference genes: a serious pitfall undervalued in reverse transcription-polymerase chain reaction (RT-PCR) analysis in plants.Plant Biotechnol J2008,6(6):609–618.
13. Schmittgen TD, Zakrajsek BA:Effect of experimental treatment on housekeeping gene expression: validation by real-time, quantitative RT-PCR.J Biochem Biophysiol2000,46(1–2):69–81.
14. Pfaffl MW, Tichopad A, Prgomet C, Neuvians TP:Determination of stable housekeeping genes, differentially regulated target genes and sample integrity: BestKeeper–excel-based tool using pair-wise correlations.
Biotechnol Lett2004,26:509–515.
15. Andersen CL, Jensen JL, Ørntoft TF:Normalization of real-time quantitative reverse transcription-PCR data: a model-based variance estimation approach to identify genes suited for normalization, applied to bladder and colon cancer data sets.J Canc Res2004,64:5245–5250.
16. Jain M, Nijhawan A, Tyagi AK JPK:Validation of housekeeping genes as internal control for studying gene expression in rice by quantitative real-time PCR.Biochem Biophys Res Commun2006,345:646–651. 17. Reid K, Olsson N, Schlosser J, Peng F, Lund S:An optimized grapevine RNA
isolation procedure and statistical determination of reference genes for real-time RT-PCR during berry development.BMC Plant Biol2006,6:27. 18. Cruz F, Kalaoun S, Nobile P, Colombo C, Almeida J, Barros LMG, Romano E,
Fátima Grossi-de-Sá M, Vaslin M, Alves-Ferreira M:Evaluation of coffee reference genes for relative expression studies by quantitative real-time RT-PCR.Mol Breed2009,23(4):607–616.
19. Preedy VR:Olives and olive oil in health and disease prevention Elsevier.; 2010. 20. Choudhury N, Tan L, Truswell AS:Comparison of palmolein and olive oil:
effects on plasma lipids and vitamin E in young adults.Am J Clin Nutr 1995,61:1043–1051.
21. Harwood JL, Aparicio R:Handbook of olive oil: Analysis and properties: Aspen.; 2000. 22. Harwood JL, Yaqoob P:Nutritional and health aspects of olive oil.Eur J
Lipid Sci Technol2002,104:685–697.
23. Sheppard S:Consumer attitudes to Australian extra virgin olive oil.In Rural Industries Research and Development Corporation.; 2008.
24. Quiles JL, Ramirez-Tortosa C, Yaqoob P:Olive oil and health. InCAB Inter-national.; 2006.
25. International Olive Oil Council:Olive product market report summary No 35.; 2010. 26. Alagna F, D'Agostino N, Torchia L, Servili M, Rao R, Pietrella M, Giuliano G,
Chiusano ML, Baldoni L, Perrotta G:Comparative 454 pyrosequencing of transcripts from two olive genotypes during fruit development.
BMC Genomics2009,10:399.
27. Donaire L, Pedrola L, Rosa R, Llave C:High-throughput sequencing of RNA silencing-associated small RNAs in olive (Olea europaea L.).PLOS One 2011,6(11):1–14.
28. Yanik H, Turktas M, Dundar E, Hernandez P, Dorado G, Unver T: Genome-wide identification of alternate bearing-associated microRNAs (miRNAs) in olive (Olea europaea L.).BMC Plant Biol2013,13:10.
29. Nonis A, Vezzaro A, Ruperti B:Evaluation of RNA extraction methods and identification of putative reference genes for real-time quantitative polymerase chain reaction expression studies on olive (Olea europaea L.) fruits.J Agric Food Chem2012,60(27):6855–6865.
30. Resetic T, Stajner N, Bandelj D, Javornik B, Jakse J:Validation of candidate reference genes in RT-qPCR studies of developing olive fruit and expression analysis of four genes involved in fatty acids metabolism.Mol Breed2013, 32:211–222.
31. Uddin MJ, Cinar MU, Tesfaye D, Looft C, Tholen E, Schellander K:Age-related changes in relative expression stability of commonly used housekeeping genes in selected porcine tissues.BMC Res Notes2011,4:441.
32. Maroufi A, Bockstaele EV, Loose MD:Validation of reference genes for gene expression analysis in chicory (Cichorium intybus) using quantitative real-time PCR.BMC Mol Biol2010,11:15.
33. Expósito-Rodríguez M, Borges AA, Borges-Pérez A, Pérez JA:Selection of internal control genes for quantitative real-time RT-PCR studies during tomato development process.BMC Plant Biol2008,8:131.
34. Nicot N, Hausman JF, Hoffmann L, Evers D:Housekeeping gene selection for real-time RT-PCR normalization in potato during biotic and abiotic stress.J Exp Bot2005,56(421):2907–2914.
35. Jian B, Liu B, Bi Y, Hou W, Wu C, Han T:Validation of internal control for gene expression study in soybean by quantitative real-time PCR.
BMC Mol Biol2008,9:59.
36. Hoenemann C, Hohe A:Selection of reference genes for normalization of quantitative real-time PCR in cell cultures ofCyclamen persicum.
Electron J Biotechnol2011,14(1):1–8.
37. Kuijk E, Puy L, Tol H, Haagsman H, Colenbrander B, Roelen B:Validation of reference genes for quantitative RT-PCR studies in porcine oocytes and preimplantation embryos.BMC Dev Biol2007,7:58.
38. Silveira ÉD, Alves-Ferreira M, Guimarães LA, Silva FR, Carneiro VT:Selection of reference genes for quantitative real-time PCR expression studies in the apomictic and sexual grassBrachiaria brizantha.BMC Plant Biol2009,9:84. 39. Hong S, Seo P, Yang M, Xiang F, Park C:Exploring valid reference genes
for gene expression studies inBrachypodium distachyonby real-time PCR.BMC Plant Biol2008,8:112.
40. Gu Y, Li M, Zhang K, Chen L, Jiang A, Wang J, Li X:Evaluation of endogenous control genes for gene expression studies across multiple tissues and in the specific sets of fat and muscle-type samples of the pig.J Anim Breed Genet2011,128:319–325.
41. Schroeder A, Mueller O, Stocker S, Salowsky R, Leiber M, Gassmann M, Lightfoot S, Menzel W, Granzow M, Ragg T:The RIN: an RNA integrity number for assigning integrity values to RNA measurements.BMC Mol Biol2006,7:3.
42. Hall TA:BioEdit: a user-friendly biological sequence alignment editor and analysis program for Windows 95/98/NT.Nucleic Acids Symp Ser1999, 41:95–98.
doi:10.1186/1756-0500-7-304
Cite this article as:Ray and Johnson:Validation of reference genes for gene expression analysis in olive (Olea europaea) mesocarp tissue by quantitative real-time RT-PCR.BMC Research Notes20147:304.
Submit your next manuscript to BioMed Central and take full advantage of:
• Convenient online submission
• Thorough peer review
• No space constraints or color figure charges
• Immediate publication on acceptance
• Inclusion in PubMed, CAS, Scopus and Google Scholar
• Research which is freely available for redistribution