R E S E A R C H A R T I C L E
Open Access
Medical applications: a database and
characterization of apps in Apple iOS and
Android platforms
Heather J Seabrook
1, Julie N Stromer
1, Cole Shevkenek
1, Aleem Bharwani
2, Jill de Grood
1and William A Ghali
1,2,3*Abstract
Background:Medical applications (apps) for smart phones and tablet computers are growing in number and are
commonly used in healthcare. In this context, there is a need for a diverse community of app users, medical researchers, and app developers to better understand the app landscape.
Methods:In mid-2012, we undertook an environmental scan and classification of the medical app landscape in the two dominant platforms by searching the medical category of the Apple iTunes and Google Play app download sites. We identified target audiences, functions, costs and content themes using app descriptions and captured these data in a database. We only included apps released or updated between October 1, 2011 and May 31, 2012, with a primary“medical”app store categorization, in English, that contained health or medical content. Our sample of Android apps was limited to the most popular apps in the medical category.
Results:Our final sample of Apple iOS (n = 4561) and Android (n = 293) apps illustrate a diverse medical app landscape. The proportion of Apple iOS apps for the public (35%) and for physicians (36%) is similar. Few Apple iOS apps specifically target nurses (3%). Within the Android apps, those targeting the public dominated in our sample (51%). The distribution of app functions is similar in both platforms with reference being the most common function. Most app functions and content themes vary considerably by target audience. Social media apps are more common for patients and the public, while conference apps target physicians.
Conclusions:We characterized existing medical apps and illustrated their diversity in terms of target audience, main functions, cost and healthcare topic. The resulting app database is a resource for app users, app developers and health informatics researchers.
Keywords:App, Application, Software, Smartphone, Handheld computer, Mobile health
Background
Medical applications (“apps”) for mobile devices such as smartphones and tablet computers provide healthcare professionals, patients, and the public with a growing number of specialized tools and resources. Physicians and medical students have high rates of smartphone and tablet computer ownership [1-3], enabling them to use medical apps. There are over 800,000 apps available for each of the dominant mobile platforms, Apple iOS and
Android OS, and a subset of these are categorized by de-velopers as medical apps (2% for Apple iOS [4] and 1% for Androida).
A number of researchers have explored the use of smartphones and medical apps amongst medical students, residents and physicians. One survey at a Canadian medical school found that 85% of respondents owned smartphones and most regularly used medical apps [1]. In terms of functionality, medical students tend to use apps that serve as references for disease diagnosis and medica-tions, whereas physicians prefer medical calculators [2]. Similarly, a systematic review of academic literature on healthcare apps identified these app functions, along with literature searching, as the most common [5]. While this
* Correspondence:[email protected] 1
Ward of the 21st Century, GD01 TRW Building, 3280 Hospital Drive NW, University of Calgary, Calgary, AB T2N 4Z6, Canada
2
Department of Medicine, University of Calgary, Foothills Medical Centre, 1403 29th Street NW, Calgary, AB T2N 2 T9, Canada
Full list of author information is available at the end of the article
same review identified few published studies on apps for patients, all of the apps directed at patients focused on specific health conditions, including chronic illnesses. Re-views of apps that target specific health conditions [6-10] explore a larger number of available apps for patients. These studies provide insight into the range of functions performed by patient apps, such as education and diary/ tracking. Taking a somewhat broader view, a review of the 500 most popular medical apps in the Italian Android market identified a range of app purposes, with public education, health diaries and specialized medical calcu-lators being most popular [11]. Similar to the systematic review of the academic literature, these researchers identi-fied more apps for health professionals than for the public. Thus, the existing literature suggests a varied landscape in apps, with different target audiences being offered differ-ent kinds of apps. However, to the best of our knowledge, a comprehensive description of the medical app landscape for the dominant platforms has not been developed.
To contribute to the understanding of the broader medical app landscape, we therefore aimed to characterize a representative subset of apps in the medical category of the two dominant platforms: Apple iOS and Android. In doing so, our objectives were to broadly describe the med-ical app landscape in terms of: 1) target audiences, 2) main functions performed by medical apps, 3) app functions viewed by target audience, 4) cost, and 5) healthcare topics examined by target audience. The database [12] used to catalogue apps is also provided here to support researchers conducting further investigations. This paper shows the di-verse and varied landscape of medical apps by presenting data that illustrate the distribution of medical apps across target audiences, app functions, cost and healthcare topics.
Methods
Data sources
We selected our sample of mobile apps from the med-ical category of the two official app stores: iTunes App Store for Apple iOS apps and Google Play for Android apps. At the time of data collection, we were able to access the full range of iTunes medical apps, because iTunes dis-played all apps in the medical category, whether free or paid. However, Google’s removal of the full-category view in early 2012 when they rebranded the Android Market as Google Play [13] resulted in only being able to access a subset of Android medical apps in both the free and paid sub-categories. This subset includes the most frequently downloaded apps (i.e., most popular). Apple also removed the full-category view in the Fall of 2012 [14] after our data were collected.
Identification of app characteristics - database structure
The research team collectively developed a list of medical app characteristics, after examining a random selection
of apps. We defined target audience by the role of the group(s) who would use the app as either specified or in-ferred from the app description (i.e., physicians, medical students, nurses, clinicians - unspecified, other healthcare professionals, patients, the public and others). We added the “clinician - unspecified” target audience after obser-ving that many apps specified a general audience (e.g., “intended for healthcare providers”) or could be used by a range of health professionals. Other healthcare profes-sionals include allied health, pre-hospital care, and alter-native medicine. When an app might be used by a person who is under health provider care or managing a long-term condition such as diabetes, we characterized it as a patient app; whereas apps for self-care without clinician over-sight, including home remedies, calorie trackers, home health guides, and medical service locators, were characterized as apps for the public. We identified the function or purpose of an app using the following cate-gories: alternative medicine (e.g., acupuncture, herbal me-dicine, homeopathy, meditation and yoga), calculator (e.g., pregnancy due date calculators to veterinary medicine dose calculators), conference (e.g., accompanies a confer-ence often providing access to schedules and resources), diagnosis (e.g., ranges from apps for self-diagnosis with heart attack symptoms to psychological tests), education (e.g., educational content usually to support self-directed learning), monitoring/export, motivational, nutrition/diet, and other (e.g., a broad range including tools for people with disabilities, appointment booking and service adver-tising/locating, patient records/results (e.g., patient man-agement, history taking, access to patient test results), reference (e.g., guides, databases, flash cards, quick refer-ences), reminder (e.g., medication reminder, healthcare appointment reminder, and addiction coaching), social media (e.g., support groups for specific conditions), track-ing/diary (e.g., to record and/or display measures over time including symptoms, test results, medications taken, weight, fetal growth). We also noted the initial cost of the app in Canadian dollars. Cost does not include in-app purchases or subscriptions required to use an app. We also characterized apps by topics, which includes medical conditions (e.g., diabetes, asthma), areas of study or spe-cialization (e.g., pharmacology, cardiology), and treat-ments or activities (e.g., surgery, exercise). We developed a database using Microsoft Access 2010 to categorize the apps using the defined characteristics. We included fields for primary through tertiary target audiences and func-tions, because our preliminary explorations revealed that apps are often targeted at multiple audiences with mul-tiple purposes.
App characterization
when available, screen captures. Sometimes the app de-scription used the same terms our team had chosen to characterize apps (e.g., physician, tracking). In these cases, we simply recorded the information from the description. More commonly, characterization required interpretation of the app description and screen captures. We also char-acterized apps thematically by content themes [15]. To identify content themes, we first coded the apps by topics such as medical conditions, areas of study and specializa-tions. Then two researchers reviewed the list of topic codes to develop the higher-level content themes, which were subsequently refined through input from content experts.
To support coding consistency, two researchers inde-pendently categorized 50 apps, comparing entries after every ten. Few differences were found, with the excep-tion of topic coding. When discrepancies occurred, they discussed the coding to reach mutual agreement and re-fined our coding approach. New topic codes were added to a master list as they emerged, providing us with a gro-wing list of keywords to apply to subsequent apps and to use in further analyses.
To assess congruence between the developers’ de-scriptions and the actual app, we installed a random se-lection of 20 Apple iOS apps from the first 600 apps we had catalogued. We characterized the installed apps by working with the apps and then compared this cha-racterization to that derived from the developers’ de-scriptions. Coding was consistent using the installed app and developer description except in the case of one paid app with a poorly written (possibly auto-translated) description. We performed a similar verification process with a random selection of 10 popular Android apps from the first 60 apps we had catalogued. Again, coding was consistent, assuring us that the app store descrip-tion could be used to characterize the apps.
Inclusion and exclusion criteria
A number of filtering processes were applied to the data at the time of collection and during refinement to ensure data quality.
Medical category
All apps were sampled from the medical category of the app markets. We included apps with the primary cat-egory listed as“medical” in Apple iTunes. Apps that did not have medical as a primary category (e.g., health and fitness, lifestyle) were excluded (approximately 25%). Google Play allowed developers to choose only one cat-egory for their app; therefore, manual exclusion of apps based on category was not necessary.
Medical apps
Available apps from the medical category were included. We excluded apps that did not feature health or medical
content, such as music apps. Some apps appeared to be erroneously categorized.
Date released or last updated
We limited our sample to apps released or updated be-tween October 1, 2011 and May 31, 2012. Active apps are often updated to add functionality, fix software prob-lems, and show the app is current. We selected the date range based on a random selection of Apple iOS medical apps (220 of approximately 7000), for which the distri-bution with respect to release/update date fell off signifi-cantly prior to October 2011.
English language
We excluded apps that used a language other than English as the primary language.
Analysis
We designed queries in Microsoft Access to explore sub-sets of the database. We extracted data by overall target audience, function, cost and topic, and also explored the latter three by their target audiences. We summarized data coded in the primary and secondary categories of the database for target audience and function, choosing these to capture the dominant categories for our analysis rather than a more exhaustive list. We used Microsoft Excel 2010 to calculate descriptive statistics and generate the figures included in this report.
Results
Number of apps in our sample
We retained 4857 medical apps in our final sample: 4561 Apple iOS and 293 Android. The final Android sample is small compared to our Apple iOS sample and is limited to apps that were most frequently downloaded because of the app search site changes as described above. Due to the differences in the samples, we present the results for the two platforms separately.
Characterization of Apple iOS apps from the medical category
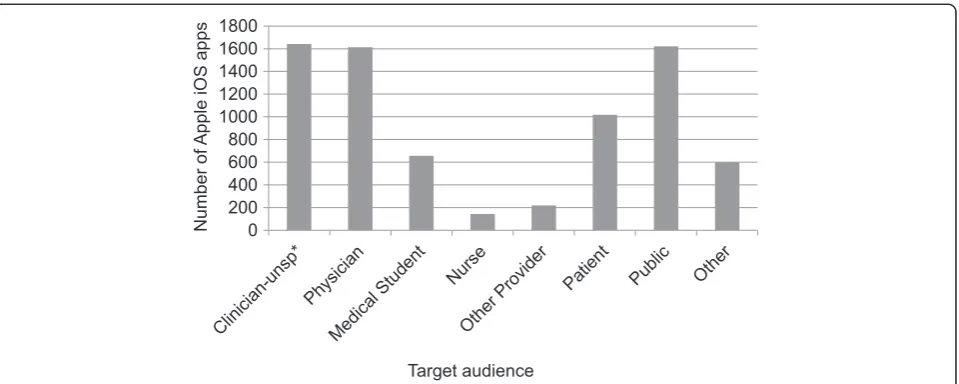
Distribution of Apple iOS apps by target audience
use by both patients and providers (physicians or clini-cians) (0.8%).
Distribution of Apple iOS apps by function
Figure 2 shows app distribution by function or purpose in our Apple iOS sample. Reference and education apps dominate. The third largest functional category is“other,” which includes apps for clinic advertisements and ac-counting purposes. Apps that perform tracking and moni-toring functions are common, as are calculators.
Figure 3 displays a colour-coded concentration graph of apps by target audience and function. Data are coloured by quintile; the colour intensifies as the number of apps in the quintile increases. Figure 3 shows that reference apps
are the most common function for all audiences. Other functions have more varied target audiences. Figure 3 also illustrates that apps that remind, monitor and track are often intended for patients or the general public, as are so-cial media apps; whereas, calculator, reference and confe-rence apps are more often intended for physicians.
Distribution of Apple iOS apps by cost
Free apps dominate the Apple iOS medical category and most of the paid apps cost $5CDN or less to install. Few apps cost more than $20.00 to install. The average cost of paid Apple iOS medical apps is $11.26. By compari-son, average costs for some specific audiences are as 0
200 400 600 800 1000 1200 1400 1600 1800
Number of
Apple
iOS
apps
[image:4.595.60.540.88.280.2]Target audience
Figure 1Distribution of Apple iOS medical apps by target audience.The clinician - unspecified category includes physicians, nurses, medical students and pharmacists and was applied when multiple audiences were possible or a general description such as“health provider”was supplied in the description. (unsp* = unspecified).
0 500 1000 1500 2000 2500 3000
Motivational Nutrition / Diet Social Media Alternative Medicine Reminder Diagnosis Conference Patient Records / Results Calculator Monitoring / Export Tracking / Diary Other Education Reference
Number of Apple iOS Apps
[image:4.595.57.540.526.714.2]App Function
follows: physician $18.72, nurse $10.21 and patient $8.30. The modal cost among non-free apps is $0.99.
Distribution of Apple iOS apps by content themes
Our analysis of the coded topics resulted in 29 themes (see Additional file 1). Additional file 1 illustrates that the total number of apps varies by content theme and by target audience within the themes. For example, anaes-thesiology and radiology contain relatively large numbers of apps for physicians. Conversely, a large proportion of pain and migraine management apps target both pa-tients and the public; while diet apps mainly target the general public with few apps for patients and none for health professionals.
Characterization of popular Android apps from the medical category
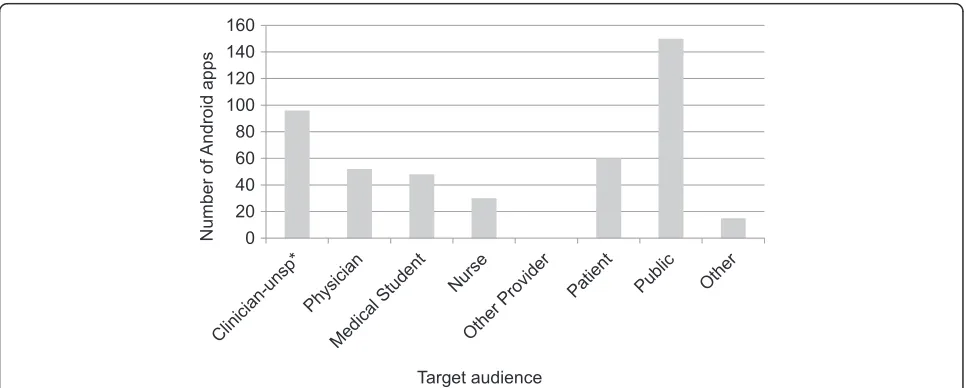
Distribution of popular Android apps by target audience Figure 4 illustrates the number of medical apps identified for each target audience in our sample popular Android medical apps. These apps are dominated by apps intended for the public (51%). Although there were many apps targeting nurses, there were 42% more apps coded for physicians.
[image:5.595.58.539.89.276.2]Distribution of popular Android apps by function
Figure 5 shows app distribution by function or purpose in our Android sample. Reference and education apps are the largest functional category followed by “other,”
Target Audience
Function Clinician
Unsp* Physician
Medical Student Nurse
Other HealthCare
Provider
Public or Patient Other
Motivational 3 1 0 0 0 9 0
Nutrition / Diet 1 1 0 0 0 42 0
Social Media 13 12 0 0 2 31 3
Alternative Medicine 3 1 0 0 5 56 7
Reminder 16 5 0 2 1 61 1
Diagnosis 33 35 1 2 6 31 5
Conference 90 78 1 1 3 4 10
Patient Records, Results 123 133 1 7 5 36 9
Calculator 155 181 10 10 13 113 24
Monitoring / Export 144 82 2 7 8 258 9
Tracking / Diary 61 63 3 11 11 408 21
Other 266 275 17 10 32 878 113
Education 199 423 597 94 101 392 368
Reference 1076 1166 645 119 175 758 483
Figure 3Colour-coded concentration graph of apps by function and target audience.Data are coloured by quintile. The colour intensifies as the number of apps in the quintile increases. (unsp* = unspecified).
0 20 40 60 80 100 120 140 160
Num
ber of
Android
apps
Target audience
[image:5.595.57.540.500.694.2]which includes apps for clinic advertisements. Apps that perform tracking and monitoring functions are common, as are calculators.
Distribution of popular Android apps by cost
Over 75% of the most popular apps in the Android medical category are free to install. Most popular paid Android apps cost between $2 CDN and $5 CDN. The average cost of popular paid Android medical apps is $8.04. By comparison, the average costs for some spe-cific audiences are as follows: physician $12.74, nurse $5.27, and patient $1.97.
Discussion
This study catalogued a large number of apps from the medical category to describe the medical app landscape in the two dominant platforms: Apple iOS and Android. In doing so, we identified target audiences, functions, costs and content themes. Overall, our results reveal the diversity of the medical app landscape. Our colour-coded “concentration graph” illustrates the distribution of apps across target audiences and functions. In ad-dition, we describe a method for conducting research in this dynamic domain and present the database devel-oped for the study with the data in an open-access for-mat so that researchers and app developers can explore further questions [12].
The recent explosion of medical apps has attracted the attention of a wide audience, including app developers, clinicians, the general public, regulators and the popular media. To date, in the medical informatics literature, the medical app landscape has not been systematically des-cribed. The present study updates and extends the exist-ing body of literature by presentexist-ing a cross-sectional categorization of apps that represents the scope of the
medical app landscape in the two dominant platforms at the time of study. Previous studies provided insights into the functions, target audiences and quality of specific subsets of the medical app landscape; these studies in-clude apps for specific conditions, such as diabetes [6,16], asthma [7], colorectal disease [9] and melanoma [10], as well as medical specializations [17]. Our study reviews the broad landscape, investigating the number of apps for various functions and healthcare content themes. In doing so, our results reveal an abundance of apps, which vary in number by functions and content themes, and identify nu-merous additional subsets of the medical app landscape in need of further investigation into quality.
Our data suggest changes to overall app development trends relative to previous studies and also reveal new levels of detail in app distribution that provide a starting point to investigate future trends. Previous studies indi-cate that apps for health professionals were most preva-lent [5,11]. However, we found a balance between apps for providers and the public in the Apple iOS platform. Our results reveal a large number of apps available to physicians; however, physicians actually report using few apps and typically use general-purpose medical apps such as calculators and drug references [2,17,18]. There is a clear dominance of apps for the public in our sample of popular Android apps. Our results align with trends in device ownership: physicians prefer Apple devices [18], whereas Android devices are more common overall [19]. Further, our classification distinguished between patients and the public, with apps for the public directed towards self-care. Few apps for patients would also be used by providers, suggesting little information sharing or communication. Our results suggest a smaller pres-ence for clinicians in the medical app landscape than previously described. Our data collection method also
0 50 100 150 200 250
Motivational Nutrition / Diet Social Media Alternative Medicine
Reminder
Diagnosis Conference
Patient Records / Results
Calculator Monitoring / Export
Tracking / Diary
Other Education
Reference
Number of Android Apps
App Fun
c
[image:6.595.57.541.527.714.2]tion
allowed us to specify clinicians as a general target audi-ence as well as physicians, medical students, nurses and “other health professionals” as more specific audiences. In doing so, we provide a unique view of the app land-scape that highlights the dearth of apps for nurses and other health professionals. Thus our results temper the call to curb the proliferation of medical apps [20] by highlighting areas where there are few apps, while recog-nizing the need to ensure these apps provide quality tools and resources [17]. Interestingly, though there is a large variety of apps available, downloads are generally confined to the most popular apps [11]. It is worth not-ing that neither general availability nor number of down-loads tells us about initial or ongoing app-use. The “who, what and why” of app-use remains an important area for future research. It is also important to note that while our data reveal that most medical apps are free, the initial cost of apps does not reflect the total cost to use an app, with an increasing amount of app income coming from in-app purchases [21].
We also describe a method that can be used by future researchers to conduct similar studies, whether focusing on medical apps or exploring other app market categories. Researchers conducting app reviews face considerable challenges, including lack of an established method, de-scriptions that lack a consistent format or metadata, and volatility of app store presentations. Had we devised a means of extracting all required data from the app mar-kets at the outset of the study, the risks of volatility would have been mitigated. This should be taken into consider-ation for those conducting similar studies in the future.
The work presented here is not without limitations. The scope of this review was limited to English apps in the Medical category, excluding potentially rich data within the Health and Fitness and Education categories and in other languages. These exclusions were mindfully applied to limit the scope to apps we could reliably cha-racterize and to focus on apps developers defined as med-ical. A second limitation of this work is that our sample of Android apps was limited to only the most popular apps. Popularity is based on the number of downloads; con-sequently, the sample may be biased towards free and inexpensive apps, exclude specialized clinical apps and overemphasize patient/public apps. By extracting data from the two dominant platforms, we were able to make high-level comparisons and observe that the general trends in target audience, function and cost are simi-lar, despite the potential bias. Our small Android sample did not allow us to analyze these data across target audi-ence and functions, and target audiaudi-ence and themes. Finally, the cataloguing process depended on our ability to interpret app store descriptions. Deciding how to characterize an app in terms of health professionals and key functions often required interpretation. We iteratively
compared and refined our cataloguing to achieve con-sistency; however, the subjective nature of coding remains in any study of this kind. Guidelines for medical-app de-scriptions that include target audience, functions and key-words would mitigate this challenge and also benefit those attempting to find apps.
Conclusions
In this study we used an approach analogous to a scoping review of the literature to assess the“size and scope… na-ture and extent”[22] of the medical app landscape of the two dominant platforms: Apple iOS and Android. We de-scribe the domain in terms of target audience, app func-tion, cost and content themes. The resulting snapshot of the medical app landscape may benefit medical app users, developers, and future researchers wishing to catalogue mobile apps. For medical app users, the information here could help them search for and identify apps. Similarly, the scoping review provided by the present study could support efforts to manage app proliferation and improve app discoverability. For developers, our data may expose key insights into areas of future app development oppor-tunities. Finally, for future researchers, this time-stamped data collection can be used in a retrospective comparison and as a guide for conducting similar reviews.
Availability of supporting data
The data set supporting the results of this article is available in the Labarchives repository, DOI:10.6070/H4QV3JGM.
Endnote a
Calculated using data available from appbrain.com retrieved on Feb 10, 2013. The total number of apps in the Android Medical category is available at http://www. appbrain.com/stats/android-market-app-categories and the total number of Android apps is available at http:// www.appbrain.com/stats/number-of-android-apps.
Additional file
Additional file 1:Distribution of Apple iOS apps by themes and topics for each target audience.
Competing interests
The authors declare that they have no competing interests.
Authors’contributions
Acknowledgements
We thank Garielle Brown and Aida Raissi for their help with data collection. We also thank Trevor D. Borden for his advice on study design and assistance with data extraction and analysis. H.J. Seabrook and B.C. Shevkenek were supported by funding from TRTech. The Department of Medicine, ARP Business Cost Program provided funds to purchase the tablet computers used in this study. W.A. Ghali is funded as a Senior Health Scholar by Alberta Innovates Health Solutions.
Author details
1Ward of the 21st Century, GD01 TRW Building, 3280 Hospital Drive NW,
University of Calgary, Calgary, AB T2N 4Z6, Canada.2Department of Medicine, University of Calgary, Foothills Medical Centre, 1403 29th Street NW, Calgary, AB T2N 2 T9, Canada.3Department of Community Health Sciences, Institute for Public Health, University of Calgary, Faculty of Medicine, 3rd Floor TRW Building, 3280 Hospital Drive NW, Calgary, AB T2N 4Z6, Canada.
Received: 20 August 2014 Accepted: 22 August 2014 Published: 27 August 2014
References
1. Wallace S, Clark M, White J:‘It’s on my iPhone’: attitudes to the use of mobile computing devices in medical education, a mixed-methods study.BMJ Open2012,2(4):1–7.
2. Payne KF, Wharrad H, Watts K:Smartphone and medical related App use among medical students and junior doctors in the United Kingdom (UK): a regional survey.BMC Med Inform Decis Mak2012,12(1):1–11.
3. Koehler N, Yao K, Vujovic O, McMenamin C:Medical students’use of and attitudes towards medical applications.J Mob Technol Med2012, 1(4):16–21.
4. App store metrics: application category distribution.[http://148apps.biz/ app-store-metrics/?mpage=catcount]
5. Mosa ASM, Yoo I, Sheets L:A systematic review of healthcare applications for smartphones.BMC Med Inform Decis Mak2012,12(1):67.
6. Chomutare T, Fernandez-Luque L, Arsand E, Hartvigsen G:Features of mobile diabetes applications: review of the literature and analysis of current applications compared against evidence-based guidelines.J Med Internet Res2011,13(3):e65.
7. Huckvale K, Car M, Morrison C, Car J:Apps for asthma self-management: a systematic assessment of content and tools.BMC Med2012,10:144. 8. Rosser BA, Eccleston C:Smartphone applications for pain management.
J Telemed Telecare2011,17(6):308–312.
9. O’Neill S, Brady RRW:Colorectal smartphone apps: opportunities and risks.Color Dis2012,14(9):e530–e534.
10. Wolf JA, Moreau JF, Akilov O, Patton T, English JC, Ho J, Ferris LK: Diagnostic inaccuracy of smartphone applications for melanoma detection.JAMA Dermatol2013,149(4):422–426.
11. Obiodu V, Obiodu E:An empirical review of the top 500 medical apps in a European Android market.J Mob Technol Med2012, 1(4S):22–37.
12. Stromer J, Shevkenek B:Medical applications.Labarchives2013. http://dx.doi.org/10.6070/H4QV3JGM.
13. Hachman M:Google Rebrands Android Market, Google Music as‘Play’.Ziff Davis; 2012 [http://www.pcmag.com/article2/0,2817,2401210,00.asp] 14. Perez S:With new iOS 6 App Store, the most important changes are
under the hood.TechCrunch2012,2013:AOL.
15. Braun V, Clarke V:Using thematic analysis in psychology.Qual Res Psychol 2006,3(2):77–101.
16. Eng DS, Lee JM:The promise and peril of mobile health applications for diabetes and endocrinology.Pediatr Diabetes2013,14(4):231–238. 17. Franko OI:Smartphone apps for orthopaedic surgeons.Clin Orthop2011,
469(7):2042–2048.
18. Franko OI, Tirrell TF:Smartphone app use among medical providers in ACGME training programs.J Med Syst2012,36(5):3135–3139.
19. Meeker M:2012 Internet Trends.InD10 Conference.Rancho Palos Verdes, California: Kleiner Perkins Caufield Byers; 2012.
20. van Velsen L, Beaujean DJ, van Gemert-Pijnen JE:Why mobile health app overload drives us crazy, and how to restore the sanity.BMC Med Inform Decis Mak2013,13:23.
21. Gartner says less than 0.01 percent of consumer mobile apps will be considered a financial success by their developers through 2018. [http://www.gartner.com/newsroom/id/2648515]
22. Grant MJ, Booth A:A typology of reviews: an analysis of 14 review types and associated methodologies.Health Inf Libr J2009,26(2):91–108.
doi:10.1186/1756-0500-7-573
Cite this article as:Seabrooket al.:Medical applications: a database and characterization of apps in Apple iOS and Android platforms.BMC
Research Notes20147:573.
Submit your next manuscript to BioMed Central and take full advantage of:
• Convenient online submission
• Thorough peer review
• No space constraints or color figure charges
• Immediate publication on acceptance
• Inclusion in PubMed, CAS, Scopus and Google Scholar
• Research which is freely available for redistribution