Open Access
Short Report
An approach to comparing tiling array and high throughput
sequencing technologies for genomic transcript mapping
Rajkumar Sasidharan*
1,2, Ashish Agarwal
1, Joel Rozowsky
1and
Mark Gerstein*
1,3,4Address: 1Molecular Biophysics and Biochemistry Department, Yale University, New Haven, CT 06520, USA, 2Department of Plant Biology,
Carnegie Institution for Science, Stanford, California 94305, USA, 3Interdepartmental Program in Computational Biology and Bioinformatics, Yale
University, New Haven, CT 06520, USA and 4Department of Computer Science, Yale University, New Haven, CT 06520, USA
Email: Rajkumar Sasidharan* - [email protected]; Ashish Agarwal - [email protected]; Joel Rozowsky - [email protected]; Mark Gerstein* - [email protected]
* Corresponding authors
Abstract
Background: There are two main technologies for transcriptome profiling, namely, tiling microarrays and high-throughput sequencing. Recently there has been a tremendous amount of excitement about the latter because of the advent of next-generation sequencing technologies and its promises. Consequently, the question of the moment is how these two technologies compare. Here we attempt to develop an approach to do a fair comparison of transcripts identified from tiling microarray and MPSS sequencing data.
Findings: This comparison is a challenging task because the sequencing data is discrete while the tiling array data is continuous. We use the published rice and Arabidopsis datasets which provide currently best matched sets of arrays and sequencing experiments using a slightly earlier generation of sequencing, the MPSS tag sequencing technology. After scoring the arrays consistently in both the organisms, a first pass comparison reveals a surprisingly small overlap in transcripts of 22% and 66% respectively, in rice and Arabidopsis. However, when we do the analysis in detail, we find that this is an underestimate. In particular, when we map the probe intensities onto the sequencing tags and then look at their intensity distribution, we see that they are very similar to exons. Furthermore, restricting our comparison to only protein-coding gene loci revealed a very good overlap between the two technologies.
Conclusion: Our approach to compare genome tiling microarray and MPSS sequencing data suggests that there is actually a reasonable overlap in transcripts identified by the two technologies. This overlap is distorted by the scoring and thresholding in the tiling array scoring procedure.
Background
Although gene expression analysis can reveal interesting clues to the biochemical state of cells, they do not provide a complete picture of cellular transcription as they focus only on known protein-coding genes. There has been
con-siderable interest in the identification and implication of new non-coding RNA molecules in myriad cellular func-tions [1]. Therefore, it is essential that we use unbiased technologies for transcript mapping to expand our under-standing of these classes of RNAs. The introduction of
Published: 24 July 2009
BMC Research Notes 2009, 2:150 doi:10.1186/1756-0500-2-150
Received: 31 January 2009 Accepted: 24 July 2009
This article is available from: http://www.biomedcentral.com/1756-0500/2/150
© 2009 Sasidharan et al; licensee BioMed Central Ltd.
technologies in the sequencing market at this juncture offers a unique opportunity to develop methods for a fair comparison of data from these technologies.
In this work, our objective is to describe an approach towards comparing tiling microarray data and sequencing data for genome-wide transcript mapping. Although the ideal comparison would be using data from a high-resolu-tion tiling array and next-generahigh-resolu-tion sequencing methods, the best available datasets at this point of time are the 36-mer oligo nucleotide arrays (positioned every 46 nucle-otides) and the tag based MPSS (Massively Parallel Signa-ture Sequencing) technology. We explore how well these two technologies compare in transcript detection for Ara-bidopsis and rice, the two most well-studied model organ-isms for understanding plant biology.
This objective is not a trivial task as we must bear in mind that the nature of the two types of data that we are com-paring is completely different. The data from sequencing experiments are simple, in that, they are discrete and pro-vide a start and an end coordinate for transcripts. Tiling array experiments provide a continuous value, the inten-sity measure, for each probe on the array. These probes correspond to a discrete sampled genomic region and transcript boundaries from a collection of probe intensi-ties are then identified by applying segmentation methods on these data points. Typically, the methods employed for demarcating transcript boundaries have to deal with issues of choosing correct thresholds. One of the algorith-mic challenges in analyzing tiling array data is choosing an optimal set of parameters that would reduce the number of false positives when scoring transcriptionally active regions. We rescored the Arabidopsis and rice tiling array datasets using a uniform set of parameters (Addi-tional file 1).
Overlap in transcripts identified using MPSS and tiling microarray data
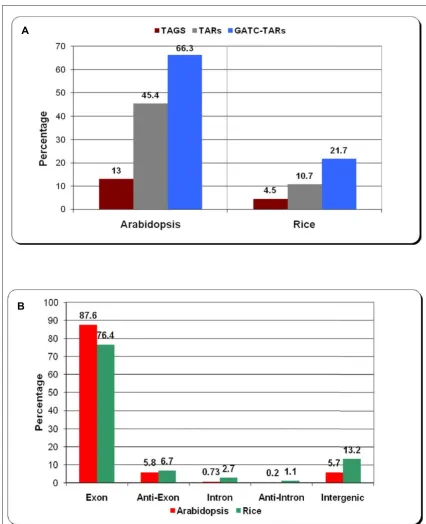
After identifying transcripts from tiling array data we com-pared the extent to which the two platforms overlap in their transcriptome profiling. A simple intersection of MPSS tags and tiling array TARs (Transcriptionally Active Regions) shows that they overlap poorly. 13% of MPSS tags (16,647) overlapped with 45% of TARs (11,207) in Arabidopsis while only 4.5% (4,513) of MPSS tags over-lapped with 10.7% of TARs (3,554) in rice (Figure 1A). An inherent feature of MPSS technology is its inability to identify transcripts that do not have a restriction site rec-ognized by the anchoring enzyme DpnII (recognition site: GATC). We observed that the overlap increases to 66.3% of all TARs for Arabidopsis when we consider only those TARs that contain at least one occurrence of the
tetra-16,902 TARs out of a total number of 24,712 TARs in Ara-bidopsis that had at least one GATC. There are 16,392 TARs in rice that have at least one GATC and if we consider only these, the overlap increases from 10.7% to 21.7%.
As we expected, a large percentage of the overlap is in exonic transcripts – 87.6% and 76.4% in Arabidopsis and rice, respectively (Figure 1B). The percentage of overlap is ~6% in Arabidopsis and ~7% in rice for anti-sense exonic transcripts and ~6% in Arabidopsis and ~13% in rice for intergenic transcripts. Thus, in terms of confirming TARs using a second method, there is a moderate overlap between MPSS tags and Arabidopsis TARs (66.3%) but a low overlap for rice TARs (21.7%). In this process, we found ~1000 novel transcripts in Arabidopsis and ~600 novel transcripts in rice that were identified by both the platforms. These represent a highly concordant set of intergenic transcripts for these two species. A comparison of protein-coding gene loci identified by the two technol-ogies revealed a very good overlap (Additional file 2).
Calculating mean intensity for MPSS tags from tiling microarray data
We sought to investigate the reason behind the low to moderate overlap for MPSS tags. This objective also addresses a related question, namely, identifying the right set of parameters that would maximize the overlap. The three key parameters, namely, signal intensity threshold, maxgap and minrun can be tweaked to generate multiple sets of TARs. We reasoned that we are actually comparing two completely different types of data – the end product of a sequencing run is a 17 base pairs (bp) tag that has start and end coordinates in genomic space. The TARs have a start and an end coordinate too, but are derived from processing a set of continuous values in the form of intensity measure for the probes spotted on the array. The transcript boundaries, in effect, reflect the probe geometry rather than the actual start and end of a transcript. Thus, to accomplish a fair comparison of data from the two methods we decided to look at the distribution of probe intensities around the MPSS tag location after mapping the tags on the tiling array.
Intersection of MPSS tags and TARs from tiling microarray for Arabidopsis and rice
Figure 1
Intersection of MPSS tags and TARs from tiling microarray for Arabidopsis and rice. Figure 1A shows the percent-age of transcripts that are identified by both the technologies. GATC-TARs represent the percentpercent-age over the subset of TARs that contain at least one GATC motif, the recognition site for the anchoring enzyme DpnII used in MPSS sequencing protocol. Figure 1B shows the distribution in percentage of the transcripts that are identified by both the technologies among five classes of genomic features, viz. exon, anti-exon, intron, anti-intron and intergenic.
A
117, 167 and 217 bp in length, respectively, on the tile path. In order to evaluate the intensity distribution that we obtained from empirical data with random expecta-tion, we chose 10,000 regions randomly from the tile path and calculated the mean intensity in percentile for these regions.
MPSS tags are enriched for higher intensities on the tiling microarray
Figure 2 summarizes the results we obtained from imple-menting the above procedure. Figure 2A shows the distri-bution of intensities for, the four different tag flanks, all probes within exons and for the 10,000 randomly selected regions on the tiling array for Arabidopsis. Figure 2B shows the corresponding set of distribution of intensities for rice. An unpaired t-test on the intensity distributions of MPSS tags for each of the four regions and the random distribu-tion gave a p-value less than 2.2e–16 suggesting that inten-sity distributions from probes that map to the same region as the tags are significantly different from the random dis-tribution; in addition, the distributions overlap with intensity distribution from exonic probes. We also observed that there is a significant enrichment in signal on the tiling array in the immediate vicinity of the MPSS tag.
In Arabidopsis, the mean intensity percentile of the region around the tag increases from 63.1 when we consider a region spanning 6 probes on average to 66.1 when we consider only the immediate probe or two. The mean intensity percentile of all exonic probes is 70.8 in Arabi-dopsis. Thus, if we consider a signal intensity percentile of 70 as our threshold intensity for calling transcription in Arabidopsis, we find that 62% of all MPSS tags show an enriched signal similar to transcribed exons.
In rice, the mean intensity percentile increases from 59.9 to 61.1 as we go from 6 probes to 2 probes around the MPSS tag. An unpaired t-test gave a p-value less than 2.2e– 16 suggesting that the mean intensity percentile obtained from 2 probes is significantly higher than the mean inten-sity obtained from 6 probes. This holds good for both Ara-bidopsis and rice. The mean intensity percentile of all exonic probes in rice is 64.6. Again, if we consider a signal intensity of 65 as threshold intensity for transcription in rice, we find that 61.2% of MPSS tags lie above this thresh-old. In both the organisms, the mean intensity percentile of a collection of probes from regions that are chosen ran-domly would be 50. Thus, although a simple intersection of transcripts obtained from the MPSS platform and genome tiling microarray did not show a great overlap, we were able to demonstrate that ~62% of these MPSS tags in both Arabidopsis and rice are in fact enriched for higher intensity on the tiling array. This observation holds good
all tags as described above.
MPSS tag abundance measure and tiling array intensity are not correlated
We used the mean intensity percentile for each of the MPSS tags described above to see how well this measure of hybridization correlates with the abundance measure-ment of the respective tags obtained from the MPSS exper-iments. There are 17 libraries in Arabidopsis and 22 libraries in rice with an abundance measurement for all the reliable MPSS tags. In order to be conservative we con-sidered only tags that map to a unique genomic location. We performed regression of the log2 transformed abun-dance values against the intensity percentile for unique MPSS tags in both rice (Additional File 4) and Arabidopsis (Additional File 5) and observed that the two measures of transcript levels are not correlated. This observation was consistent when we calculated the regression for individ-ual libraries, pooled libraries and also for MPSS tags that overlap with tiling array TARs from the two species. The correlation coefficient for the pooled 17 libraries in Arabi-dopsis was 0.27 (range, 0.15–0.42) and 0.13 for MPSS tags that overlap with TARs. For rice, the correlation coefficient for the pooled 22 libraries was 0.25 (range, 0.13–0.26) and 0.13 for tags that overlap TARs.
Conclusion
Our approach presents a novel way of looking at these two different types of data. While an overlap from a naïve comparison of identified transcripts between these two technologies is not as high as one would have expected, it is not altogether surprising. The transcriptionally active regions identified on the tiling array are obtained after processing the intensities from the probes. During this process, we actually convert continuous-value probe intensity values into discrete genomic regions (TARs). The sequencing data is already discrete, represented by the 17 bp tag that maps to a genomic location. Facilitating such a comparison by mapping tags to probe intensities directly, however, does improve the correlation between the two technologies significantly. We believe our approach is general purpose and should work on next generation sequencing data.
Distribution of intensities for all MPSS tags in Arabidopsis and rice
Figure 2
Distribution of intensities for all MPSS tags in Arabidopsis and rice. The 128,337 reliable MPSS tags in Arabidopsis were mapped to the probes on the tiling microarray. For each tag, we calculated the mean intensity, after converting the raw inten-sities into percentiles, from probes that lie within the start and end coordinates of an MPSS tag. Since MPSS tags are only 17 nt in length, we considered flanks of increasing nucleotide lengths, viz, 25, 50, 75 and 100. Along with the MPSS tag, these flanks translate to, on average, 2, 3, 5 and 6 probes, respectively. These regions correspond to, 67, 117, 167 and 217 bp in length, respectively, on the tile path. The plot in Figure 2A shows the percentage of MPSS tags for different bins of percentiles. A sim-ilar procedure was followed for calculating intensities for the 100,274 reliable MPSS tags in rice. The distribution of intensities for rice is shown in Figure 2B.
0 5 10 15 20 25
10 20 30 40 50 60 70 80 90 100 Percentile
Pe
rc
e
n
ta
g
e
Random 217bp, ~6 probes 167bp, ~5 probes 117bp, ~3 probes 67bp, ~2 probes Exons
A
0 5 10 15 20 25 30 35 40
10 20 30 40 50 60 70 80 90 100
Percentile
Pe
rc
e
n
ta
g
e
Random 217bp, ~6 probes 167bp, ~5 probes 117bp, ~3 probes 67bp, ~2 probes Exons
and its corresponding annotation of the rice genome became available in January 2005 [3]. Unlike the current genome build of Arabidopsis which is relatively stable, there have been significant changes across the various rice genome builds. The consequence is that there are several gaps on the tile path and further, a small but significant percentage of the probes, were lost, shuffled, map to mul-tiple locations on the genome, or overlap existing probes. These factors are likely to affect the accurate detection of transcripts in rice and are likely to affect transcript cover-age. The design of tiling arrays brings in issues that have implications on transcript coverage. Excluding repetitive DNA elements and other non-unique sequences is an important step when selecting sequences to be repre-sented on a tiling array. As sequence tiles increase in size, the sequence fragmentation introduced by repetitive ele-ments reduces the coverage of non-repetitive DNA [4,5]. Thus, tiling arrays are likely to miss transcripts that arise from regions of the chromosome that contain repetitive DNA and non-repetitive regions that are missed by the algorithm. In addition, transcript boundaries from processing tiling array data are currently assigned based on the start and end coordinates of probes represented on the array rather than the actual transcript boundaries.
The differences in transcript detection cannot be entirely attributed to the two technologies per se. The biological samples used in the four experiments (two tiling array and two MPSS sequencing) are processed in different labora-tories and there is some overlap in the type of libraries used for RNA preparation. However, the precise effect of the differences due to the nature of biological sample var-iation on differential expression is difficult to delineate for the following reasons. For the Arabidopsis tiling array experiment, mRNA was extracted from T87 cultured cell line; the MPSS tags were obtained by a different group from sequencing 17 libraries constructed using mRNA from diverse tissues, mutants and treatments and does not include the T87 cultured cell line. For the Rice tiling array experiment RNA preparation involved pooled mRNA (not individual libraries) extracted from seedling root, seedling shoot, panicle and suspension-cultured cells. MPSS tran-scripts for the Rice experiment were obtained from sequencing 22 poly-adenylated mRNA libraries (see refer-ences in Additional File 1). These include libraries from 12 different untreated tissues and six abiotic stress treat-ments. Thus, the lack of matching tiling array data for the corresponding libraries used in the MPSS experiment makes it difficult to address how well the two methods compare with respect to differential expression.
Competing interests
The authors declare that they have no competing interests.
RS formulated the project, RS processed and analyzed the data and wrote the paper; AA did some of the annotation comparison; AA, JR and MG provided valuable comments for the project. All authors read and approved the final manuscript.
Additional material
Additional file 1
Materials and methods. This file describes the processing of tiling array and MPSS datasets for Arabidopsis and Rice. The file can be opened using Microsoft Word.
Click here for file
[http://www.biomedcentral.com/content/supplementary/1756-0500-2-150-S1.doc]
Additional file 2
Comparison of gene structures identified from MPSS and tiling micro-array data for Arabidopsis and rice. This file describes the methods used to identify the number of transcribed protein-coding gene loci from tiling array and MPSS datasets for Arabidopsis and Rice. The file can be opened using Microsoft Word.
Click here for file
[http://www.biomedcentral.com/content/supplementary/1756-0500-2-150-S2.doc]
Additional file 3
Distribution of intensities for unique MPSS tags for Arabidopsis and rice. Panel A shows the distribution of intensities for 118,801 unique MPSS tags in Arabidopsis and Panel B shows the distribution of intensi-ties for 68,413 unique MPSS tags in rice. The file can be opened using Adobe Acrobat Reader.
Click here for file
[http://www.biomedcentral.com/content/supplementary/1756-0500-2-150-S3.pdf]
Additional file 4
Correlation of transcript abundance from MPSS data and intensity from tiling microarray data for Rice. This file provides regression plots of log2 transformed abundance measure for MPSS tags against mean intensity percentile of MPSS tags calculated from tiling array data for the 22 libraries in rice. The name of the library and the correlation coefficient are given in the top right corner for each plot. The file can be opened using Microsoft Word.
Click here for file
[http://www.biomedcentral.com/content/supplementary/1756-0500-2-150-S4.doc]
Additional file 5
Correlation of transcript abundance from MPSS data and intensity from tiling microarray data for Arabidopsis. This file provides regres-sion plots of log2 transformed abundance measure for MPSS tags against mean intensity percentile of MPSS tags calculated from tiling array data for the 17 libraries in Arabidopsis. The name of the library and the corre-lation coefficient are given in the top right corner for each plot. The file can be opened using Microsoft Word.
Click here for file
Publish with BioMed Central and every scientist can read your work free of charge "BioMed Central will be the most significant development for disseminating the results of biomedical researc h in our lifetime."
Sir Paul Nurse, Cancer Research UK
Your research papers will be:
available free of charge to the entire biomedical community
peer reviewed and published immediately upon acceptance
cited in PubMed and archived on PubMed Central
yours — you keep the copyright
Submit your manuscript here:
http://www.biomedcentral.com/info/publishing_adv.asp
BioMedcentral
Acknowledgements
We thank Nick Carriero and Yale University Life Sciences Computing Center (NIH grant: RR 19895) for help with job submission on the Yale High Performance Cluster.
References
1. Mattick JS, Makunin IV: Non-coding RNA. Hum Mol Genet 2006,
15(Spec No 1):R17-29.
2. Li L, Wang X, Sasidharan R, Stolc V, Deng W, He H, Korbel J, Chen X, Tongprasit W, Ronald P, et al.: Global identification and char-acterization of transcriptionally active regions in the rice genome. PLoS ONE 2007, 2(3):e294.
3. The map-based sequence of the rice genome. Nature 2005,
436(7052):793-800.
4. Graf S, Nielsen FG, Kurtz S, Huynen MA, Birney E, Stunnenberg H, Flicek P: Optimized design and assessment of whole genome tiling arrays. Bioinformatics 2007, 23(13):i195-204.
5. Bertone P, Trifonov V, Rozowsky JS, Schubert F, Emanuelsson O, Karro J, Kao MY, Snyder M, Gerstein M: Design optimization methods for genomic DNA tiling arrays. Genome Res 2006,