1
Peer-reviewed, accepted author manuscript: Journal of Loss Prevention in the Process Industries 45 (2017) 133-146
Experiments and transient simulation on spring-loaded pressure
relief valve under high temperature and high pressure steam
conditions
Liu Yang
1, Zhoujie Wang
1, 2, William Dempster
3, Xinhai Yu
1, *, Shan-Tung Tu
11 Key Laboratory of Pressure Systems and Safety (MOE), School of Mechanical Engineering, East China
University of Science and Technology, Shanghai 200237, China
b Shanghai Power Equipment Research Institute (SPERI), Shanghai 200240, China
c Department of Mechanical and Aerospace Engineering, University of Strathclyde, Glasgow, United Kingdom
A b s t r a c t
Reliable performances of high temperature and high pressure operating steam pressure relief valves (HTHP PRVs) are extremely important for the safety of nuclear power plants. It is still a challenge to accurately describe the dynamic performance of HTHP PRVs. In this study, the accuracy of computational fluid dynamics (CFD) based modelling of the transient processes is examined. For one of the HTHP PRVs named DWPRV, the effects of different parameters on the dynamic performance were investigated by combining CFD simulation and experiments. In the simulation, the domain decomposition method (DDM) and the Grid Pre-deformation Method (GPM) were adopted to handle the moving disk geometry and the large mesh deformation. The effect of damping was also studied. It is confirmed that the use of CFD simulation can improve the design and settings of a HTHP PRV in a highly energetic service that is difficult to test due to safety reasons. For the DWPRV, it was found that the maximum flow rate occurs when the curtain area is 1.18 times the throat area. The degree of superheat ranging from 0 C to 100 C has a negligible effect on the performance of DWPRV regardless of the changes in the material mechanical properties with operating temperatures. The reseating pressure increases linearly with the rise in the distance between the upper adjusting ring and the sealing face. The lower adjusting ring exhibits a weak effect on the reseating pressure. For the ratios of rated lift to throat diameter equalling to 0.3 and 0.35, the DWPRV exhibits the higher blowdown for the ratio of 0.35.
1. Introduction
A pressure relief valve (PRV) is a significant safety accessory ofpressure loaded installations. For nuclear or thermal power plants, PRVs act as the last passive protectors for the safety of the plant. It has been widely accepted that the reliable performance of a PRV is extremely important since its role in the nuclear leakage accident of Three Mile Island Nuclear Power Station in USA when the failure to close resulted in reactor core degradation. That accident is mainly attributed to a failure of one PRV (Rogovin, 1979). The safety of nuclear power plants is the focus worldwide considering that nuclear energy is one of the feasible solutions to replacing fossil fuels and the reduction of CO2. However, even though safety valves could be considered as a mature technology, ensuring reliability is still an area of concern. Since the performance of safety valves is related to their dynamic response the recent improvements in computational fluid dynamics (CFD) based simulation for fluid structure interaction techniques hold the promise of direct simulation of the processes and a better understanding of how safety valves behave under real conditions. This paper addresses the development of CFD techniques and their application to safety valve simulation by presenting the results of a study to establish the accuracy of such techniques by comparison with blowdown data and measurement of the valve response. In practice, the requirement of safety valves to open and close at preset pressures is a challenging design task. For example, ASME I type valves can be required to open with 3% of set pressure and close within 4% of set pressure. This is commonly achieved by nozzle rings to control the flow path and pressure forces on the valve disk and established by trial and error on a test bench. Alternatively, CFD techniques have the potential for accurately determining these characteristics and help inform designers of appropriate disk and nozzle geometries and spring selection.
this paper a number of challenges are investigated. We build upon the developments of Song et al. (2014). and show the accuracy of transient CFD approaches to predict the dynamic response of the valve under high pressure and temperature opening and closure conditions. To address this challenge, an experimental arrangement was established for the testing of HTHP PRVs in accordance with the ASME PTC 25 standard. The dynamic performance of the HTHP PRVs was recorded. For the transient simulation of the HTHP PRVs, the Grid Pre-deformation Method (GPM) was adopted to handle the complex shape of the flexible disk and the large mesh deformation that occurs when the disk is moving. Furthermore, we also investigate the influence of modelling the exit boundary condition. It is common to place an atmospheric boundary condition at the valve flange exit. However, in this study the external atmosphere is also modelled to capture aspects of the surrounding flow field as the flow exits the valve as a jet. The opportunity is also taken to show the value of the simulation technique to valve design and operation by investigating the effects of controlling parameters on the dynamic performance of HTHP PRVs, i.e., fluid properties, superheat temperature, adjusting ring position, and rated lift.
2. Experimental facility and testing
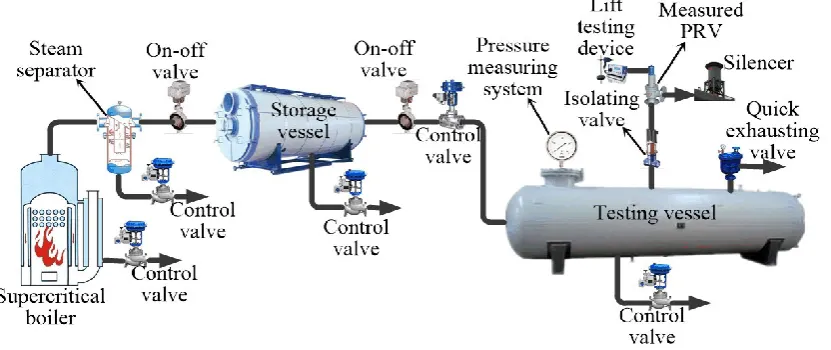
[image:3.595.76.492.517.692.2]In this study, a HTHP PRV was provided by Wujiang Dongwu Machinery Co. Ltd, China. The set pressure, rated lift, throat size are 12.22 MPa, 22.5 mm, and 57.8 mm, respectively. Hereafter, this PRV is specifically referred to as DWPRV. Fig. 1 shows the experimental setup of the PRV performance testing. The test system arrangement and test procedure are in accordance with the ASME PTC 25 standard.
Fig.1.HTHP PRV experimental setup
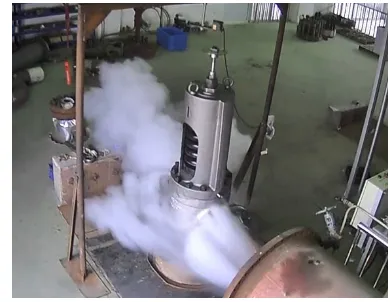
test vessel were slowly increased to 90% of the expected set pressure of the PRV. Then, the increase in the pressure of the test vessel was carefully controlled below 13,800 Pa s_1 until the PRV popped by introducing a flow rate of steam from the storage vessel into the test vessel. The lift of the tested PRV, the pressure of the test vessel, and the pertinent characteristics of the tested PRV were observed and recorded. The measurement accuracies of pressure transmitter (BP201/501Z, Hefei Sentech Sensing instruments Co. Ltd.) and displacement transducer (ZS-LD200, OMRON) are ±0.5% and ±0.2%, respectively. The PLC (S7-300, Siemens) collected the data and its time resolution of the data acquisition is 10 ms which was checked by the high speed camera (Motion Xtra N4, IDT). Fig. 2 shows a sectioned 3-D model of the DWPRV studied in this research. Fig. 3 is a photograph of the DWPRV at a fully open condition during the performance testing. A silencer was connected to the outlet of the DWPRV to lower the discharge noise and to ensure a desirably low back pressure.
Fig. 2. Schematic representation of HTHP PRV Fig. 3. Photo of a HTHP PRV at full open during performance test
3. Simulation analysis
The simulation was carried out using the commercial software ANSYS CFX 14.0 (ANSYS, 2011). To model the low, the High Resolution, Second Order Backward Euler and High Resolution options were used in the advection scheme, transient scheme and Turbulence numerics, respectively. Standard wall functions were used toremove the need to grid the boundary layer. In this simulation, a half-symmetrical model was used to reduce the computation time. The SST turbulence model was adopted for turbulence closure in accordance with the study by Moncalvo et al. (2009). The volume of the inlet vessel was 10 m3 which was equal to the value of the test
where mspring, mspindle, mdisk-holder, mdisk, mbearing and mbearing-seating are the masses of the spring, spindle, disk holder,
disk, bearing and bearing seating, respectively; ÿ is the acceleration of the moving part in the moving direction; ẏ is the disk velocity; Fflow is the force applied by flowing fluid; Fspring is the spring force acting on the disk; x is
the damping coefficient. The ÿ in Eq. (1) can be discretized into discrete difference form:
where Dt is the time step defined in CFX. The velocity ẏ can be further discretized as:
The lift of the disk yt also appears in the expression for spring force:
where F0 and F0.5 can be written as:
where kspring is the stiffness of spring; F0 is the force applied by the steam on the disk at the set pressure; Dy0 is
the spring initial compression. The value of 0.5 is the initial lift to establish a continuous flow field at the first calculation step. The discrete form of the motion equation is re-assembled, and the disk displacement is finally isolated as:
Since ANSYS CFX cannot read and execute Eq. (9) directly, the CFX expression language (CEL) was used to solve and couple Eqs.(1)-(9) for the CFD simulation (Song et al., 2010). The source code manipulation to the CEL can be found in Table S1 of supplementary materials.
3.2. Domain decomposition and grid generation
Fig. 4. Position relationship of each domain.
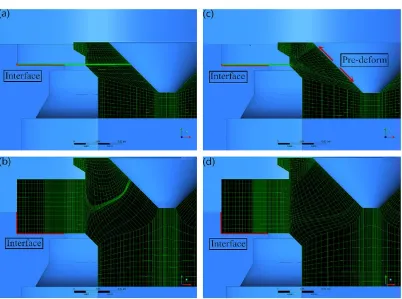
Fig. 5. Initial and deformed meshes by different mesh generation methods: (a) initial mesh using DDM; (b) deformed mesh at the rated lift of 22.5 mm using DDM; (c) initial mesh using DDM and GPM; (d) deformed mesh at the rated lift of 22.5 mm using DDM and GPM
[image:6.595.75.513.75.333.2]3.3. Boundary conditions
[image:6.595.99.502.362.661.2]of the other domains were set to be 0 MPa. The external domain boundary pressures were defined as 0 MPa and an open boundary condition.
3.4. Mesh independence
The impact of mesh fineness was investigated by determining the lifting force of the PRV, which has a
significant influence on the dynamic performance of the disk and the whole simulation accuracy. To
reduce computational time, the investigation was carried out for the first 50 ms of the whole dynamic
performance since the valve was fully open by this time and the maximum flow reached. Three mesh
densities have been generated and the number of elements are 0.5 million (coarse),1 million (fine)
and 1.5 million (fine) respectively. The calculation was terminated only when the residual root mean
square (RMS) error values were strictly below10
-5. The results of a grid independence study indicated
that there is no obvious difference in the lifting force between fine and very fine model, but it is
different from the coarse one. This indicates that the calculation of the lifting force is relatively
independent for the fine and very fine models. To minimise computation time, the fine mesh density
(1 million elements) was chosen for this transient study.
3.5. Variable time steps
A PRV commonly undergoes three stages in the dynamic process: rapid open, stable discharge, and
re-closing. The three stages have different durations. Hence, to optimize the computational time and
to ensure convergence, a variable time step (altogether five time steps) was used during the different
stages. The five time steps were determined by several repeated attempts to avoid the interruption
of calculation and to save the computation time. A time step of 5 ms was chosen in the first 1 ms (200
steps), which was set to ensure calculation convergence. When the disk began to rise, a slightly larger
time step of 50 ms was used, which could simulate the opening process (50 ms) sufficiently. When the
disk achieved its rated lift, a large time step of 0.5 ms was used. A smaller time step of 0.1 ms was
used to capture the disk movement and fluid field during the closure process accurately. At last, a time
step of 50ms was used to ensure the disk could completely reseat.
4. Results and discussions
4.1. Performance of DWPRV
Given the existence of critical flow at the outlet of the DWPRV, the definition of the pressure at the
DWPRV outlet during simulation is difficult. Therefore, in our study, the discharge flow into the
surroundings was modeled explicitly to avoid the direct definition of the pressure at the DWPRV flange
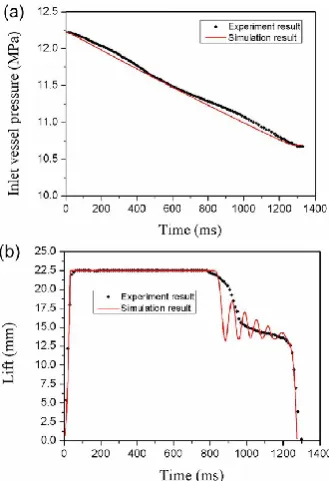
outlet. The inlet vessel pressure as a function of discharge time of the DWPRV is illustrated in Fig. 6(a).
The inlet vessel pressure decreases continuously with the discharge from the DWPRV. The reseating
pressure, blowdown, and discharge time are 10.695 MPa, 12.480%, and approximately 1276 ms,
respectively.
Fig. 6. The inlet vessel pressure (a) and lift (b) as a function of discharge time of DWPRV (kspring = 743Nm-1; throat size of 57.8 mm in diameter; the distance between the lower adjusting ring and the sealing face (h1) is 2.2 mm; dry saturated steam; the distance between the upper adjusting ring and the sealing face (h2) is 8.7 mm above the sealing surface).
The lift of the DWPRV as a function of discharge time is illustrated in Fig. 6(b). The DWPRV achieves full opening at around 32 ms. The valve remains open until 810 ms but incurs fluttering with five cycles. This fluttering was not detected in the corresponding experiment. For a PRV, the friction between disk holder and disk guide acts as damping, thus weakening disk fluttering. In the above simulation, the friction was neglected (ξ = 0). To study the effect of the damping on disk fluttering, variations in the damping coefficient, ξ values ranging from 3000 to 9000 N s m-1 was investigated. The results are shown in Fig. 8 and Table 3. When ξ increases from 3000 to 9000
N s m-1, the fluttering gradually disappears and the popping time increases from 38 to 54 ms which is close to
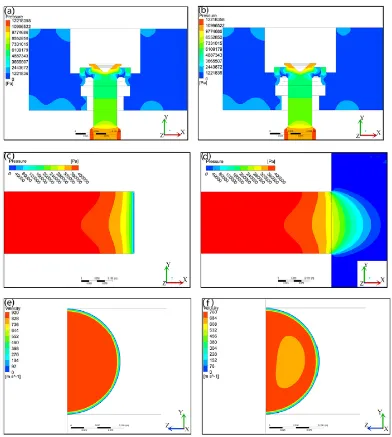
Fig. 7. Influence of the outlet vessel on the pressure and velocity contours (kspring = 743 N mm-1; throat size of 57.8 mm in diameter; h1 = 2.2 mm; h2 =8.7 mm; dry saturated steam; t = 50 ms: pressure contours around the disk without (a) and with (b) outlet vessel; pressure contours at the PRV outlet without (c) and with (d) outlet vessel; velocity contours at the PRV outlet without (e) and with (f) outlet vessel.
While the modelling of the external environment has little impact on the valve dynamics for this case, its inclusion would be necessary to more accurately calculate the noise and the flow force at the outlet when the PRV is discharging because the discharging noise and flow force at the outlet depend on the velocity at the outlet.
Fig. 8. The lift (a) and inlet vessel pressure (b) as a function of discharge time of DWPRV with different damping coefficient (kspring =743 N mm-1; throat size of 57.8 mm in diameter; h1 = 2.2 mm; h2 = 8.7 mm).
The Mach number profiles inside the DWPRV at various discharge times are shown in Fig. 10. At the discharge time of 5 ms (corresponding to the lift of 0.98 mm), the Mach number at the throat is 0.058. The maximum velocity (Mach number = 3.30) appears at the gap between the disk holder and the lower adjusting ring. When the discharge time increases to 20 ms, the Mach number at the throat is 0.436. The maximum velocity still exists at the gap between disk holder and lower adjusting ring and the corresponding Mach number decreases to 2.83. At 23.6 ms, the throat area is equal to the curtain area and the Mach number at the throat is 0.661. In this case, a new high Mach number zone (Mach number =2.22) emerges at the gap between the upper and lower adjusting rings beside the high Mach number zone at the gap between the disk holder and the lower adjusting ring. At 25.8 ms, the throat area is 1.18 times that of the throat area and the Mach number at the throat is 0.878. The flow rate achieves the highest value. At 27.8 ms, the Mach number at the throat achieves 1 (corresponding to the lift of 16.9 mm). The fully open condition (lift =22.5 mm) is obtained at 32 ms when a third high Mach number zone occurs at the nozzle outlet. At 1274 ms, the DWPRV experiences reseating and the velocity at the throat decreases to a Mach number of 0.029, coinciding with a single high Mach number zone at the gap between the disk holder and the lower adjustingring. The mass flow rate as a function of the ratio of curtain area to throat area is illustrated in Fig.11. The mass flow rate increases from 1.64 to 37.2 kg s-1 with the increase in the ratio of
[image:11.595.169.444.326.686.2]curtain area to throat area from 0.0425 to 1.18, and then levels off. That is, the maximum mass flow rate emerges at the ratio (curtain area to throat area) of 1.18 not 1 for the DWPRV. This is of practical relevance since a ratio of 1 is often taken as the theoretical fully open and maximum flow condition in design studies. The multidimensional nature of flow in this valve determines that further opening is required before the choking location moves to the nozzle with implications for the valve spring specifications, as will be discussed later.
Fig. 11. Mass flow rate as a function of the ratio of curtain area to throat area for DWPRV (kspring = 743 Nmm-1; throat size of 57.8 mm in diameter; h1 = 2.2 mm; h2 = 8.7 mm; dry saturated steam).
4.2. Effect of fluid physical properties
Due to the difficulty of testing at real fluid conditions valves are often tested with high pressure, low temperature air and corrected for the real fluid conditions. Here we investigate the differences in valve response when using high pressure steam and air. This essentially investigates the effects of fluid properties on the DWPRV performance. Compressed air at room temperature was taken as the medium and the results were compared with that using dry saturated steam. As presented in Table 4, the reseating pressure of 11.071 MPa for the case using compressed air, which is higher than that of 10.695 MPa with dry saturated steam as the fluid. Therefore, the reseating pressure of the DWPRV is overestimated if compressed air is used as an alternative. When a HTHP PRV is used, this overestimation results in excessive steam discharge and an increase in the operation cost. In addition, the set pressure and simmer pressure usually decrease with the increase in medium temperature.
Our experimental results indicate the set pressure for the DWPRV using compressed air is 1.01-1.02 times that of the DWPRV using dry saturated steam. This is partly because the PRV material mechanical properties and seat geometry change at high temperature.
4.3. Effect of upper and lower adjusting rings
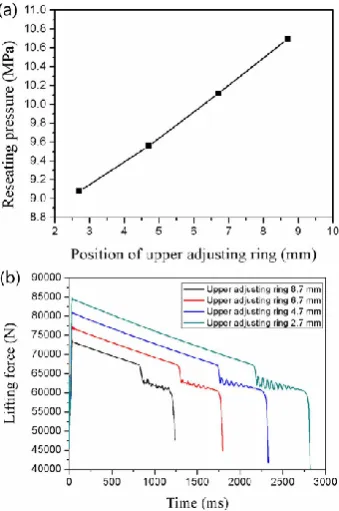
For HTHP PRVs, blowdown can be adjusted by changing the position of the adjusting ring (see Fig. 2). In a design context, it is desirable to accurately determine the position of the adjusting ring and how it influences valve opening and closing. So far, the desirable positions of the adjusting rings mostly depend on engineers' experience and repeated adjustments. As shown in Fig. 12(a), given the distance between the lower adjusting ring and the sealing face (h1, see Fig. 13) of 2.2 mm, a roughly linear increase in the reseating pressure can be
[image:13.595.184.354.196.452.2]observed for the DWPRV from 9.077 to 10.695 MPa with the rise in the distance between the upper adjusting ring and the sealing face (h2, see Fig. 13) from 2.7 to 8.7 mm.
Fig. 12. Reseating pressure as a function of the position of upper adjusting ring (a) and fluid force acting on disk in the y-direction (b). (kspring =743 Nmm_1; throat size of 57.8 mm in diameter; h1 = 2.2 mm; dry saturated steam).
Fig. 13. Comparison of adjusting ring positions
[image:13.595.181.387.510.677.2]different positions of the upper adjusting ring. When h2 = 2.7 mm, both the steam pressure along the disk wall
and the velocity along the y axis at the gap between the upper and lower adjusting rings are higher than those of h2 = 8.7 mm, thus leading to the larger lifting force for the case of h2= 2.7 mm because the lifting force is the
sum of local pressure and shear force. In contrast to the upper adjusting ring, the lower adjusting ring has a weak effect on the reseating pressure. Given h2 = 8.7 mm, the reseating pressure of the DWPRV slightly decreases
from 10.695 to 10.672 MPa with the rise in h1 from 2.2 to 4.2 mm. The blowdown increases from 12.480% to
[image:14.595.119.447.258.712.2]12.668% accordingly. For the DWPRV, the upper adjusting ring alters the geometry of the flow field and the direction of fluid flow significantly. In contrast, the lower adjusting ring only alters the size of the channel between the disk and lower adjusting ring. The change in the direction of fluid flow inside the channel is negligible. Compared with the lower adjusting ring, the upper adjusting ring exhibits a high amount of change in the lifting force due to the alteration in the fluid flow direction. Therefore, the upper adjusting ring plays a more important role in adjusting blowdown than the lower adjusting ring. It should be noted that this tendency is related to this specific PRV geometry and the validation for alternative designs of HTHP PRVs needs further studies.
4.4. Effect of the rated lift
For the design of a HTHP PRV, the input data are set pressure,reseating pressure and rated flow capacity. The throat diameter can be firstly determined in accordance with API Standard 520. Then, the rated lift (lift rated) is usually calculated by 0.25-0.35 times the diameter of throat. The value of 0.25-0.35 suggests that the ratio of curtain area to throat area exceeds 1. However, for the DWPRV, the curtain area should exceed the value of 1.18 times the throat area (the corresponding ratio of lift rated to the diameter of throat is 0.295) which guarantees the maximum flow rate can be achieved (see Fig. 11). That is, the usually used value of 0.25-0.35 is not applicable to DWPRV. The maximum stiffness (kmax) of the spring can be calculated in accordance with Eq. (10)
(Kondratyeva, 1976).
where Fflow, rated lift is the lifting force when the PRV reaches the rated lift; pset is the set pressure; Dm is the
average diameter of the sealing face. The effect of the rated lift on the performance of the DWPRV was investigated with various rated lift values of 17.5 and 20.5 mm corresponding to the ratios of rated lift to throat diameter of 0.3 and 0.35, respectively. Accordingly, kmax is calculated to be 1099 and 1004 N mm_1, respectively,
[image:15.595.126.464.335.575.2]according to Eq. (10).
Fig. 15. The lift (a) and inlet vessel pressure (b) as a function of discharge time of the DWPRV; the lift as a function of discharge time of the DWPRV in the first 40 s (c). (throat size of 57.8 mm in diameter; h1 = 2.2 mm; h2 = 8.7 mm; dry saturated steam).
As demonstrated in Fig. 15(a), for the cases of the rated lifts of 17.5 and 20.5 mm, fluttering can be observed with a quick reseating. The blowdown values for lift rated = 17.5 and 20.5 mm are 5.92% and 7.64%, respectively. For HTHP PRVs, the blowdown is usually in the range of 2-7.5% according to API Standard 520. Given that the actual stiffness of the spring is lower than kmax, the actual blowdown for the DWPRV with the rated lift of 20.5
mm is higher than 7.64%. Although the position of the upper adjusting ring can be changed to decrease the blowdown so that the higher limit value of 7.5% required by API Standard 520 can be met for a Rated Lift = 20.5 mm, the lower rated lift of 17.5 mm than 20.5 mm suggests a smaller PRV volume and consequently lower fabrication cost. For the rated lifts of 17.5 mm, the effect of the spring stiffness on the performance of the DWPRV was studied. The spring stiffness decreases from a kmax of 1099 to 934 N mm-1 (85% of kmax) and the
the reseating time increases from 612 to 904 ms and the reseating pressure decreases from 11.50 to 11.13 MPa. Accordingly, the popping time decreases from 34 to 31 ms (see Fig. 15(c)). Therefore, the decrease in the spring stiffness effectively reduces the reseating pressure and exhibits a slight influence on the popping time.
5. Conclusion
This study shows that the dynamics of a safety valve during opening and closing can be effectively simulated using CFD techniques by combination of DDM and GPM methods. It is confirmed that the use of CFD simulation can improve the design and settings of a PRV in a highly energetic service that is difficult to test due to safety reasons. CFD simulations can increase safety by reducing the amounts of bench testing needed to set the adjusting rings. For dangerous cases such as HTHP steam, this is critical to ensure safety. A comparison with experimental data shows that the model can predict accurately and in detail the multi-dimensional aspects of the flow and disk motion. However, accurate determination of the damping caused by the friction between the disk holder and the disk guide is necessary to predict fluttering of the disk. Fortunately for the conditions examined, fluttering and its associated damping exhibit only slight influences on the blowdown. A general investigation of the valve operating characteristics reveals that the maximum mass flow rate occurs at the ratio (curtain area to throat area) of 1.18 for the DWPRV. The reseating pressure of the DWPRV is overestimated if compressed air is used as an alternative. The degree of superheat ranging from 0 C to 100 C has a negligible effect on the dynamic performance of DWPRV regardless of the changes in the material mechanical properties with operating temperatures. A roughly linear increase in the reseating pressure can be observed for a DWPRV with the rise in h2, the upper adjusting ring position. In contrast, the reseating pressure slightly decreases with
the rise in h1, the lower adjusting ring position. This difference is because the upper adjusting ring can significantly change the steam lifting force by an obvious alteration in the fluid flow direction. For the ratios of rated lift to throat diameter equal to 0.3 and 0.35, the DWPRV exhibits the higher blowdown for the ratio of 0.35. The decrease in the spring stiffness effectively reduces the reseating pressure and exhibits a slight influence on the popping time.
Acknowledgements
This study was financially supported by the China Natural Science Foundation (Contract No. 21176069, 21476073) and the Fundamental Research Funds for the Central Universities (WG1213011).
References
Aldeeb, A.A., Darby, R., Arndt, S., 2014. The dynamic response of pressure relief valves in vapor or gas service. Part II: experimental investigation [J]. J. Loss Prev. Process Industries 31, 127-132. ANSYS, Inc, 2011. ANSYS CFX Reference Guide for Release 14.0. ANSYS, Inc.
Betts, P.L., Francis, J., 1997. Pressures beneath the disc of a compensated pressure relief valve for gas/vapour service [J]. Proc. Institution Mech. Eng. Part E J. Process Mech. Eng. 211, 285-289.
Beune, A., Kuerten, J.G.M., van Heumen, M.P.C., 2012. CFD analysis with fluid structure interaction of opening high-pressure safety valves [J]. Comput. Fluids 64, 108-116.
Carneiro, L.M., Pires, L.F.G., Cruz, M.D.S., Azevedo, L.F.A., 2012. Dynamic behavior of spring-loaded pressure relief valve: numerical and experimental Analysis[C]. 2012 9th international pipeline conference. Am. Soc. Mech. Eng. 553-561.
Darby, R., 2013. The dynamic response of pressure relief valves in vapor or gas service, part I: mathematical model [J]. J. Loss Prev. Process Industries 26,1262-1268.
Darby, R., Aldeeb, A.A., 2014. The dynamic response of pressure relief valves in vapor or gas service. Part III: model validation [J]. J. Loss Prev. Process Industries 31, 133-141.
Francis, J., Betts, P.L., 1997. Modelling incompressible flow in a pressure relief valve [J]. Proc. Institution Mech. Eng. Part E J. Process Mech. Eng. 211, 83-93.
Hos, C.J., Champneys, A.R., Paul, K., McNeely, M., 2014. Dynamic behavior of direct spring loaded pressure relief valves in gas service: model development, measurements and instability mechanisms [J]. J. Loss Prev. Process Industries 31,70-81.
Kim, H.D., Lee, J.H., Park, K.A., 2006. A study of the gas flow through a LNG safety valve [J]. J. Therm. Sci. 15, 355-360.
Kondratyeva, T.F., 1976. Safety Valve [M]. Mechanical Engineering, Leningrad department, Leningrad (in Russian).
Kourakos, V., Rambaud, P., Buchlin, J.M., Chabane, S., 2013. Flow force in a safety relief valve under incompressible, compressible, and two-phase flow conditions (PVP-2011-57896) [J]. J. Press. Vessel Technol. 135, 244-252.
Moncalvo, D., Friedel, L., J€orgensen, B., H€ohne, T., 2009. Sizing of safety valves using ANSYS CFX-Flo®[J]. Chem. Eng. Technol. 32, 247-251.
Narabayashi, T., Nagasaka, H., Niwano, M., Ohtsuki, Y., 1986. Safety relief valve performance for two-phase flow[J]. J. Nucl. Sci. Technol. 23, 197-213.
Ray, A., 1978. Dynamic modeling and simulation of a relief valve [J]. Simulation 31, 167-172.
Rogovin, M., 1979. Three Mile Island: A report to the commissioners and to the public [R]. Nuclear Regulatory Commission, Washington, DC (USA).
Sallet, D.W., 1984. Thermal hydraulics of valves for nuclear applications [J]. Nucl. Sci.Eng. 88, 220-244.
Sallet, D.W., 1991. Critical mass flow rates through pressure relief valves [J]. Heat Mass Transf. 26, 315-321.