0022-538X/82/100107-09$02.00/0
CopyrightC)1982,AmericanSocietyforMicrobiology
Effect of
Simian Virus
40 on the
Temporal and Spatial
Organization
of DNA
Replication
in
Muntjac
Cells
BARBARA R.JASNY,1JANE-MARIEWRIGHT,2LAUREL A.SMITH,2 EDWARD L.GERSHEY,1 AND IGORTAMMl*
TheRockefellerUniversity,New York,NewYork 100211 andDepartment ofAppliedMathematics and Statistics, StateUniversity ofNew YorkatStonyBrook, StonyBrook,New York117942
Received 21September1981/Accepted22 June1982
Weexaminedtheeffects of simian virus 40 infectiononthetemporalandspatial
organization of initiation sites forDNAreplicationinMuntjaccellsbymeansof
lightmicroscopicDNAfiberautoradiography.Initiationatmultiplesitesalongthe
DNAfiberinvirus-infected confluentMuntjaccellswas morenearly synchronous
than in serum-deprived controls, althoughtemporal control in the infected cells
did not reachthe level observed in cells incubated in serum-enriched medium.
Initiation sitesinvirus-infectedcellsappearedtobespatiallyclosertogether than
in either uninfected serum-deprived or uninfected serum-enriched cells. This
change did notappeartobe the result of the induction orrepression by simian
virus 40 of clusters of replicationunits with new and different organizations.
Simian virus 40(SV40) infectioninduces DNA
synthesis in permissive and nonpermissive
mammalian cell systems (22, 24, 32, 44).
Ac-cording to several models for transformation,
SV40 alters the process ofinitiation of DNA
replication at multiple sites along the host cell
DNA fiber, and it has been proposed that T
antigen, which is required for the initiation of
each round of viral DNA synthesis (6, 33, 47), also acts as an initiatorofcellular DNA
synthe-sis (3, 36, 47). Evidence for the initiation of cellular DNAsynthesis byTantigencomesfrom
studiesoftemperature-sensitive earlySV40 mu-tants (6, 26, 47), and microinjection into
mam-maliancellsofRNAcomplementary to the early
SV40codingregion(19),early-codingviral DNA
sequences(38),orpurifiedTantigen(49). Alter-ations in the initiation process might affect the
synchrony ofevents in clusters ofreplication
units,thespatial organizationofactivated
initia-tion sites,orboth.
Verylittle information is availableconcerning
the effect of SV40 infection on the temporal
organization ofDNAreplication. SV40infection
doesnotchange the overall length of the S phase in Muntjac cells which are nonpermissive for SV40 and can be abortively transformed (17, 18), but in permissivecelllines of African green monkey origin, such as AGMK and CV1, cells appear to be arrested after oneround ofcellular
DNAsynthesis (16). Similarobservations have been madeby Lehmann et al. (34) and Hiscott and Defendi (25). No changes have been ob-servedin thetiming ofsatelliteDNA replication in mouse kidney cells infected with polyoma
virus (1, 23) or in thereplicationof component a DNAin primary African green monkey kidney
cells(AGMK) inducedby SV40(40).
Using DNA fiber autoradiography, Martin
and Oppenheim (37) observed thatforChinese
hamster lung cells, the geometric mean
inter-track distance is significantly shorter in
SV40-transformed cells than in nontransformed cells
in complete medium, but longer in
isoleucine-deprivedmedium. Similar results were obtained
with BALB/c 3T3 cells (39). It was suggested that Tantigen provides newanddifferent initia-tion sites. Kapp et al. (30) found a twofold
increase in replication unit size upon transfor-mation of normal and of Xeroderma pigmento-sumcellsofhumanoriginandofmouse3T3cells
by SV40. It is possible, however, that results obtained with SV40-transformed cells reflect
secondary changes occurring during the
estab-lishment ofa stable transformed state and are
not indicative of early events in the infection process.
Weused DNAfiber autoradiography to deter-mine whether SV40 infection affects the syn-chrony of the initiation process or the spatial organization of DNA replication in Muntjac cells. Wewereespeciallyinterested in the Munt-jac system because SV40 infection induces Muntjac DNA replication (17) and because of
thefindingthatTantigen binds nonuniformlyto
Muntjac chromosomes (8, 10). Moreover, the
absence of viral replication in these cells (18) simplifies the interpretation of results.We elect-ed toexamineDNAreplication24 hafter infec-tion rather than instably transformedcell lines
107
on November 10, 2019 by guest
http://jvi.asm.org/
in which a broad range of pleiotropic changes has already occurred.ToexamineDNA replica-tion that is predominantly SV40 induced, we infected confluent serum-deprived cells and as controls useduninfected cells deprivedof serum orincubated in 10% serum.
MATERIALSANDMETHODS
VirusandceUls. SV40 used in these experiments was strain VA4554, isolated and propagated as described by Diacumakos and Gershey (11). Muntjac cells are a fibroblastic strain derived from a male Indian deer, Muntiacus muntjak. They were obtained from the American Type Culture Collection, Rockville, Md. (ATCC157).The cells weremaintainedas logarithmi-cally growing monolayer cultures in Eagle minimum essential medium(MEM) supplemented with10% fetal bovine serum(FBS), potassium penicillin G(500,000 U/liter), streptomycin sulfate (100 mg/liter), and my-costatin (25,000U/liter)aspreviously described (9,10). Cell cultures were free of mycoplasma contamination onthe basis of fluorescencestaining(5) andscanning electronmicroscopy.
Serumdeprivation and infection. For each of three experiments, a separate ampoule of cells was thawed and passaged. Cells of equal populationdoubling lev-els were seeded intopetridishes of 100-mmdiameter atapproximately 7 x 10⁵ cells per dish. Each dish contained a section of a glass slide and two coverslips. Cells were allowed to grow until saturation density was reached, at which point thecellnumber nolonger increased,asdeterminedbycellcounts. Afterreaching confluence, the cultures were maintainedfor72 h in medium lacking FBS. The medium was changeddaily.
On day 3 of serum deprivation, one set of cell cultures wasinfected with SV40 in EagleMEMat a multiplicityof 200PFU/cellinavolume of1 ml/plate (virus infected). Another set ofcells,serumdeprived, wasmock infected withEagleMEM,and the remain-ing set received Eagle MEM containing 10% FBS (serum enriched). After incubation for 2 hat37°C,10 ml of medium per plate lacking FBS was added to serum-deprived and virus-infected cells. A 10-ml amountof mediumcontaining10%oFBSwasadded per plate of serum-enriched cells, and incubation was continued for 24 h. The coverslipswerethen removed and stained for Tantigen (seebelow).
Radioisotope labelingandlightmicroscopeDNAfiber autoradiography. At 24 h afterinfection, 5-fluoro-2'-deoxyuridine (FUdR)wasaddedtothe culture dishes toafinal concentration of 2,uM for 30 mintodeplete theintracellularthymidinepool, after whichcellswere labeled with [3H]thymidine (New England Nuclear Corp.; 50 to 56 Ci/mmol, 250 ,Ci/ml) for 10 min. Sufficient unlabeled thymidine was then added to lower the specific activity 10-fold. The glass slides wereremoved, washed four times in phosphate-buff-eredsaline(PBS), and fixed in 100% ethanol at-70°C. The cells in the petridishes wereincubated for3 more h, washed in PBS deficient in calcium and magnesium(PBS def;pH7.2),andremoved from the dishes bybriefexposuretotrypsin. Cellswerelysed with1%sodiumdodecylsulfate-0.01 MEDTAinPBS def and spread down glass slides. The DNA was
precipitated in 10%o trichloroacetic acid followed by
dehydrationingradedsolutions ofethanol (see refer-ence 23 fordetails). Slides with either spread DNA or labeled cells were dipped in melted Kodak NTB2 emulsion in total darkness. They were stored at-20°C for 6 months and developed in a 1:1 dilution of Kodak D19 developer. With this protocol, labeled nuclei in whole cellswere covered with grains and were easily recognizableover the background.
Tantigenstaining.SV40 T antigen was detected by means of indirect immunofluorescence staining (9). Cellsfixed on cover slips in absolute ethanol at -70°C at60 hafter infection were stained for 60 min at 37°C with hamsteranti-T serum (National Cancer Institute 79x-137) diluted 1:20 in PBS. The percentage of fluorescent nuclei remains essentially constant for the periodfrom 24 to 72 h afterinfection(18). The anti-T serumhad previously been adsorbed onsubconfluent monolayers ofMuntjac cells and clarified by centrifu-gation at 9,000xg. Cells were thenwashed with PBS and incubated for 60 min at 37°C with fluorescein isothiocyanate-conjugatedgoatanti-hamster immuno-globulin G (IgG) (Antibodies Inc., Davis, Calif.) dilut-ed 1:10 in PBS. Fluorescence wasdetected at a final magnification of 160x with an inverted microscope equippedforepifluorescenceexcitation at 495 nm and suppressionat 525 nm(Leitz).
Analysis ofautoradiograms. Inexamining autoradio-grams,fragments of the intact DNAfiber, which are defined as strands, are readily identifiable. Initiation sites are located within either prepulse or postpulse figures, which are recognized by the characteristic changes in grain density. A prepulse figure, which indicates the occurrence ofinitiation before the addi-tion of radioactive label, consists of a central gap bordered on either side by a length of high-specific-activity labeling (high grain density) in autoradio-grams. In postpulsefigures, acentral regionof high-specific-activity labeling is bordered on both sides by stretchesoflow-specific-activity labeling.
The calculation of initiation times from prepulse figureshas been describedfully (27).To summarize, therate of forkprogression wascalculated for each prepulsefigureasthe meanof thelengthsof the high-specific-activity-labeledhalves dividedbythe time of high-specific-activity labeling(10min). The mean dis-tance from the origin (taken as the center of the prepulse figure) to the two ends of theprepulse figure was divided by therateof forkprogression togenerate the time interval between initiation and the end of thehigh-specific-activity labeling.Thisinterval is de-fined as the initiation time.
The term interinitiation distance is definedas the distance betweentwoadjacentinitiationsites,with the location of a site taken as the centerof theprepulse or postpulse figure. For studies ofspatial organization, strands containing nine or more interinitiation dis-tances were selected. Thetheoretical basis for selec-tionof this lower limit has beenpreviously described (7). A total of 13 to 15strandswereselectedfor each experimentalvariable, pooledfrom threeexperiments. For the temporal organization studies, strands con-taining eighttonine interinitiation distances which had atleast twoprepulsefigureswereused. Measurements were made with an ocular micrometer at a final magnificationof640 x.There wasnosignificant differ-ence inmean strandlength among the experimental conditionsby Student'st test(0.4 <P< 0.5).
J. VIROL.
on November 10, 2019 by guest
http://jvi.asm.org/
I.... I
20 40 60 80 100 "I100
[image:3.496.51.244.59.238.2]IInitiation time-median initiation time (min.)I FIG. 1. Cumulative frequency of initiation times expressed as the absolute values of the numerical differences between the mediantime of initiationon a
strand and the time of initiation for each prepulse figureonthatstrand. Symbols: -, uninfected, se-rum enriched; ---, virus infected, serum deprived;
... uninfected, serum deprived. Frequencies were
plottedatthecenterof10-minintervals.
RESULTS
In Muntjac cells deprived ofserumfor 72 h and thenincubated in thepresenceofserumfor
24h, 35% of the nucleiwerelabeled after 10min
oflabelingwithhigh-specific-activity [3H]thymi-dine. The percentage of labeled nuclei was
re-duced 5.8-fold(to 6%)in cellsdeprivedofserum
for 96 h. The infectionof cells withSV40 result-ed in an 11.6-fold increase in DNA synthesis
(70% of nuclei were labeled) when compared with serum-deprived cells and a2-fold increase
whencompared with cells whichhadbeen incu-bated with serum (35% ofnuclei werelabeled).
Approximately 50% of the Muntjac cells
ex-posedtoSV40 containedTantigenasmonitored by immunofluorescence staining.
Temporal organization. Our hypothesis was
that SV40 infection altered the coordinate
con-troloverthetiming of initiationatsitesalong the DNA fiber. Asdescribedabove, it is possibleto calculate the time of initiation forprepulse
fig-ures relative to the end of the high-specific-activity labeling period. The numerical
differ-encesbetween themedian time of initiationon a
single strand and the time of initiation for each prepulse figure onthat strand were calculated.
Thefrequency distributions for these differences
areshowninFig. 1.Althoughitistrueunderall
three conditions that most of the initiations
occur at approximately the median times, it is apparent that in uninfected serum-deprived cells, there is a higher frequency of outlying
values. The distribution of initiations in the
virus-infected cells appears to occupy an inter-mediate position between those in serum-de-prived and serum-enriched cells. To determine the significance ofthesedifferences, the follow-ing approachwasused.The data are not normal-ly distributed; thus, a standard t test is not appropriate. Therefore, for each pair of varia-bles, we converted our data into the form of a two-sample quantile function (to be described below) and comparedthe datawith the Fourier transform that wouldbeobserved in the case of two identical distributions. This test was orig-inally describedby Parzen (41). It has the advan-tagesof making no assumptions concerning the distribution ofthe data(i.e., it doesnotrequirea normal distribution) and ofbeing very sensitive to differences in the frequencies in the tails of the distributions. Comparisons of data were made bymeansof thecomputer program TWO-SAM asdescribed by White (50).
The normalized initiation times were pooled for serum-deprived, serum-enriched, and
virus-
.00-
1.00-0.80
-
G60- 040- Q20-0.00
1.00-0.80
DO
(U)
060- 0.40-0.20-GOO
1.00. 0.80 0.60-0.40 0.20
^\ f%^
Serum-deprived
/, '
Serum-deprived
-' Serum-enriched
- --- Virus-infected
vs
Serum-enriched
U. L .
0.00 0.25 050 Q75 1.00
U
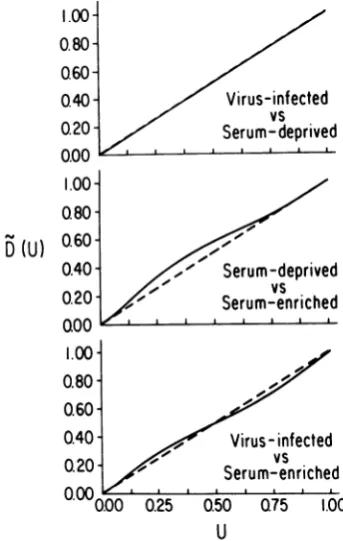
FIG. 2. Quantile analysis of initiation times: virus infectedversus serumdeprived, serumdeprived ver-sus serumenriched, and virusinfectedversus serum enriched. Theabscissarepresentsthe cumulative fre-quencies for individual initiationtimes in the second variable in each panel. The ordinate represents the cumulativefrequencies for initiationtimes in the first variable correspondingto the initiation times on the
abscissa. The dashed line is the theoretical curve of identity between thetwovariables.
100
e 80 C
M 60
40
0
E c 20
o
0
VOL.44,
I_
on November 10, 2019 by guest
http://jvi.asm.org/
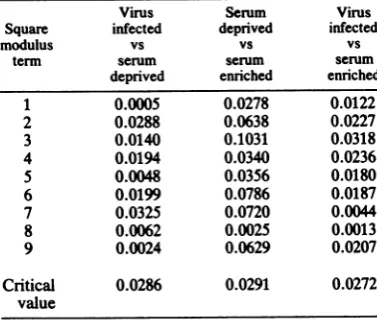
[image:3.496.261.433.315.586.2]TABLE 1. Squaremodulus ofFourier coefficients
Virus Serum Vims
Square infected deprived infected
modulus vs vs vs
term serum serum serum
deprived enriched enriched
1 0.0005 0.0278 0.0122
2 0.0288 0.0638 0.0227
3 0.0140 0.1031 0.0318
4 0.0194 0.0340 0.0236
5 0.0048 0.0356 0.0180
6 0.0199 0.0786 0.0187
7 0.0325 0.0720 0.0044
8 0.0062 0.0025 0.0013
9 0.0024 0.0629 0.0207
Critical 0.0286 0.0291 0.0272
value
infectedsamples. For any two sets, ifthe
distri-butions ofthenormalized initiationtimes are the
same, thenthe medians ofthe two sets should occur at approximately the same value. We
determined the quantiles of initiation timesand
compared them, two variables at a time. For
example, in serum-deprived cells, 95% of all
observations are at or below 20 min from the
median
[called D(U)].
The fractionof allserum-enriched initiationsbelow 20 is 0.90(called U).
The plot of
1(U)
versus Uforserum-deprivedversus serum-enriched initiations will pass
throughthepoint (0.95,0.90).TheplotsofD(U)
versus Uforeachpair of variablesare shown in
Fig. 2 and have been "smoothed" with an
autoregressive smoother(41).If the two samples
areidentical,D(U) versus Uwillrunfrom (0, 0)
to(1, 1) alongthe diagonal. Forareal sample,
some oscillation around the line would be
ex-pected, butthis shouldresemble Brownian
mo-tion, i.e., lack an obviouspattern of deviation.
Visually, it isapparent that the datafor
serum-deprived versus serum-enriched initiations do
notliealong thediagonal,whereas virus-infect-edversusserum-deprivedorvirus-infected
ver-sus serum-enriched initiations lie either on or
near thediagonal.
WenowhaveoneD(U)curvefor eachpairof variables. We next determined the Fourier transform of the raw estimateD(U).Essentially, theFourier transform isamathematicalanalysis ofthe curveasthesumof sine and cosinewave components (see references 41 and 45 for
de-tails).Ourquestionis whether the Fourier
trans-form of the experimentalD(U) curvelookslike the Fourier transform ofastraight line (which
would mean the twosamples hadidentical
distri-butions). Weexamined the sequenceof Fourier
coefficientsto seewhethertheyresembledaline withonly randomvariations(calledaBrownian Bridge process;41).Itis known that thesquare
of acoefficient(called the squaremodulus)from
aBrownian Bridge process would have
asymp-toticallythedistribution ofy/2n, where y has a
chi-square distribution with 2 degrees of free-dom and n is the total number of observations in
the combined sample. If the square modulus
termsof the coefficients in our curve are greater thanCV/2n, where CV is the appropriate critical value from the chi-square distribution, then the two curves are significantly different. The squared modulus terms of the first nine Fourier
coefficients and the critical values at the 0.01
level are shown in Table 1. For initiation in
serum-deprived versus serum-enriched groups,
all except two ofthe values were greater than the critical value; therefore, we can conclude that there are significant differences between the twovariables at the 0.01 level. For comparisons between virus-infected versus serum-deprived
and for virus-infected versus serum-enriched
initiations, the square modulus terms were less
than oronlymarginallygreater than thecritical value. Thus, virus infection of serum-deprived
cells decreased the difference between
serum-deprived and serum-enriched cells and resulted
inat least a partial restoration of the tightcontrol
overthetiming of initiation observed in
serum-enriched cells.
Spatialorganization. Weanalyzed the spatial
organization of activated initiation sites in
pooled samples, as well as within individual
strands. We first pooled the interinitiation dis-tances from different strands as a wayof
com-paringoursystemwiththoseofprevious
investi-gators. The cumulative frequency distributions
of pooled interinitiation distances in Muntjac
cells(Fig. 3) suggest thatinitiationsarephysically
lOOr
80F 0
0~
41
0
E
0
60F
40[
20F
o 20 40 60 80 0OO
Interinitiation distance(p.m)
120
FIG. 3. Cumulativefrequencyof interinitiation dis-tances. Symbols: - , uninfected, serum enriched; ---, virusinfected, serumdeprived;...uninfected, serumdeprived.Frequencieswereplottedatthe mid-pointsof10-smintervals.
on November 10, 2019 by guest
http://jvi.asm.org/
[image:4.496.258.447.463.623.2]MUNTJAC DNA REPLICATION AFTER SV40 INFECTION 111
TABLE 2. Significance of differences in interinitiationdistance distributionby the
Mann-Whitney rank sum test
No.of Levelof Category interinitiation
significance'
distances
Serum deprived 186
Serumeniched 219
Virus infected 190
Virusinfectedvs 0.0155
serum deprived
Serumdeprived 0.4682
vs serum enriched
Virusinfectedvs 0.0119
serum enriched
a Assumingchi-square distribution with1 degree of freedom.
closer together in virus-infected cells than in
serum-deprivedcells and that in serum-enriched
cells their distributionoccupiesanintermediate
position. Interinitiation distances were
short-ened onthe averageby 20%oin DNAreplicating
24 h after SV40 infection of serum-deprived
Muntjac cells as compared with uninfected
se-rum-deprived cells. Interinitiation distances in
cells incubated in 10%o serum were 17% longer than those in virus-infected serum-deprived cells.
The distribution ofpooled interinitiation
dis-tances for each experimental variable differed
markedly from a statistically normal
distribu-tion, makingit invalidtoapplythetypicalttests
ofsignificance. Althoughthegeometric
transfor-mation (asdescribedby Martin and Oppenheim
[37]) brought the data closer to statistical
nor-mality (data not shown), we felt it would be preferable to use a nonparametric statistical test of
significance which does not require a normal
distribution of datapoints.IntheMann-Whitney
ranksumtest, also knownasthe Wilcoxontest (35, 51), all data points for any two of the experimental variables are pooled, after first
tagging themso that theycanbe distinguished.
Thisnewpooledsetis then rankedaccordingto
size. Using thecomputerprogrampackage P3S
of the Biomedical Computer Program P Series (1977), we asked whether low-ranking data
pointsoccur morefrequently inoneortheother
setorwhethertheyareintermingled. The
sensi-tivity and efficiency of the Mann-Whitney rank
sumtestarevery high relativetothe standard t test for both normal and nonnormal data (46). The results of this test for the interinitiation distances are shown in Table 2. Virus infection
of Muntjac cells resulted in significant differ-encesin thepooled interinitiationdistance distri-bution when compared with serum-deprived cells(P = 0.0155) orwithserum-enriched cells
(P=0.0119). Therewas nosignificant difference
between serum-deprived and serum-enriched cellsby thistest(P = 0.4682).
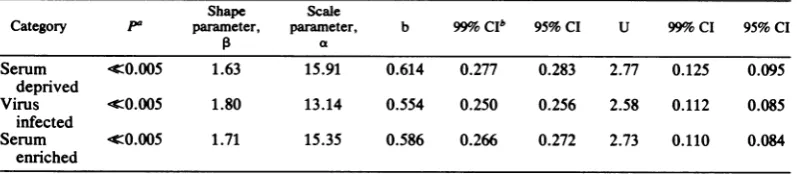
Previous investigations have indicated that interinitiation distances along the mammalian DNA fiberarenotrandomly(i.e., exponentially) distributed and that the distribution is most closely satisfied by a Weibull formulation (7).
The Weibull distribution of interinitiation dis-tances for the pooled strands (Table 3) was
clearlynotexponential(P<<0.005 inallcases). Engelhardt and Bain (14) devised a procedure
for estimating the parameters a and for the Weibull distribution and for estimating confi-dence intervals associated with these
parame-ters. The formula of the Weibull cumulative distribution functionisF(x) = 1 -
exp(-(x/a)P),
wherexis the interinitiationdistance, aiscalled the scaleparameter,and is theshape
parame-ter. canbeconsideredasdescribingtheshape
ofthe frequency distribution curve for interini-tiation distances. Differences in a indicate whether the entire curve is rescaled by a
con-stantvalue. The meanofaWeibulldistribution
is
a(F(P+1)/13),
where I(x) is the gammafunc-tion
fo6tx-l
e-tdt. If,B = 1, then thedistributionTABLE 3. ParametersforWeibulldistributiononpooled interinitiation distances
Shape Scale
Category pa parameter, parameter, b 99%oCIb 95%CI U 99% CI 95% CI
0 a
Serum -c0.005 1.63 15.91 0.614 0.277 0.283 2.77 0.125 0.095
deprived
Virus 4Z0.005 1.80 13.14 0.554 0.250 0.256 2.58 0.112 0.085
infected
Serum I0.005 1.71 15.35 0.586 0.266 0.272 2.73 0.110 0.084
enriched
a
p,
Probability offindingthe resultobserved, under exponentiality.b
CI,
Confidence interval (i.e., b ± CI or U ± CI).VOL.44, 1982
on November 10, 2019 by guest
http://jvi.asm.org/
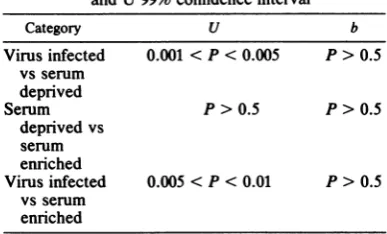
[image:5.496.51.450.566.653.2]TABLE 4. Probability values for pooled Weibull b and U99% confidence interval
Category U b
Virusinfected 0.001< P<0.005 P>0.5 vs serum
deprived
Serum P>0.5 P>0.5
deprived vs serum enriched
Virus infected 0.005 <P<0.01 P> 0.5 vs serum
enriched
ofinterinitiation distances is exponential witha meanequaltoa. IfPisgreaterthan1,thereare
fewer long interinitiation distances than would beexpected fromarandom model with thesame
a. If p is less than 1, there are more short
interinitiation distances andmorelongonesthan
would be predicted byarandom model with the samea.
To evaluate the differences between experi-mental variables for p and a values, it was necessary to determine the variances within eachset.Forthe statisticsb,where b= 1/1,and U, where U= lna,itwaspossibletodetermine the99%confidence intervals, since b and Ucan
be approximated byanormal distribution. The
confidence interval is considered tobe equiva-lenttothe parameter ±
(2.57s)/nl/2
(where s = the standarddeviation andn =thesample size),and it is thus possibleto calculate variances for standard F and ttesting. Virus infection in the Muntjac cells resulted in significant differences in the U statistic when compared with
serum-deprived and serum-enriched cells (Table 4;P<
0.01). There was no significant difference
be-tweenserum-deprived and serum-enriched cells in the U statistic (P > 0.5), and no significant
differences were observed for any of the
com-parisonsinMuntjacvariables in the b statistic(P
> 0.5). Although the shapes of the Muntjac
curves asmeasuredbybarenotchanging,SV40
infection did result in measurable alterations in the distribution of interinitiation distances
re-flected inadecreaseina.
Thenextstepwastoexamine theorganization in localized regionsof the fiber.Inthefollowing seriesoftests,the strandsareanalyzed
individ-ually, and the probability (P) valuesarepooled.
Aspreviously described (7),weused three
sepa-ratetestsfor deviation fromexponentiality: the Keidingtest,theKolmogorov-Smirnovtestwith
afittedmean,and the Weibulltest. Keiding (31) developed atest of exponentiality based upon
the chi-square distribution and a minimum
ob-servation. When this observation is assumedto
be 0, exponentiality is rejected in all of the
cases. If the test minimum is fitted from the sample, exponentiality is not rejected for the serum-deprived Muntjac cells. Virus-infected Muntjac cells and Muntjac cells grown in the presence of serum are initiating nonrandomly even if the test is performed with a fitted test
minimum.
The Kolmogorov-Smirnov test of exponenti-ality with afitted mean (12) is not a sensitive
test; yet,asTable 5 shows, it definitely rejected
exponentiality for the serum-enriched and virus-infected conditions in Muntjac cells. Rejection ofexponentialityfor the serum-deprived condi-tionisdependentonthe P level chosen(0.01<P
< 0.025). The specific test of exponentiality againstaWeibull alternative(15)
overwhelming-ly rejected exponentiality infavor ofaWeibull
distribution for all three conditions (Table 5). The variation in a and ,B in individual strands
wastoo great toallowanalyses ofsignificanceas werecarried outfor pooledstrands.
To summarize,inthe entirepopulation, initia-tion sites were separated by shorter distances
after virus infection. This was not, however, associated with demonstrable changes in the spatial organization within localized regions of the fiber.
DISCUSSION
Initiation of DNAsynthesis inMuntjac cells exhibits demonstrablesynchrony in that there is
TABLE 5. Two-tailedtestsofexponentiality performedonindividual strands
Durbin Keiding test P Weibulltest,shapeparame- Weibulltest,scaleparameter Smith-Finch
Category Kolmogorov- terl at Vtest
Caeoy Smirnov exponential
test, p aa= 0 aestimated Maximum Minimum Median Maximum Minimum Median vsWeibull
Serum 0.011 <0.005 0.1-0.2 2.78 0.90 1.48 22.10 9.93 17.59 <0.005
deprived
Virus 0.005 < 0.005 0.005-0.01 3.32 0.97 1.78 19.% 10.64 13.08 <0.005
infected
Serum 0.009 <0.005 <0.005 4.33 0.65 1.49 23.25 11.13 16.52 <0.005
enriched
a
p,
Probability offindingtheresultobserved,underexponentiality.on November 10, 2019 by guest
http://jvi.asm.org/
MUNTJAC DNA REPLICATION AFTER SV40 INFECTION 113
a high degree of clustering of initiation times around the median. This control over the timing
ofinitiationoverlocalizedregionsof thefiberis
disturbed when thecells areincubated in medi-um without FBS. There was a significant in-crease in thefrequency of"outliers" in
serum-deprived cells. Infection with SV40 resulted in
aninductionofcellularDNAsynthesis(i.e., an
increase in the percentage of cells in S phase)
and adistribution of initiationtimes which was
closertothe median. Initiations alongthe fiber
occurred more closelytogetherin time in
virus-infected cells than in serum-deprived cells, but
the clustering did not reach the level seen in
serum-enriched cells. Potential physical sites
maybecome availableforDNAreplicationeven in serum-deprived cells, but apparently cannot initiate at the proper times because of the low level of initiation factors. SV40 infection may
partially remove this barrier. Even ifnew sites
are activated after SV40 infection, they are
governedbythetemporal controloverinitiation
events operatingin normalcells. The onlyway that there can be an increase in the clustering
aroundthemedian is ifinitiationat"new"sites
occurs concurrently with initiations at the
ma-jority ofpreexisting sites.
To relate our findings to the demonstration that thelength oftheSphasedoesnotchangein
Muntjac cells after SV40 infection (17), it is
necessary to consider the concept of control
mechanismsgoverningthe temporal
ordering
ofreplicationin entire segmentsofthe genome(for
a review, see references 2, 13, 20). Particular
chromosomal regions are replicated at specific
times within the S phase. A decrease in the
length of time needed to
replicate
one or moresegmentsbecauseofavirus-induced increasein
synchrony or a decrease in interinitiation
dis-tance need not necessarily affect the time of
onsetofreplication in the nextsegment.
Thus,
theoverall length ofthe S phase may be much more stable than would be suspected from the events
occurring
inlocalizedregionsof the fiber. At 24h after theinfection ofserum-deprivedMuntjaccells withSV40, initiationsappeartobe
physically closertogether. This decrease is
re-flected in achange in the scale parametera of
the Weibull distribution ofthe pooled data. A
significant decrease in a means that, on the average, all of the interinitiation distances are shortened
proportionally,
withthelonger inter-initiation distancesbeing shortened to agreater extent. In SV40-infected Muntjac cells, if an initiation site is locatedat apointalongastrand,the probability offinding a second site at any
distance away from italongthe strand ishigher
thanit would be in the uninfected controlcell. Therewas asuggestionfrom the
Kolmogorov-SmirnovtestandtheKeidingtestthatinitiations
in serum-deprived cells occurin a more random (exponential) manner than in serum-enriched cells, but the differences were not statistically
significant. There were no profound shifts in the organizationof DNA replication within individ-ualstrands after SV40 infection, unlike changes observed after theexposure of cells toprolonged
treatments with FUdR (7) or infection with reovirus (29). For this reason, we do not believe that entire clusters of replication units are being
induced or repressed by SV40 infection in an
order different from that operating in normal genomereplication.
Itis difficult to compare our data meaningfully with those of Martin and Oppenheim (37) and Oppenheim and Martin (39), who found the geometric mean interinitiation distance to be lower in SV40-transformed relative to nontrans-formed Chinese hamsterlung and BALB/c 3T3 cells in complete medium, but to be higher in
isoleucine-deprivedmedium. They were dealing
with cellular DNA replication in established transformedlines, ratherthan events occurring
early afterinfectionand used adifferentmethod
of deprivation. The labeling procedures also
differed. Martin and Oppenheim employed a
brief pulse-label and measured distances be-tweentrack centers. Our procedure of following ashort pulse ofhigh-specific-activity label with along period oflabeling at low specific activity gave us greaterconfidence in identifying origins in prepulse and postpulse figures and correctly
recognizing replication units that were on the
samestrand. Wealso believe that in our system, the nonparametric statistical analyses utilized made thefewestpossible assumptions and
pro-vided precise and accurate representations of
the data.
It is noteworthy that large T antigen has
specific affinity for sequences at the origin of
viral DNA replication (43, 48) and also binds to cellular DNA (17, 42). We consider that the
additional sites used in SV40-infected Muntjac
cellsare sitesnormally employed byuninfected
cells,butarebeingrecognizedby Tantigenor a
T-antigen-containing replication complex in the
infected cells. T antigen may facilitate the
for-mation of DNA replication complexes or pro-mote the efficiency of recognition of existing
originsin such a way that when multiple sites
become available for replication in a segment of DNA, initiations can occur more closely togeth-erintime.
ACKNOWLEDGMENTS
This work wassupported by Research Grant CA-18608 and by Program ProjectGrant CA-18213 awarded by the National CancerInstitute. B.R.J. is apostdoctoral feliowunder the Institutional National Research Award CA-09256 from the National Cancer Institute.
on November 10, 2019 by guest
http://jvi.asm.org/
114 JASNY ET AL.
We thank RobertMemolifor his assistance in scoring the autoradiograms. We also gratefully acknowledge the assist-ance of Terry Woodfield in the utilization of the TWOSAM program and thank Emanuel Parzen forhelpful discussions.
LITERATURE CITED
1. Balsz, I., E. H. Brown, and C. L.Schildkraut. 1974. The temporal order of replication of some DNA cistrons. Cold Spring Harbor Symp. Quant. Biol. 38:239-245. 2. Blumenthal, A. B., H. J.Kriegstein, and D. S. Hogness.
1973. The units of DNA replication in Drosophila melano-gasterchromosomes. Cold Spring Harbor Symp. Quant. Biol. 38:205-224.
3. Butel, J. S., J. S. Brugge, and C. A. Noonan. 1975. Transformationof primate and rodent cells by tempera-ture-sensitive mutants ofSV40. Cold Spring Harbor Symp.Quant. Biol. 39:25-36.
4. Callan, H. G. 1972. Replication of DNA in the chromo-somes of eukaryotes. Proc. R. Soc. London Ser. B 181:19-41.
5.Chen, T. R. 1977. In situ detection of mycoplasma con-tamination in cell cultures by fluorescent Hoechst 33258 stain. Exp. Cell Res.104:255-262.
6. Chou,J. Y., and R. G. Martin. 1974. DNA infectivity and the induction of host DNA synthesis with temperature-sensitive mutantsof simian virus 40. J. Virol. 15:145-150. 7. Cohen, J. E., B. R. Jasny, and I. Tamm. 1979. Spatial distributionofinitiationsites for mammalian DNA repli-cation: astatisticalanalysis. J. Mol. Biol. 127:219-245. 8.D'Alsa, R., and E. Gershey. 1978. Simian virus 40 T
antigen bindsto host cell chromosomes. Nature (London) 274:164-166.
9. D'Ail,R. M.,and E. Gershey. 1980. Characterization of the cell cycle and synchrony in a CV1 cell line. Cytometry 1:78-83.
10. D'Alla,R.M., B. M. Korf, and E. L.Gershey.T antigen banding on chromosomes of simian virus 40 infected Muntjaccells. Cytogenet. Cell Genet. 24:27-36. 11. Dlcumakos,E.,and E. L.Gershey.1977. Uncoating and
gene expression ofsimian virus 40 in CV-1 cell nuclei inoculatedbymicroinjection. J. Virol. 24:903-906. 12. Durbin,J.1975.Kolmogorov-Smirnovtests when
param-eters areestimatedwith applications to tests of exponen-tiality and tests on spacings. Biometrika 62:5-22. 13. Edenberg,H.J.,and J. A. Huberman. 1975. Eucaryotic
chromosome replication.Annu. Rev. Genet. 9:245-284. 14. Engebardt,M., and L.Bain. 1977. Some complete and
censored sampling results for the Weibull or extreme-valuedistribution. Technometrics15:541-548.
15. FInch, S. 1977. Robust univariate test of symmetry. J. Am. Stat.Assoc. 72:387-392.
16. Genhey,E. L.1979.Simianvirus40-hostcell interaction during lyticinfection. J.Virol. 30:76-83.
17. Gershey, E. L. 1980. SV40-infected Muntjac cells: cell cyclekinetics, cellploidy, and T antigen concentration. Cytometry 1:49-55.
18. Gershey, E. L. 1981. Simian virus 40 causes persistent infection ofMuntjaccells in the absence of viral transfor-mation. J. Gen. Virol. 56:33-40.
19. Graeumann, M., and A. Graessmann. 1976. "Early" SV40specific RNAcontains informationfor tumor anti-gen formation and chromatin replication. Proc. Natl. Acad. Sci. U.S.A. 73:366-370.
20. Hand, R. 1978. Eucaryotic DNA: organization of the genomeforreplication. Cell15:317-325.
21. Harlow, E., D. C. Pim, and L. V. Crawford. 1981. Complex of simian virus 40 large T-antigen and host 53,000molecularweight protein in monkey cells. J. Virol. 37:564-573.
22. Hatanaka,M., and R.Dulbecco.1966. Induction of DNA synthesisbySV40.Proc.Natl.Acad. Sci. U.S.A. 56:736-740.
23. Hatfield,J. M.R., and P. M. B.Walker. 1972. Satellite DNAreplicationin babymousekidney cells infected with polyomavirus.Nature(London)New Biol. 242:141-142.
24. Henry, P., P. H. Black, M. N. Oxman, and S. M.
Weiss-mann. 1966. Stimulation of DNA synthesis in mouse cell
line3T3 by simian virus 40. Proc. Natl. Acad.Sci.U.S.A. 56:1170-1176.
25. Hiscott,J.B., and V.Defendi.1979. Simian virus 40 gene A regulation of cellular DNA synthesis in permissive cells.J. Virol. 30:590-599.
26. Hicott,J.B., and V.Defendi. 1981. Simian virus 40 gene A regulation of cellular DNA synthesis.II. In nonpermis-sivecells. J. Virol. 37:802-812.
27. Jasny, B. R., and I. Tamm. 1979. Temporal organization of DNA replication in DNA fibers of mammalian cells. J.
Cell Biol. 81:692-697.
28. Jasny, B. R., J. E. Cohen, and I. Tamm. 1978. The organization of DNAreplicationin amammaliancell line, p. 175-188. InI.Molineuxand M. Kohiyama (ed.), DNA synthesis: present and future. Plenum Publishing Corp., New York.
29. Jasny, B. R.,J.E. Cohen, and I. Tamm. 1979. Effect of reovirus infection on the spatial and temporal organization of DNA replication in Lcells. Chromosoma 79:207-214. 30. Kapp, L. N., D. Park, andJ. E. Cleaver. 1979. Replicon
sizes in nontransformed andSV40-transformed cells as estimated by a bromodeoxyuridine method. Exp. Cell
Res. 123:375-377.
31. Kelding, N. 1977.Statisticalcomments on Cohen's appli-cation of a simple stochastic population model to natural primate troops. Am. Nat. 111:1211-1219.
32. Kit,S., D. R. Dubbs, P. M. Frearson, andJ. L.Melnlck.
1964. Enzyme induction inSV40-infected green monkey kidney cultures. Virology 1:69-83.
33. Kriegler,M. P., J. D.Griffin,and D. M.Livington.1978. Phenotypic complementation of the SV40 tsA mutant defect in viral DNA synthesisfollowingmicroinjection of SV40 T antigen.Cell14:983-984.
34.Lehmann,J.M., I. B.Klein, and L. S.Cram. 1979. Flow cytometry analysis of early DNA content changes in human and monkeycellsfollowing infection with simian virus 40. J. Supramol. Struct.11:25-31.
35. Mann, H. B., and D. R. Whitney. 1947. On a test of whether one of tworandom variables is stochastically larger than the other. Ann. Math. Statist. 18:50-60. 36. Martin,R.G., J. Y. Chou, J.Avila,and R. Saral. 1975.
The semiautonomous replicon: a molecular model for oncogenicity. Cold Spring Harbor Symp. Quant. Biol. 39:17-24.
37. Martin,R. G.,andA.Oppenhelm. 1977. Initiation points for DNA replication in nontransformed and simian virus 40-transformed Chinese hamster lungcells. Cell 11:859-869.
38. Mueller, C., A. Graeamann, and M.Gras . 1978. Mapping of earlySV40-specific functions by microinjec-tion ofdifferentearly viral DNA fragments. Cell 15:579-585.
39. Oppenbelm,A., and R. G.Martin.1978. Initiation points for DNA replication in nontransformed and simian virus 40-transformed BALB/c 3T3cells. J. Virol. 25:450-452. 40. Parker, R. J., A. M. Tobla, S. G. Baum, and C. L.
Schlldkraut. 1975. DNA replication in synchronized cul-tured mammaliancells.Virology 66:82-93.
41. Parzen, E. 1979. Nonparameteric statistical modeling. J. Am. Stat. Assoc. 74:105-131.
42. Prives, C.,Y.Beck,D.Gidoni, M. Oren, and H. Shu. 1980. DNA binding and sedimentation properties ofSV40 T antigen synthesized in vivo and in vitro. Cold Spring Harbor Symp. Quant. Biol.44:123-130.
43. Reed, S.I.,J. Ferguson,R. W. Davia,and G. R. Stark. 1975.T antigen binds to simian virus 40 DNA at the origin of replication. Proc. Natl. Acad. Sci. U.S.A. 72:1605-1609.
44. Ritzi,E., and A. J.Levine.1969. Deoxyribonucleic acid replication in simian virus40-infectedcells. III. Compari-son of simian virus 40lytic infection in three different monkeykidney lines. J.Virol. 5:686-692.
45. Seeley, R. T. 1966. An introduction toFourierseriesand
on November 10, 2019 by guest
http://jvi.asm.org/
115
integrals.W.A.Benjamin,Inc.,NewYork.
46. Snedecor, G. W., and W. G. Cochran. 1976. Statistical methods. Iowa State UniversityPress, Ames.
47. Tegtneyer,P.1972.Simian virus 40 deoxyribonucleic acid synthesis: the viralreplicon.J.Virol. 10:591-598. 48. Tilan, R. 1978. Thebinding siteonSV40 DNA foraT
antigen related protein. Ceil 13:165-179.
49. TJIan, R., G. Fey, and A.Grm. 1978. Biological
activity of purified simian virus 40 T antigen proteins. Proc. Nati. Acad. Sci. U.S.A.75:1279-1283.
50. White, J. M.1979.TWOSAM,acomputerprogramfor nonparametric comparison of two samples. Technical
reportNo. A-9. Institute of Statistics, Texas A and M ResearchFoundation, College Station.
51. Wilcoxon, F. 1945. Individual comparisons by ranking methods. Biometrics 1:80-83.
VOL. 44, 1982
on November 10, 2019 by guest
http://jvi.asm.org/