RESEARCH NOTE
GrapHi-C: graph-based visualization
of Hi-C datasets
Kimberly MacKay
1*, Anthony Kusalik
1and Christopher H. Eskiw
2Abstract
Objectives: Hi-C is a proximity-based ligation reaction used to detect regions of the genome that are close in 3D space (or “interacting”). Typically, results from Hi-C experiments (contact maps) are visualized as heatmaps or Circos plots. While informative, these visualizations do not directly represent genomic structure and folding, making the interpretation of the underlying 3D genomic organization obscured. Our objective was to generate a graph-based contact map representation that leads to a more intuitive structural visualization.
Results: Normalized contact maps were converted into undirected graphs where each vertex represented a genomic region and each edge represented a detected (intra- and inter-chromosomal) or known (linear) interaction between two regions. Each edge was weighted by the inverse of the linear distance (Hi-C experimental resolution) or the interaction frequency from the contact map. Graphs were generated based on this representation scheme for contact maps from existing fission yeast datasets. Originally, these datasets were used to (1) identify specific principles influencing fission yeast genome organization and (2) uncover changes in fission yeast genome organization during the cell cycle. When compared to the equivalent heatmaps and/or Circos plots, the graph-based visualizations more intuitively depicted the changes in genome organization described in the original studies.
Keywords: Hi-C, Whole-genome contact maps, Data visualization, Graphs
© The Author(s) 2018. This article is distributed under the terms of the Creative Commons Attribution 4.0 International License (http://creat iveco mmons .org/licen ses/by/4.0/), which permits unrestricted use, distribution, and reproduction in any medium, provided you give appropriate credit to the original author(s) and the source, provide a link to the Creative Commons license, and indicate if changes were made. The Creative Commons Public Domain Dedication waiver (http://creat iveco mmons .org/ publi cdoma in/zero/1.0/) applies to the data made available in this article, unless otherwise stated.
Introduction
One of the major problems in the genomic era is under-standing how genomes are organized and chromosomes are folded within cells. Genomic organization, specifi-cally the close physical proximity of genetic elements located either distally on the same chromosome or located on different chromosomes, greatly impacts cel-lular processes such as transcription, replication and recombination [1]. The close physical proximity of two genetic elements is often referred to as an “interaction”. Knowledge of what interactions are occurring and how they are mediated is essential to understanding genome functions such as gene expression regulation. The bio-logical assay Hi-C [2, 3] (or one of its derivatives [4–7]) can be used to detect interactions between regions of the genome on the same chromosome (intra-chromosomal
or cis-interactions) or different chromosomes (inter-chromosomal or trans-interactions).
Briefly, Hi-C involves chemically cross-linking regions of the genome that are in close spatial proximity. Restric-tion enzyme digesRestric-tion and ligaRestric-tion is then preformed on the cross-linked regions to generate chromatin/DNA complexes which can be identified by high-throughput sequencing. The resultant sequence reads are mapped to a reference genome [8] to determine the frequency with which each interaction occurs within the population of cells. The results of a Hi-C experiment are often encoded as a symmetric N×N matrix (contact map) where N is
the number of genomic “bins” into which the genome is partitioned. Each genomic bin represents a linear region of genomic DNA, where the number of bins is approxi-mately equal to the total genome size divided by the experimental resolution. For instance, a Hi-C experiment in fission yeast that is able to attain 10 kB resolution will generate 1258 genomic bins, each representing roughly 10 kB of linear DNA sequence. Each cell ( CMi,j ) of the contact map records the interaction frequency between
Open Access
*Correspondence: [email protected]
1 Department of Computer Science, University of Saskatchewan, 110 Science Place, Saskatoon, SK S7N 5C9, Canada
genomic bins i and j. Inherent systematic biases within the whole-genome contact map are dampened by nor-malizing the interaction frequencies. Typically, an ICE [9] or Knight-Ruiz [10, 11] normalization is applied to the raw data resulting in fractional interaction frequencies.
In a typical workflow, normalized contact maps are ini-tially visualized as heatmaps or Circos [12] plots before further downstream analysis and 3D modelling [13]. While informative, these visualizations do not intuitively represent the complex organization and folding of the genome in 3D space. This makes it difficult to quickly understand the underlying 3D genome organization represented by the contact map. Our hypothesis is that representing and visualizing contact maps as a graph will lead to a more intuitive structural visualization of Hi-C data when compared to typical methods. We have devel-oped a protocol called GrapHi-C (pronounced “graphic”) for visualizing Hi-C data as a graph. GrapHi-C utilizes a graph-based representation of a contact map and existing interactive tools for a more intuitive structural visualiza-tion of Hi-C data. We applied GrapHi-C to two existing datasets to demonstrate the improvements it can bring to interpreting Hi-C data.
Main text
Results and discussion
Graph‑based representation
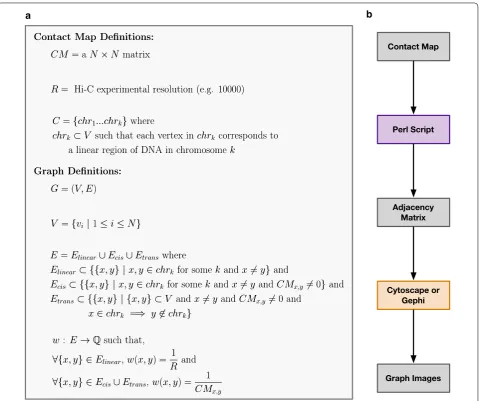
In GrapHi-C visualizations, a contact map is trans-lated into an undirected graph where each genomic bin is represented as a vertex and the detected or known interactions between bins are represented as undirected weighted edges. Specifically, edges represent linear, cis- and trans-interactions. Each edge is weighted with the inverse of the experimental resolution (for linear interac-tions) or interaction frequency (for cis- and trans -inter-actions). The edges representing bonafide in vivo linear connections between bins (i.e. the linear extent of the chromosome) add additional biological constraints. A formal description of the graphical representation used in GrapHi-C is presented in Fig. 1a.
Visualization protocol
A Perl script was developed that is able to convert a nor-malized contact map into an adjacency matrix based on the graph representation described above (available
at: https ://githu b.com/kimma ckay/GrapH i-C, or
Addi-tional file 1). The output of this script can then be input into a tool like Cytoscape [14] or Gephi [15] to generate a structural visualization. Utilizing existing network visu-alization tools is advantageous since there are multiple plug-ins and layouts available which allow for flexibility in visualization and subsequent analysis.
It should be noted that Hi-C data cannot be directly input into tools like Cytoscape or Gephi. CytoHiC is the only existing Cytoscape plug-in for Hi-C data. It is used for pairwise comparisons of contact maps based on genetic landmarks such as methylation [16] and would provide a complementary analysis to GrapHi-C. The cur-rent version of CytoHiC is not compatible with the latest major release of Cytoscape (released February 2013) and the plug-in does not appear to be actively maintained. Unlike GrapHi-C, CytoHiC does not include edges repre-senting linear interactions. It also utilizes a different edge weight equation to incorporate genetic landmarks into its comparison.
Applications
To demonstrate the value of the GrapHi-C visualization protocol, it was utilized to visualize contact maps from existing fission yeast datasets where (1) fission yeast mutants were studied to determine principles of genomic organization [17] and (2) synchronized fission yeast cells were used to track genomic organization throughout the cell cycle [18]. In each case, normalized fission yeast con-tact maps (10 kB resolution) were downloaded from the Gene Expression Omnibus database. The specific acces-sion numbers are listed in “Availability of data and
mate-rials” section. These contact maps were transformed into
adjacency matrices using the Perl script described above. The matrices were then input to the developed GrapHi-C protocol depicted in Fig. 1b. For comparison, the nor-malized fission yeast contact maps were also visualized as heatmaps and Circos plots. The heatmaps were generated using Java Treeview [19] which is the recommended visu-alization tool for contact maps generated from Hi-C data analysis pipelines [20]. The Circos plots were visualized in Cytoscape [14].
For comparison, heatmaps (Fig. 2e, f) and Circos plots (Fig. 2g, h) for the 999a wild-type and the rad21 mutant contact maps were generated. These images represent the standard, existing approach for the visualization of
Hi-C data. They clearly demonstrate how the traditional forms of visualization do not intuitively represent the complex organization and folding of the genome in 3D space (Fig. 2e–h). This makes it challenging to generate
a b
Fig. 1 A formal description of the graph representation and workflow used by GrapHi-C. a The mathematical model used to represent a contact map as an undirected graph in the GrapHi-C protocol. b Overview of the GrapHi-C protocol. Each step of the workflow is indicated in a box where the different colours correspond to: data input and output (grey), developed Perl script (purple), and an existing tool (orange). An option for scaling the interaction frequencies is available in the developed Perl script if future studies wish to use it
(See figure on next page.)
Fig. 2 Comparison of GrapHi-C Visualizations, Heatmaps and Circos plots. Visualizations of the contact maps for the fission yeast 999a wild-type and rad21 mutant are displayed in the left and right columns, respectively. a–d The GrapHi-C visualizations where vertices and linear interactions were coloured according to their corresponding chromosome (chromosome 1: blue, chromosome 2: red, chromosome 3: green). The grey dashed lines represent cis-interactions (a, b) and trans-interactions (c, d). Graphs were visualized in Cytoscape using a edge-weighted spring embedded layout.
[image:3.595.60.541.86.487.2]cis
-interactions
trans
-interactions
heatmap
s
wild-type rad21 mutant
Circos plot
s
a b
c d
e f
hypotheses about how differences in the wild-type and mutant contact maps are reflected in genome organi-zation. On the contrary, the GrapHi-C visualizations (Fig. 2a–d) clearly highlight the loss of structural globules (intra-chromosomal structures) and the greater inter-mingling of chromosomes in the mutant strain that was described in the original study [17]. The resultant visuali-zations for the rad21 mutant strain (Fig. 2b, d) appear to be very similar since the mutant contact map has smaller interaction frequency values (as compared to the wild type) due to a greater intermingling of chromosomes. This results in the nodes being placed closer together in the edge-weighted spring embedded layout. The rad21 interaction frequency values are not scaled in order to maintain consistency when comparing the wild-type and mutant strain visualizations. Overall, the GrapHi-C visu-alizations made it easier to quickly identify the principles of genome organization and associated biological effects of the rad21 yeast mutant that were discovered in the original study. This suggests the developed graph-based representation and structural visualization is a valid way to represent contact maps.
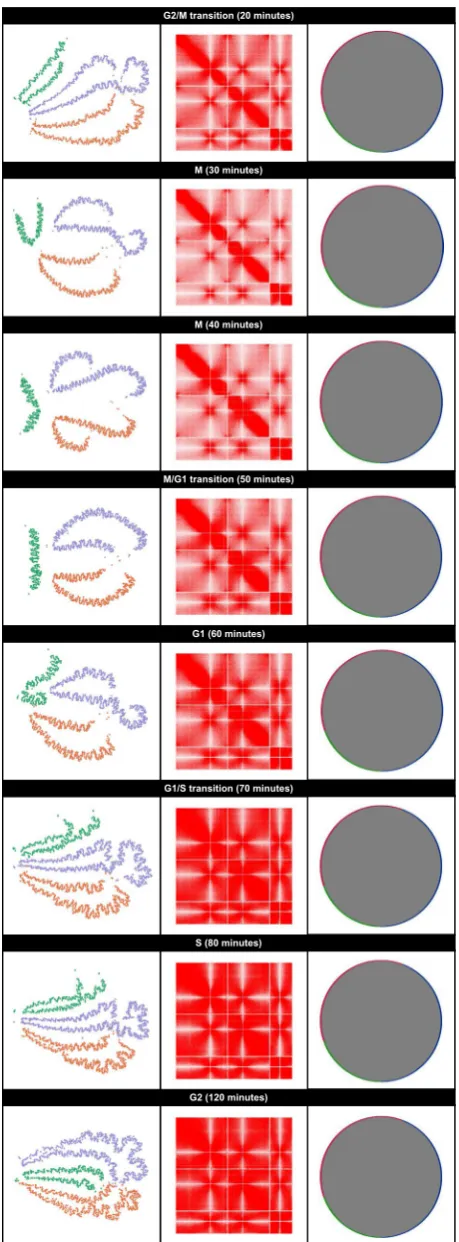
Application 2 To determine if the GrapHi-C protocol was able to identify the same cell cycle dependent altera-tions in genome organization described by Tanizawa et al. [18]. GrapHi-C images, based on the normalized contact maps for each time point, were visualized in Gephi using the ForceAtlas2 layout [21] (Fig. 3—column 1). Similarly to Application 1, all edges (corresponding to cis-, trans- and linear interactions) were used to generate the images. Nodes were manually coloured according to their cor-responding chromosome and edges were hidden in the exported images for simplicity. GrapHi-C images contain-ing all the edges for the 40, 60, 80 and 120 minute time points are provided in Additional files 2, 3, 4 and 5. For comparison, the heatmaps (Fig. 3—column 2) and Circos plots (Fig. 3—column 3) were generated based on the nor-malized contact maps for each cell cycle time point. As mentioned previously, these images represent the stand-ard, existing approach for Hi-C data visualization.
In the original study, Tanizawa et al. [18] established that throughout the cell cycle, small domains approxi-mately 50 kB in size are consistently present. During mitosis (M) the DNA condenses resulting in more cis -chromosomal interactions and fewer trans-chromosomal interactions. Not only are the GrapHi-C visualizations able to recapitulate these identified cell cycle dependant genomic alterations, they also intuitively highlight estab-lished features of fission yeast genomic organization. For instance, during fission yeast interphase (comprised of the G1, S and G2 phases) the chromosomes are organized in a polarized arrangement (Rab1-like configuration)
where the centromeres of all three chromosomes are clustered at one end of the nucleus and the telomeres of chromosomes 1 and 2 cluster at the opposite end near the nuclear periphery [22]. Additionally, micros-copy techniques have established that all three chromo-somes are organized into distinct chromosome territories within the nucleus at all phases of the cell cycle [22–24]. These hallmarks of fission yeast genome organization are distinctly recapitulated in the GrapHi-C visualizations. Furthermore, the GrapHi-C visualizations clearly repre-sent the established condensation of chromosomal DNA during mitosis and de-condensation during interphase [22]. Overall, GrapHi-C provides a more intuitive repre-sentation of how the chromosomes are organized within the nucleus during different phases of the cell cycle. The resultant images are informative additions which support the in-depth analysis performed in the original study.
Conclusion
In this manuscript, we provide a protocol called GrapHi-C (pronounced “graphic”) for visualizing Hi-C data as a graph and developed a mathematical model for graph-based representations of contact maps. In addition to edges that represent the detected cis- and trans-interactions, we chose to include edges between each sequential genomic bin within a chromosome to better represent the linear extent of the genome. We developed a Perl script that can be used to convert a contact map into an adjacency matrix related to the developed graph-based representation. This matrix can then be input into a tool like Cytoscape or Gephi for structural visualization. Even though the graph-based representation seems straightforward, it is still novel in the genome structure community.
Limitations
GrapHi-C has only been tested on Hi-C datasets from haploid organisms—it should also be applied to organ-isms with higher ploidies to establish the robustness of the workflow. Additionally, GrapHi-C needs to be tested on an unfavourable Hi-C dataset that contains a multitude of disparate proximity relationships. Finally, the effect of visualizing a Hi-C dataset with technical problems needs to be established.
Availability of data and materials
The datasets supporting the conclusions of this article are available in the Gene Expression Omnibus data-base, [accession number: GSE56849; https ://www.
ncbi.nlm.nih.gov/geo/query /acc.cgi?acc=GSE56 849,
GSE93198; https ://www.ncbi.nlm.nih.gov/geo/query /
acc.cgi?acc=GSE93 198]. The specific sample numbers
for each application follow.
• Application 1
999a (GSM1379427)
rad21 (GSM1379430)
• Application 2
20 min (GSM2446256) 30 min (GSM2446257) 40 min (GSM2446258) 50 min (GSM2446259) 60 min (GSM2446260) 70 min (GSM2446261) 80 min (GSM2446262) 120 min (GSM2446263)
M (30 minutes) G2/M transition (20 minutes)
M (40 minutes)
G1 (60 minutes)
G1/S transition (70 minutes)
S (80 minutes)
G2 (120 minutes) M/G1 transition (50 minutes) Fig. 3 GrapHi-C visualizations for fission yeast contact maps
at various stages of the cell cycle. Cell cycle labels and the corresponding time points are given on the top of each panel. GrapH-C images are presented in column 1. In these images, vertices were coloured according to their corresponding chromosome (chromosome 1: purple, chromosome 2: orange, chromosome 3: green) and edges were hidden. Graphs were visualized in Gephi using the ForceAtlas2 layout. The corresponding heatmaps generated by Java Treeview are in column 2. In these heatmaps, the opacity of a cell is directly related to the frequency of the interaction. Column 3 contains the Circos plots that correspond to the contact maps. Circos plots were visualized in Cytoscape. Vertices were coloured according to their corresponding chromosome (chromosome 1: blue, chromosome 2: red, chromosome 3: green) and grey lines represent an interaction between two vertices. Note that the area inside the circle appears to be solid grey due to the number (and subsequent density) of interactions in these datasets
[image:6.595.307.537.88.710.2]Software information
Project Name: GrapHi-C (pronounced \graphic") Project home page: https ://githu b.com/kimma ckay/ GrapH i-C/
Archived version: v1.0.0
Operating system(s): Platform independent Programming language: Perl
Other requirements: Not Applicable
License: This work is licensed under the Creative Commons Attribution-NonCommercial-ShareAlike 3.0 Unported License. To view a copy of this license, visit
http://creat iveco mmons .org/licen ses/by-nc-sa/3.0/
or send a letter to Creative Commons, PO Box 1866, Mountain View, CA 94042, USA.
Abbreviation
3D: three-dimensional.
Authors’ contributions
KM and AK developed the formal graph model. CHE provided biological insight. KM implemented the Perl script. KM applied the Perl script and visualization protocol to the fission yeast datasets. KM wrote the manuscript. AK and CHE edited the manuscript. All authors read and approved the final manuscript.
Author details
1 Department of Computer Science, University of Saskatchewan, 110 Science Place, Saskatoon, SK S7N 5C9, Canada. 2 Department of Food and Bioproduct
Additional files
Additional file 1. Perl script used for converting a contact map into an adjacency matrix based on the graphrepresentation in Fig. 1a. Additional file 2. GrapHi-C Visualization for Fission Yeast Contact Map During M Phase (40 min)In this image, vertices were coloured according to their corresponding chromosome (chromosome 1: purple,chromosome 2: orange, chromosome 3: green). The cis- and trans-interactions edges are depicted with grey lines.Due to the number (and subsequent density) of these lines, these appear to be a solid grey area. The graph wasvisualized in Gephi using the ForceAtlas2 layout. Additional file 3. GrapHi-C Visualization for Fission Yeast Contact Map During G1 (60 min)In this image, vertices were coloured according to their corresponding chromosome (chromosome 1: purple,chromosome 2: orange, chromosome 3: green). The cis- and trans-interactions edges are depicted with grey lines. Due to the number (and subsequent density) of these lines, these appear to be a solid grey area. The graph wasvisualized in Gephi using the ForceAtlas2 layout.
Additional file 4. GrapHi-C Visualization for Fission Yeast Contact Map During S Phase (80 min)In this image, vertices were coloured according to their corresponding chromosome (chromosome 1: purple,chromosome 2: orange, chromosome 3: green). The cis- and trans-interactions edges are depicted with grey lines.Due to the number (and subsequent density) of these lines, these appear to be a solid grey area. The graph wasvisualized in Gephi using the ForceAtlas2 layout.
Additional file 5. GrapHi-C Visualization for Fission Yeast Contact Map During G2 (120 min)In this image, vertices were coloured according to their corresponding chromosome (chromosome 1: purple,chromosome 2: orange, chromosome 3: green). The cis- and trans-interactions edges are depicted with grey lines.Due to the number (and subsequent density) of these lines, these appear to be a solid grey area. The graph wasvisualized in Gephi using the ForceAtlas2 layout.
Science, University of Saskatchewan, 51 Campus Drive, Saskatoon, SK S7N 5A8, Canada.
Acknowledgements
Not applicable.
Competing interests
The authors declare that they have no competing interests.
Consent for publication
Not applicable.
Ethics approval and consent to participate
Not applicable.
Funding
This work was supported by the Natural Sciences and Engineering Research Council of Canada [RGPIN 37207 to AK, Vanier Canada Graduate Scholarship to KM].
Publisher’s Note
Springer Nature remains neutral with regard to jurisdictional claims in pub-lished maps and institutional affiliations.
Received: 16 April 2018 Accepted: 15 June 2018
References
1. Babu D, Fullwood MJ. 3D genome organization in health and disease: emerging opportunities in cancer translational medicine. Nucleus. 2015;6(5):382–93.
2. Belton JM, McCord RP, Gibcus JH, Naumova N, Zhan Y, Dekker J. Hi-C: a comprehensive technique to capture the conformation of genomes. Methods. 2012;58:268–76.
3. Lieberman-Aiden E, van Berkum NL, Williams L, Imakaev M, Ragoczy T, Telling A, Amit I, Lajoie BR, Sabo PJ, Dorschner MO, Sandstrom R, Bernstein B, Bender MA, Groudine M, Gnirke A, Stamatoyannopoulos J, Mirny LA, Lander ES, Dekker J. Comprehensive mapping of long-range interactions reveals folding principles of the human genome. Science. 2009;326:289–93.
4. Cope NF, Fraser P. Chromosome conformation capture. Cold Spring Harb Protoc. 2009;2009(2):5137.
5. Dekker J, Rippe K, Dekker M, Kleckner N. Capturing chromosome confor-mation. Science. 2002;295(5558):1306–11.
6. Dostie J, Richmond TA, Arnaout RA, Selzer RR, Lee WL, Honan TA, Rubio ED, Krumm A, Lamb J, Nusbaum C, Green RD, Dekker J. Chromosome conformation capture carbon copy (5C): a massively parallel solution for mapping interactions between genomic elements. Genome Res. 2006;16(10):1299–309.
7. Zhao Z, Tavoosidana G, Sjölinder M, Göndör A, Mariano P, Wang S, Kanduri C, Lezcano M, Sandhu KS, Singh U, Pant V, Tiwari V, Kurukuti S, Ohlsson R. Circular chromosome conformation capture (4C) uncovers extensive networks of epigenetically regulated intra- and interchromosomal inter-actions. Nat Genet. 2006;38:1341–7.
8. Ay F, Noble WS. Analysis methods for studying the 3D architecture of the genome. Genome Biol. 2015;16(1):1–15.
9. Imakaev M, Fudenberg G, McCord RP, Naumova N, Goloborodko A, Lajoie BR, Dekker J, Mirny LA. Iterative correction of Hi-C data reveals hallmarks of chromosome organization. Nat Methods. 2012;9(10):999–1003. 10. Knight PA, Ruiz D. A fast algorithm for matrix balancing. IMA J Numer
Anal. 2012;33(3):1029–47.
11. Li W, Gong K, Li Q, Alber F, Zhou XJ. Hi-Corrector: a fast, scalable and memory-efficient package for normalizing large-scale Hi-C data. Bioinfor-matics. 2015;31(6):960–2.
•fast, convenient online submission
•
thorough peer review by experienced researchers in your field
• rapid publication on acceptance
• support for research data, including large and complex data types
•
gold Open Access which fosters wider collaboration and increased citations maximum visibility for your research: over 100M website views per year
•
At BMC, research is always in progress.
Learn more biomedcentral.com/submissions
Ready to submit your research? Choose BMC and benefit from:
13. Yardımcı GG, Noble WS. Software tools for visualizing Hi-C data. Genome Biol. 2017;18(1):26.
14. Shannon P, Markiel A, Ozier O, Baliga NS, Wang JT, Ramage D, Amin N, Schwikowski B, Ideker T. Cytoscape: a software environment for integrated models of biomolecular interaction networks. Genome Res. 2003;13(11):2498–504.
15. Bastian M, Heymann S, Jacomy M. Gephi: an open source software for exploring and manipulating networks. Int AAAI Conf Weblogs Soc Media. 2009;8:361–2.
16. Shavit Y, Lio P. CytoHiC: a cytoscape plugin for visual comparison of Hi-C networks. Bioinformatics. 2013;29(9):1206–7.
17. Mizuguchi T, Fudenberg G, Mehta S, Belton JM, Taneja N, Folco HD, FitzGerald P, Dekker J, Mirny L, Barrowman J, Grewal SI. Cohesin-depend-ent globules and heterochromatin shape 3D genome architecture in S. pombe. Nature. 2014;516(7531):432–5.
18. Tanizawa H, Kim KD, Iwasaki O. Noma KI. Architectural alterations of the fission yeast genome during the cell cycle. Nat Struct Mol Biol. 2017;24(11):965–76.
19. Saldanha AJ. Java treeview–extensible visualization of microarray data. Bioinformatics. 2004;20(17):3246–8.
20. Heinz S, Benner C, Spann N, Bertolino E, Lin YC, Laslo P, Cheng JX, Murre C, Singh H, Glass CK. Simple combinations of lineage-determining transcrip-tion factors prime cis-regulatory elements required for macrophage and B cell identities. Mol Cell. 2010;38(4):576–89.
21. Jacomy M, Venturini T, Heymann S, Bastian M. ForceAtlas2, a continuous graph layout algorithm for handy network visualization designed for the gephi software. PLoS ONE. 2014;9(6):98679.
22. Mizuguchi T, Barrowman J, Grewal SI. Chromosome domain architec-ture and dynamic organization of the fission yeast genome. FEBS Lett. 2015;589(20 part A);2975–86.
23. Molnar M, Kleckner N. Examination of interchromosomal interactions in vegetatively growing diploid Schizosaccharomyces pombe cells by Cre/ loxP site-specific recombination. Genetics. 2008;178(1):99–112. 24. Scherthan H, Bähler J, Kohli J. Dynamics of chromosome