R E S E A R C H A R T I C L E
Open Access
Normal breast tissue DNA methylation
differences at regulatory elements are
associated with the cancer risk factor age
Kevin C. Johnson
1,2,3, E. Andres Houseman
4, Jessica E. King
1,2and Brock C. Christensen
1,2,5*Abstract
Background:The underlying biological mechanisms through which epidemiologically defined breast cancer risk factors contribute to disease risk remain poorly understood. Identification of the molecular changes associated with cancer risk factors in normal tissues may aid in determining the earliest events of carcinogenesis and informing cancer prevention strategies.
Methods:Here we investigated the impact cancer risk factors have on the normal breast epigenome by analyzing DNA methylation genome-wide (Infinium 450 K array) in cancer-free women from the Susan G. Komen Tissue Bank (n= 100). We tested the relation of established breast cancer risk factors, age, body mass index, parity, and family history of disease, with DNA methylation adjusting for potential variation in cell-type proportions.
Results:We identified 787 cytosine-guanine dinucleotide (CpG) sites that demonstrated significant associations (Q value <0.01) with subject age. Notably, DNA methylation was not strongly associated with the other evaluated breast cancer risk factors. Age-related DNA methylation changes are primarily increases in methylation enriched at breast epithelial cell enhancer regions (P= 7.1E-20), and binding sites of chromatin remodelers (MYC and CTCF). We validated the age-related associations in two independent populations, using normal breast tissue samples (n= 18) and samples of normal tissue adjacent to tumor tissue (n= 97). The genomic regions classified as age-related were more likely to be regions altered in both pre-invasive (n= 40,P= 3.0E-03) and invasive breast tumors (n= 731,P= 1.1E-13).
Conclusions:DNA methylation changes with age occur at regulatory regions, and are further exacerbated in cancer, suggesting that age influences breast cancer risk in part through its contribution to epigenetic dysregulation in normal breast tissue.
Keywords:Normal breast, DNA methylation, Aging, 5mC, Risk factors, Reference-free, Breast cancer, Epigenetics, Epigenetic drift
Background
An effective way to decrease breast cancer-related mor-bidity and mortality is to identify individuals who may be at increased risk of developing breast cancer and apply early intervention strategies. In addition to inher-ited gene mutations, there are several demographic fac-tors that are associated with an increased risk of breast cancer including increasing age, being overweight after
menopause, alcohol intake, having never been pregnant (that is, nulliparous), earlier age at menarche, and a fam-ily history of breast cancer [1–4]. However, the under-lying biologic mechanism(s) through which many of these epidemiologically defined breast cancer risk factors contribute to carcinogenesis remains unclear.
Biomarkers strongly associated with breast cancer risk factors provide an opportunity to understand cancer devel-opment. One such potential biomarker investigated for its role in the early detection of breast cancer is DNA methyla-tion. DNA methylation is the covalent addition of a methyl group to cytosine, often in the context of a cytosine followed by a guanine in the 5' to 3' direction (that is, a * Correspondence:[email protected]
1
Department of Epidemiology, Geisel School of Medicine at Dartmouth, Lebanon, NH 03756, USA
2Department of Molecular and Systems Biology, Geisel School of Medicine at Dartmouth, Lebanon, NH 03756, USA
Full list of author information is available at the end of the article
cytosine-guanine dinucleotide (CpG)), and is necessary for cell-type-specific differentiation, including in the mammary gland [5, 6]. DNA methylation is a stable, yet modifiable epigenetic modification and DNA methylation alterations are known to occur early in breast carcinogenesis [7, 8]. It has been hypothesized that disease risk factors may mediate their disease-predisposing effects through perturbation of epigenomic control. Candidate gene studies in normal breast tissues indicate that DNA methylation changes are related to age and to other known breast cancer risk fac-tors. For example, women without breast cancer, but at high risk (Gail model score) are more likely to have aber-rant methylation of the tumor suppressor genes APCand RASSF1compared with women at low risk [9]. In another candidate gene study of normal breast tissue, the same group observed thatRASSF1methylation is associated with breast cancer risk level, and that increasing parity is associ-ated with decreasedAPCmethylation [10]. More recently, a study identified cancer-related field defects in DNA methylation based on study of both normal breast tissues from disease-free subjects and tumor-adjacent normal breast tissues [11]. In addition, preliminary results from an-other study provide evidence that genome-wide age-related DNA methylation changes in tumor-adjacent normal breast tissues are more likely to be altered in breast tumors than in randomly selected regions [12]. However, the relation-ship between breast cancer risk factors and DNA methyla-tion changes in normal breast tissue from disease-free subjects remains unclear.
Here we extended the foundational work to tissues from disease-free women with detailed breast cancer risk factor data and applied more comprehensive epigenomic profil-ing methods. We tested the relationship between DNA methylation patterns and breast cancer risk factors such as age, body mass index (BMI), and reproductive and fam-ily history, using an epigenome-wide association study (EWAS) approach. Importantly, we adjusted for potential variation in cellular proportions across samples. Age is the strongest risk factor for breast cancer and we have shown that the patterns of age-related DNA methylation are dependent upon genomic context and that these age-related methylation patterns were consistent across nor-mal breast tissue from independent populations. We found that these molecular alterations become further al-tered in pre-invasive and invasive cancerous lesions. To-gether, the epigenetic changes we identified here provide insights into how the breast cancer risk factor of age may influence disease development.
Methods
Study population
The discovery population consisted of 100 cancer-free women who donated breast tissue biopsy specimens to the Susan G. Komen Tissue Bank after providing written
informed consent. We selected biospecimens from women with a biopsy that scored for a high proportion of epithelial cells as determined by the Susan G. Komen Tis-sue Bank study pathologist (n= 100) [13]. The sample population was selected for an approximately equal distri-bution of parous and nulliparous women, and to include a wide age range of subjects. Subject demographic and breast cancer risk factors were collected from tissue do-nors using a questionnaire administered by the Susan G. Komen Tissue Bank. Family history of cancer was defined by whether or not the donor had at least one first-degree blood relative (i.e., mother or sister) diagnosed with breast cancer. This work was performed in accordance with the ethical principles in the Declaration of Helsinki.
DNA methylation quantification and normalization
Fresh-frozen tissue samples were manually dissected and DNA was extracted using Qiagen DNeasy Blood and Tis-sue Kit according to the manufacturer’s protocol (Qiagen, Valencia, CA, USA). DNA was quantified using a Qubit fluorometer and 1 ug of DNA was then bisulfite-modified using the EZ DNA methylation kit (Zymo Research, Or-ange, CA, USA) according to the manufacturer’s recom-mended protocol. The resulting material was used as input for the hybridization on the Infinium HumanMethyla-tion450 BeadChip (Illumina, San Diego, CA, USA). Sam-ples were randomized to plates and subjected to epigenome-wide DNA methylation assessment. The methy-lation status for each CpG locus was calculated as the ratio of fluorescent signals (β= Max (M, 0)/[Max(M,0) + Max(U,0) + 100]), ranging from 0 (non-methylated) to 1 (completely methylated), using average probe intensity for the methylated (M) and unmethylated (U) alleles. Normalization and background correction of raw signals was performed using theFunNorm procedure available in the R/Bioconductor package minfi (version 1.10.2) [11]. Illumina probe-type normalization was carried out with beta-mixture quantile normalization (BMIQ) [14]. Prior to analysis we removed CpG sites on sex chromosomes, and those corresponding to probes previously identified as cross-reactive or containing single nucleotide polymor-phisms (SNPs), resulting in 390,292 CpGs remaining for analysis [15].
Validation in independent populations and The Cancer Genome Atlas
same methods outlined above for both ductal carcinoma in situ (n= 55, GSE66313) and invasive ductal carcinoma (n= 749, TCGA) to compare DNA methylation differ-ences between normal-adjacent tissue and pre-invasive or invasive lesions [8].
Statistical analysis
All data analysis was conducted in R version 3.3.1.
Cell-mixture deconvolution
Differences in cellular composition across samples repre-sent a potential confounder when testing associations be-tween DNA methylation and quantitative traits in EWAS [17]. Cellular proportions for each sample can be esti-mated through cytometric methods or by applying cell mixture deconvolution algorithms to DNA methylation measurements [18, 19]. Cellular proportions can then be incorporated into a statistical model as covariates to adjust for potential cellular heterogeneity. In the absence of dir-ect cell counts or tissue-specific reference DNA methy-lomes, statistical methods that account for cell proportion variability across tissue samples without a reference DNA methylome have been widely used [18, 20–23]. To per-form a reference-free EWAS we used the R package RefFreeEWAS to deconvolute the cellular populations present in the tissue biopsy samples using DNA methyla-tion data as detailed previously in Houseman et al. [23]. Briefly, this method seeks to represent the largest axes of variation in the DNA methylation data set and decom-poses the DNA methylation data for a sample of heteroge-neous cell populations into its constituent methylomes. As a convex variant of non-negative matrix factorization, the RefFreeEWAS method is similar to approaches used to deconvolute gene expression levels in heterogeneous tumor tissues [24, 25]. In the present study, we selected the 10,000 most variable CpGs in each data set and used a bootstrap technique (specifically sampled the specimens with replacement 1000 times) to estimate the optimal number of putative cell types (K). The optimal number of cell-types defined in each data set was: K = 6 (Komen), K = 10 (TCGA adjacent normal), and K = 2 (NDRI normal breast). The discrepancy in estimated cell-types for each population can be explained in part by the sample size (i.e., small for the NDRI population) and potential epige-nomic field defects in normal-adjacent to tumor tissue (i.e., TCGA).
Analysis of CpG-specific associations
We used a multivariable linear models for microarray data (limma) procedure as described in the R/biocon-ductor librarylimma[26] to model CpG-specific associ-ations between logit-transformed beta values (i.e., M values) and breast cancer risk factors (e.g., age, BMI, par-ity). Genome-wide significance was determined by taking
into account the false discovery rate with a threshold of statistical significance set at Q= 0.01. We ran separate multivariate limma models both unadjusted and adjusted for putative cell proportions to assess the impact of cell proportion differences on significant associations and effect-size estimates. To identify loci that may be most confounded by differences in cell type we calculated the difference in the effect-size estimates (i.e., delta coeffi-cient value) between the cell-type unadjusted and ad-justed models.
Associations with metadata
To test the associations between putative cellular propor-tions and subject metadata (e.g., age) we applied the methods described in Houseman et al. to fit a quasi-binomial model for each putative cell-type across the data set [23]. More specifically, for each estimated value of K (that is, total number of cell types), we generated a model for each cell type (1 to K) and used the minimumPvalue. We then computed the permutation distribution of these minimumPvalues (spanning all potential values of K).
Genomic region enrichment
To assess the enrichment of risk-factor-related CpG sites at cell-type-specific histone modifications we used the eFORGEv1.2 tool with the selected option of all H3 marks measured for the consolidated Roadmap to Epige-nomics data set [27]. To examine whether risk-factor-related CpGs were associated with transcription factor binding sites in ENCODE data we used the Locus Over-lap Analysis (LOLA) software [28]. In this analysis, our query input set of genomic regions to be tested for en-richment were the genomic locations of the risk-factor-related CpG sites (Q< 0.01) and the background set was the genomic locations of the 390,262 CpGs used in the entire analysis. For the LOLA, the ENCODE transcrip-tion factor binding sites included 42 different chromatin immunoprecipitation sequencing experiments.
Epigenetic clock analysis
DNA methylation age (biological age) of the Komen breast tissues was calculated using the Horvath and epi-genetic timer of cancer (EpiTOC) methods [29, 30].
Results
Differential DNA methylation is associated with breast cancer risk factors in normal breast tissues
and the remaining 44% were nulliparous. To test the hy-pothesis that DNA methylation differences in normal breast tissue are related to known breast cancer risk fac-tors we used the approach outlined in Additional file 1. Using the RefFreeEWAS deconvolution algorithm, we identified the optimal number of putative cell-types as K = 6 as this estimate minimized the deviance of the bootstraps (see “Methods” and Additional file 2A). To investigate whether the heterogeneity in cellular propor-tions across samples was associated with phenotypic var-iables (e.g., subject age) we applied a quasi-binomial model for each subject. To avoid dependence on the se-lection of K (putative cell-types) we examined associa-tions over a range of evaluated K using a permutation test (1000 permutations) for inference of each pheno-typic variable. As shown in Additional file 2B, estimated cell mixture proportions were significantly associated with subject age (permutation P value = 2.0E-03), but not subject BMI or parity (Additional file 2B).
To study the relationship between DNA methylation and breast cancer risk factors we applied both un-adjusted and cell-type-un-adjusted linear models for micro-array (limma) to examine the influence of subject age, BMI, and parity on the DNA methylome. Since the esti-mated cellular proportions for each sample sum to nearly one, we included all but the estimated cell-type with the smallest proportion to avoid multi-collinearity in our models. In a multivariable limma model adjusted for differences in cellular mixtures, 787 CpG sites were significantly associated with age, 0 CpG sites were
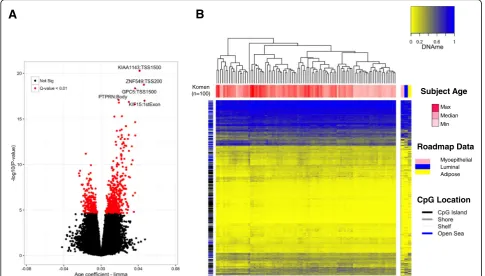
associated with BMI, and 0 CpG sites were associated with parity, after correcting for multiple hypothesis test-ing (Q <0.01, Fig. 1a). The full list of 787 CpG sites with genome annotation and statistical results is presented in Additional file 3. Notably, age-related DNA methylation alterations were predominantly hypermethylation events, i.e., increased DNA methylation was associated with in-creased age (545 CpG sites, 69.3%). To assess the impact that adjusting for cellular proportions had on the identi-fication of significant associations and effect sizes, we computed the difference between the coefficients (i.e., a delta coefficient value) at each CpG for the models un-adjusted and un-adjusted for cell type. A large CpG-specific delta value provides evidence for associations between DNA methylation and risk factors that may be most confounded by differences in cellular proportions. Visualization of CpG-specific P values and coefficients from cell-type unadjusted and adjusted models demon-strated that adjustment attenuated both the strength and magnitude of CpG-specific associations genome-wide (Additional file 4). Moreover, the number of significant associations (Q< 0.01) in the unadjusted limma model for subject age was 4099 CpG sites compared with 787 from the adjusted model, suggesting that a large number of false-positives are likely to be reported when differ-ences in cell proportions are not considered (Additional file 4A-C). In addition, at the age-related CpG sites (n= 787, Q< 0.01) the DNA methylation patterns across purified cell populations of myoepthial cells, luminal cells, and adipocytes were consistent, suggesting that age-related changes may occur largely independent of tissue type in the normal human breast (Fig. 1b).
There were missing data on family history in 10 individ-uals in the present data set. To explore whether family history was associated with DNA methylation differences we applied the aforementioned limma approach un-adjusted and un-adjusted for cellular proportions (n= 90), and found no significant associations (Q> 0.01) between family history and DNA methylation differences after cor-recting for multiple comparisons (Additional file 4D).
Independent validation of age-associated methylation
[image:4.595.57.291.98.364.2]We next moved to validate our age-related DNA methy-lation findings in two independent 450 K data sets from 97 normal adjacent-to-tumor breast samples (TCGA) and 18 normal breast tissues from disease-free women (NDRI, GSE74214). Subject demographics and charac-teristics for these two data sets are presented in Table 2. In a reference-free cell-mixtuadjusted limma re-stricted to the 787 CpG sites identified in the discovery (Komen) population we observed that 548 CpG sites (TCGA, 69.4%) were differentially methylated in a direc-tion consistent with the discovery populadirec-tion at a nom-inal P value <0.05 (Additional file 5A). Similarly, we
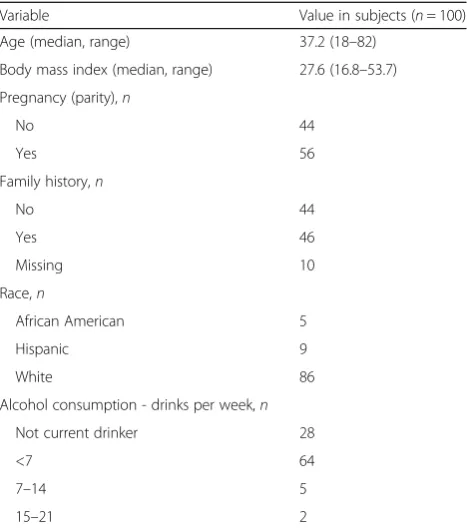
Table 1Subject demographics and characteristics
Variable Value in subjects (n= 100)
Age (median, range) 37.2 (18–82)
Body mass index (median, range) 27.6 (16.8–53.7)
Pregnancy (parity),n
No 44
Yes 56
Family history,n
No 44
Yes 46
Missing 10
Race,n
African American 5
Hispanic 9
White 86
Alcohol consumption - drinks per week,n
Not current drinker 28
<7 64
7–14 5
observed highly consistent results in the NDRI popula-tion (389 out of 787 CpG sites, 49.4%) (Addipopula-tional file 5B). Strikingly, there were 345 CpG sites (43.8%) in the TCGA data set and 109 CpGs (13.9%) in the smaller NDRI data set that were considered significant at the stringent Bonferroni threshold for multiple comparisons (Additional file 5A and B, P< 6.4E-05). In both valid-ation cohorts, putative cell-mixture proportions were significantly associated with subject age (permutation P < 0.05) (Additional files 5C-D).
While it is appreciated that DNA methylation can mod-ify chromatin structure and distally regulate the transcrip-tome, the most well-defined function of DNA methylation is the cis-regulation of gene transcription [31]. In the present study, sample-matched RNA-sequencing data were available only for a subset of the subjects from the TCGA data set (n= 88). Many of the age-related CpG sites that localize to gene regions (n= 630 CpG sites) demon-strated strong associations with gene expression (259 CpG sites atP< 0.05, Additional file 6A). The direction of the CpG-gene correlations demonstrated a dependency upon genomic context (Additional file 6B). For example, CpG sites tended to be negatively correlated in the promoter region, while there was an even distribution of positive and negative correlation in the gene body (that is, intron and exon) regions (Additional file 6B).
Age-associated DNA methylation sites are enriched for regulatory regions
To provide a broader biological interpretation of age-related DNA methylation we next sought to identify enrichment of these genomic locations in gene regulatory regions, such as tissue-specific histone marks and
A
B
Max Median Min Subject Age
CpG Location Myoepithelial Luminal Adipose Roadmap Data Komen
(n=100)
[image:5.595.56.542.89.365.2]Fig. 1Subject age is strongly associated with DNA methylation in normal breast tissue independent of cell type.aIn the volcano plot, each point represents the associations between DNA methylation and age from cell-type-adjusted multivariable linear models for microarray data (limma) at individual cytosine-guanine dinucleotide (CpG) sites. Increasing -log10 (Pvalue) values on they-axisshow increasing statistical significance and limma effect size on thex-axispositioned away from thezero valuereveal the largest DNA methylation changes with age. Significant CpG sites are indicated inred(Qvalue < 0.01). The gene and gene regions are presented for the five CpG sites with the greatest significance.bUnsupervised clustering of DNA methylation values at age-related CpG sites (Komen,n= 100) visualized alongside CpGs measured in specific cell-types form the Roadmap to Epigenomics data set (n= 691 CpG sites). Eachcolumnrepresents a given tissue sample and each CpG is presented in rows
Table 2Independent population subject characteristics
NDRI
Mean (range) n= 18
Age 49 (13–80)
BMI 28.3 (14.59–62.73)
TCGA
Mean (range) n= 97
Age 57.57 (28−90)
BMI Unavailable
NDRI National Disease Research Interchange,TCGAThe Cancer Genome Atlas,
[image:5.595.57.293.604.714.2]transcription factor binding sites (TFBS). First, we employed the eFORGE tool to identify cell-type-specific signals in diverse tissues profiled by the Roadmap to Epige-nomics Consortium. We observed robust enrichment of H3K4me1, histone modifications that mark enhancers, in both fetal tissues and mammary epithelial cells (Q< 1.9E-37), and modest associations with other histone modifica-tions (i.e., H3K4me3, H3K27me3) (Additional file 7). Fish-er’s exact test confirmed that age-related CpGs localize to enhancer elements specifically in mammary myoepithelial cells (H3K4me1, Roadmap) (OR = 2.00 CI (1.73–2.33),P = 7.1E-20). We next used the genomic coordinates of age-related CpGs as a query set against the background of the 450 K array in LOLA scanning for enrichments of TFBSs. Since hypermethylation events are likely to be biologically distinct from hypomethylation events at TFBS we stratified our LOLA into a hypermethylation and a hypomethylation enrichment analysis (Fig. 2a and b). In the hypermethyla-tion analysis, we observed a striking number of significant enrichments for CpG sites that were hypermethylated with age (14 TFBS, Q< 0.01) and hypomethylated with age (8 TFBS,Q< 0.01) (Additional file 8A and B). Among several of the top-ranking results presented in Fig. 2a, MYC and CTCF, which are critical regulators of chromatin architec-ture were enriched among hypermethylated CpG sites, while hypomethylated CpGs localize to binding sites of transcriptional activators c-Fos and Stat-3 [32–35].
Accelerated epigenetic aging of human breast tissue
It has been recognized that DNA methylation patterns change in a tissue-specific manner as an individual ages [29]. Previous studies have found that measurements of DNA methylation have the ability to accurately estimate an individual’s age and that observed differences be-tween predicted DNA methylation age (that is, biological age) and chronological age are associated with disease-risk factors [29, 30, 36, 37]. Further, it has been observed that DNA methylation age predictions in the human breast demonstrate age acceleration when compared with other tissues, suggesting that normal breast tissue tends to age more quickly than other tissues [29].
To examine whether the subject-specific differences be-tween biological and chronological age (that is, age accel-eration) are associated with breast cancer risk factors we first calculated DNA methylation age from the 100 Komen normal breast tissue samples using two distinct epigenetic clocks [29, 30]. Briefly, the“Horvath epigenetic clock”uses elastic net regression to integrate DNA methylation infor-mation from 353 CpG sites to generate a multi-tissue age predictor. The second method,“epiTOC”, is an epigenetic clock that incorporates prior biological knowledge into a mathematical model to generate an estimate of mitotic di-visions using 385 CpG sites. Notably, there was limited overlap between the 787 age-related CpGs and Horvath (17 CpGs) and EpiTOC (3 CpGs). In analyses with the
A
Genomic locations hypermethylatedB
with age (n = 545 CpG sites)
Genomic locations hypomethylated with age (n = 242 CpG sites)
[image:6.595.61.537.430.704.2]Horvath clock, we observed strong positive correlation be-tween chronological age and the DNA methylation age of the Komen breast tissues, with a Spearman correlation co-efficient of 0.95 (P= 2.83E-52, Fig. 3a). In univariate ana-lyses of age acceleration, defined as the residual resulting from regressing DNA methylation age (Horvath clock) on chronological age, and the cancer risk factors listed in Table 1, we observed a significant positive association only with race (African American, n= 5 subjects, P= 3.5E-02). Age acceleration was not associated with any other of the evaluated risk factors (P> 0.05). In a multivariate model considering all measured cancer risk factors, we found that race was significantly associated with increased epigenetic aging (African American P= 4.9E-02). In contrast to the Horvath clock, there was no significant correlation be-tween chronological age and epiTOC-predicted age (P= 7.5E-01, Fig. 3b). Nonetheless, the epiTOC estimated bio-logical age was also positively associated with race in uni-variate analyses (African American P= 2.1E-02, Hispanic P= 2.8E-02) and in multivariate models including all risk factors shown in Table 1 (African American P= 2.7E-02, Hispanic P= 2.7E-02). The remaining breast cancer risk factors were not associated with epiTOC-defined bio-logical aging in either univariate or multivariate models (P> 0.05).
Age-related DNA methylation is further deregulated in pre-invasive and invasive breast cancer
To ascertain whether differences in DNA methylation in relation to disease risk factors are relevant for the devel-opment of cancer, we compared DNA methylation in breast tumors with adjacent normal tissue in both pre-invasive and pre-invasive cancer, at the 787 age-related CpGs. In pre-invasive lesions (ductal carcinoma in situ, DCIS), there were 268 CpG sites among 775 CpGs avail-able for measure (34.5%) that demonstrated differential methylation between DCIS and normal tissue using limma models adjusted for subject age Fig. 4a (P< 0.05). Importantly, changes at the age-related CpGs were greater (Additional file 9A and B) and demonstrated stronger associations than a randomly selected set of CpG sites with similar properties regarding their loca-tion within CpG islands Fig. 4b (Kolmogorov-Smirnov test,P =3.0E-03). If the epigenetic defects in age-related DNA methylation are further deregulated in pre-invasive breast cancer it would be expected that progressive changes would occur in invasive breast cancer. To test this, we assessed differential methylation using limma models adjusted for subject age in TCGA breast cancer data set. A large proportion of the age-related CpGs ex-hibited significant differential DNA methylation changes
A
Horvath Epigenetic ClockKomen
B
epiTOC – Yang et al Komen
[image:7.595.56.539.407.674.2]in breast cancer (642 out of 787 CpGs (81.6%,P< 0.05)) (Fig. 4c). Again, we found that the age-related changes demonstrated greater DNA methylation differences (Additional file 9C and D) and stronger associations than a randomly selected set of CpGs with matching genomic distribution (Kolmogorov-Smirnov test, P = 1.1E-13) (Fig. 4d).
Discussion
In this study, we identified perturbations in the normal breast epigenome that may contribute to age-related in-creases in breast cancer risk. Age is the strongest demo-graphic risk factor for breast cancer and is robustly associated with DNA methylation changes. Emerging lit-erature has demonstrated that aging exerts its profound effects on the epigenome through a lifetime accumulation of environmental exposures that interfere with the place-ment or removal of methyl groups [11, 12, 38, 39]. Here, we have described that the consistent changes in breast DNA methylation are not randomly distributed through-out the genome. Instead, age-related DNA hypermethyla-tion events are enriched for breast epithelial-specific enhancer regions and the binding sites of chromatin remodelers, while hypomethylation was noted at tran-scriptional activators. The enrichment of modifications at critical regulators of cellular phenotype provide novel
insights into how cell-type-specific epigenetic states change over time and may predispose cells to neoplastic transformation. Our analysis revealed that further DNA methylation alterations to these genomic regions in pre-invasive and pre-invasive disease may contribute to the restriction of cellular differentiation and disruption of transcriptional control observed in cancerous lesions.
The ability to produce reliable biological age predictions in an individual and in specific tissues holds promise for monitoring health, predicting disease risk, and providing insights into modifiable lifestyle factors that promote healthy aging. Indeed, discrepancies between chrono-logical and biochrono-logical age may suggest deregulation in DNA methylation marks and indicate increased disease risk. Horvath et al. demonstrated this phenomenon of age acceleration in a recent publication, whereby researchers found that the epigenetic age of the liver was increased by 2.7 years for every 10 units of BMI [36]. Using 450 K methylation arrays we have applied the Horvath epigenetic clock algorithm and epiTOC tool to 100 normal breast tissue samples to determine the DNA methylation age of each of these tissues. While there was an association be-tween age acceleration and race in the Komen dataset, there were only five African American women, and this association requires additional analyses. Profiling a larger number of breast tissue samples from African-American
[image:8.595.60.540.87.377.2]women would allow investigation of whether genetic dif-ferences are associated with accelerated aging. In future studies, the ability to accurately assess biological age, in breast tissue samples from larger longitudinal studies with a greater number of women of diverse racial and ethnic backgrounds, may aid researchers in the determination of factors that aim to assess and prevent disease.
While our findings provide strong evidence for a link between epigenetic deregulation and the two processes of aging and cancer, our study had a few limitations. For example, the questionnaire administered by the Susan G. Komen Tissue Bank is well-equipped to accurately clas-sify a subject’s age, while other cancer risk factors such as average alcohol consumption may be impacted by re-call bias. This same limitation applies to the missing data on family history in 10 subjects. Further, the small num-ber of non-white subjects decreased the power to iden-tify relationships between age acceleration and race. Separately, although the RefFreeEWAS method effect-ively accounts for the largest sources of variation in the DNA methylation data set, the method is unable to dis-cern the particular cell types in which epigenetic changes occur. That said, the robustness of cell-type-independent observation across multiple populations and progressive alterations in cancer gives us confidence that a subset of the epigenetic defects may be important in carcinogen-esis. To this end, future prospective studies are needed to investigate the relationship between DNA methylation in normal tissue and the risk of developing breast can-cer. Finally, mechanistic studies will also be needed to elucidate the epigenetic contribution to increased breast cancer risk. Research aimed at early detection and dis-ease prevention would serve to relieve patient morbidity and reduce the cost burden to the healthcare system.
In summary, we have shown that epigenetic ences are strongly associated with aging and these differ-ences may reflect epigenetic defects that predispose women at an older age to an increased risk of breast cancer.
Conclusions
Epidemiological studies have firmly established factors of personal choice and factors beyond personal choice that alter the risk of breast cancer. Established risk fac-tors for breast cancer include age, reproductive and family history, and BMI [4, 40]. Indeed, modeled breast cancer risk factors have been shown to account for ap-proximately half of breast cancer cases [41, 42]. How-ever, the biological mechanisms by which specific risk factors impact disease risk are not well-understood. In this study population, we did not observe significant as-sociations between BMI or parity and genome-wide DNA methylation. However, we observed consistent cell-type-independent age-related DNA methylation in
normal breast tissue from multiple populations. The genomic locations of age-related DNA methylation were more likely to be found in gene regulatory ele-ments of breast epithelial cells, suggesting a loss of cel-lular state control as an individual ages. Further, we demonstrated additional support for a link between age-related DNA methylation and cancer, as age-related CpG sites were more likely to exhibit greater alterations in both pre-invasive and invasive breast cancer. To-gether, our research suggests that DNA methylation changes in aging shift the epigenetic state toward a compromised molecular phenotype, creating a novel link between the risk factor of age and the potential ori-gins of disease in breast cancer.
Additional files
Additional file 1:Analytic framework for reference-free epigenome-wide association study between DNA methylation and breast cancer risk factors. (PPTX 77 kb)
Additional file 2:Estimation of cellular proportions and its association with subject covariates.AHierarchal clustering and heat map representation of cellular proportions of putative cell-types (K = 6) in Komen normal breast tissue (n= 100).BMetadata associations with cellu-lar proportions when K is estimated over a range of cell types. Permuta-tionPvalues presented adjacent to thecolored linerepresenting each covariate (e.g.,redfor age, permutationP= 2.0E-03). (PPTX 424 kb)
Additional file 3:Age-related CpGs and genomic annotation. (XLSX 169 kb)
Additional file 4:Volcano plots representing both cell-type proportions adjusted and unadjusted limma models for each covariate evaluated in the present study. In each cell-type-adjusted volcano plot (right panels) the intensity ofblueandred pointsindicate shift in the effect size of the limma coefficient estimate between adjusted and unadjusted models. That is,gray pointsin theright panelsindicate CpG sites that are not im-pacted by differences in cellular proportions across subject age (n =100) (A), subject BMI (n= 100) (B), parity status (n=100) (C), and family history of disease (n= 90)(D). (PPTX 1367 kb)
Additional file 5:Age-related DNA methylation in the human normal breast validated in adjacent-to-tumor normal breast from The Cancer Genome Atlas (TCGA) population (n= 97) (A), and normal breast tissue from the National Disease Research Interchange (NDRI) population (n= 18) (B). Volcano plots indicate CpG-specific associations between DNA methylation and subject age. Permutation testing of subject covariate data across estimated cell-types (K) in the TCGA population (C) and NDRI population (D). (PPTX 923 kb)
Additional file 6:Age-related CpG sites are associated with gene transcription.ADistribution ofPvalues for CpG-gene expression correla-tions.BGenomic-context dependency between DNA methylation and gene expression. Gene names for the 20 CpG-gene regions with the strongest associations are presented alongside its respective coefficient-P -value bubble. (PPTX 758 kb)
Additional file 7:Complete results from eFORGE analysis of age-related CpGs (n= 787). (XLSX 136 kb)
Additional file 8:Complete results from LOLA analysis of age-related CpGs (n= 787). (XLSX 71 kb)
Abbreviations
5mC:5-methylcytosine; BMI: Body mass index; CpG: Cytosine-guanine dinucleotide; DCIS: Ductal carcinoma in situ; ENCODE: Encyclopedia of DNA Elements; epiTOC: Epigenetic timer of cancer; EWAS: Epigenome-wide association study; GEO: Gene Expression Omnibus; IDAT: Intensity data file; limma: Linear models for microarray data; LOLA: Locus Overlap Analysis; NDRI: National Disease Research Interchange; PCGT: Polycomb group protein target; RefFreeEWAS: Reference-free DNA methylation mixture deconvolution epigenome-wide association study; TCGA: The Cancer Genome Atlas; TFBS: Transcription factor binding site; TSS: Transcriptional start site
Acknowledgements
Samples from the Susan G. Komen Tissue Bank at the Indiana University Simon Cancer Center were used in this study. We thank contributors, including Indiana University, who collected samples used in this study, as well as donors and their families, whose help and participation made this work possible.
Funding
The research reported in this publication was supported by the Center for Molecular Epidemiology COBRE program with grant funds from the National Institute of General Medical Sciences (NIGMS) of the National Institutes of Health under award number P20 GM104416 (PI: Margaret R. Karagas). This work was supported by the National Institutes of Health grant numbers R01DE022772 to BCC and R01MH094609 to EAH.
Availability of data and materials
The DNA methylation microarray data from healthy Komen Tissue Bank donors that support the findings of this paper have been deposited in the Gene Expression Omnibus [GEO:GSE88883] (http:// www.ncbi.nlm.nih.gov/geo/). The DNA methylation microarray data from an independent population providing non-diseased breast tissue [1] have been deposited in the Gene Expression Omnibus
[GEO:GSE74214]. Level-1 IDAT and level-3 normalized RNASeqV2 rsem.-genes.normalized_results were downloaded from The Cancer Genome Atlas breast cancer project (TCGA, http://cancergenome.nih.gov). R code used for analyses presented in this manuscript has been depos-ited in the“Normal-Breast-Methylation”repository on github (https:// github.com/Christensen-Lab-Dartmouth).
Authors’contributions
KCJ conceived and designed the approach, carried out laboratory experiments, performed statistical analyses, interpreted the results, and wrote and revised the manuscript. EAH interpreted the results, generated the statistical framework, and revised the manuscript. JEK carried out laboratory experiments and revised the manuscript. BCC conceived and designed the approach, oversaw project development, interpreted the results, and revised the manuscript. All authors have read and approved the final manuscript.
Ethics approval and consent to participate
Subject consent and approval from the Dartmouth College Institutional Review Board were obtained prior to the use of these tissues for research purposes (number 00023420). This work was performed in accordance with the ethical principles in the Declaration of Helsinki.
Consent for publication Not applicable.
Competing interests
The authors declare that they have no competing interests.
Publisher’s Note
Springer Nature remains neutral with regard to jurisdictional claims in published maps and institutional affiliations.
Author details
1Department of Epidemiology, Geisel School of Medicine at Dartmouth, Lebanon, NH 03756, USA.2Department of Molecular and Systems Biology,
Geisel School of Medicine at Dartmouth, Lebanon, NH 03756, USA.3The Jackson Laboratory for Genomic Medicine, Farmington, CT 06032, USA. 4Department of Biostatistics, College of Public Health and Human Sciences, Oregon State University, Corvallis, OR 97331, USA.5Department of Community and Family Medicine, Geisel School of Medicine at Dartmouth, Lebanon, NH 03756, USA.
Received: 14 February 2017 Accepted: 21 June 2017
References
1 Hamajima N, Hirose K, Tajima K, Rohan T, Calle EE, Heath Jr CW, Coates RJ, Liff JM, Talamini R, Chantarakul N, et al. Alcohol, tobacco and breast cancer– collaborative reanalysis of individual data from 53 epidemiological studies, including 58,515 women with breast cancer and 95,067 women without the disease. Br J Cancer. 2002;87(11):1234–45.
2 Key J, Hodgson S, Omar RZ, Jensen TK, Thompson SG, Boobis AR, Davies DS, Elliott P. Meta-analysis of studies of alcohol and breast cancer with consideration of the methodological issues. Cancer Causes Control. 2006; 17(6):759–70.
3 Larsson SC, Giovannucci E, Wolk A. Folate and risk of breast cancer: a meta-analysis. J Natl Cancer Inst. 2007;99(1):64–76.
4 Illingworth R, Kerr A, Desousa D, Jorgensen H, Ellis P, Stalker J, Jackson D, Clee C, Plumb R, Rogers J, et al. A novel CpG island set identifies tissue-specific methylation at developmental gene loci. PLoS Biol. 2008;6(1), e22. 5 Carmichael AR, Bates T. Obesity and breast cancer: a review of the literature.
Breast. 2004;13(2):85–92.
6 Jaenisch R. DNA methylation and imprinting: why bother? Trends Genet. 1997;13(8):323–9.
7 Fleischer T, Frigessi A, Johnson KC, Edvardsen H, Touleimat N, Klajic J, Riis ML, Haakensen VD, Warnberg F, Naume B, et al. Genome-wide DNA methylation profiles in progression to in situ and invasive carcinoma of the breast with impact on gene transcription and prognosis. Genome Biol. 2014;15(8):435.
8 Johnson KC, Koestler DC, Fleischer T, Chen P, Jenson EG, Marotti JD, Onega T, Kristensen VN, Christensen BC. DNA methylation in ductal carcinoma in situ related with future development of invasive breast cancer. Clin Epigenetics. 2015;7(1):75.
9 Lewis CM, Cler LR, Bu DW, Zochbauer-Muller S, Milchgrub S, Naftalis EZ, Leitch AM, Minna JD, Euhus DM. Promoter hypermethylation in benign breast epithelium in relation to predicted breast cancer risk. Clin Cancer Res. 2005;11(1):166–72.
10 Euhus DM, Bu D, Milchgrub S, Xie XJ, Bian A, Leitch AM, Lewis CM. DNA methylation in benign breast epithelium in relation to age and breast cancer risk. Cancer Epidemiol Biomarkers Prev. 2008;17(5):1051–9. 11 Teschendorff AE, Gao Y, Jones A, Ruebner M, Beckmann MW, Wachter DL,
Fasching PA, Widschwendter M. DNA methylation outliers in normal breast tissue identify field defects that are enriched in cancer. Nat Commun. 2016; 7:10478.
12 Johnson KC, Koestler DC, Cheng C, Christensen BC. Age-related DNA methylation in normal breast tissue and its relationship with invasive breast tumor methylation. Epigenetics. 2014;9(2):268–75.
13 Sherman ME, Figueroa JD, Henry JE, Clare SE, Rufenbarger C, Storniolo AM. The Susan G. Komen for the Cure Tissue Bank at the IU Simon Cancer Center: a unique resource for defining the "molecular histology" of the breast. Cancer Prev Res. 2012;5(4):528–35.
14 Teschendorff AE, Marabita F, Lechner M, Bartlett T, Tegner J, Gomez-Cabrero D, Beck S. A beta-mixture quantile normalization method for correcting probe design bias in Illumina Infinium 450 k DNA methylation data. Bioinformatics. 2013;29(2):189–96.
15 Chen YA, Lemire M, Choufani S, Butcher DT, Grafodatskaya D, Zanke BW, Gallinger S, Hudson TJ, Weksberg R. Discovery of cross-reactive probes and polymorphic CpGs in the Illumina Infinium HumanMethylation450 microarray. Epigenetics. 2013;8(2):203–9.
16 Cancer Genome Atlas N. Comprehensive molecular portraits of human breast tumours. Nature. 2012;490(7418):61–70.
17 Jaffe AE, Irizarry RA. Accounting for cellular heterogeneity is critical in epigenome-wide association studies. Genome Biol. 2014;15(2):R31. 18 Houseman EA, Molitor J, Marsit CJ. Reference-free cell mixture adjustments
19 Koestler DC, Jones MJ, Usset J, Christensen BC, Butler RA, Kobor MS, Wiencke JK, Kelsey KT. Improving cell mixture deconvolution by identifying optimal DNA methylation libraries (IDOL). BMC bioinformatics. 2016;17(1):120. 20 Agha G, Houseman EA, Kelsey KT, Eaton CB, Buka SL, Loucks EB. Adiposity is
associated with DNA methylation profile in adipose tissue. Int J Epidemiol. 2015;44(4):1277–87.
21 Assenov Y, Muller F, Lutsik P, Walter J, Lengauer T, Bock C. Comprehensive analysis of DNA methylation data with RnBeads. Nat Methods. 2014;11(11):1138–40. 22 Green BB, Karagas MR, Punshon T, Jackson BP, Robbins DJ, Houseman EA,
Marsit CJ. Epigenome-wide assessment of DNA methylation in the placenta and arsenic exposure in the New Hampshire Birth Cohort Study (USA). Environ Health Perspect. 2016;124(8):1253–60.
23 Houseman EA, Kile ML, Christiani DC, Ince TA, Kelsey KT, Marsit CJ. Reference-free deconvolution of DNA methylation data and mediation by cell composition effects. BMC bioinformatics. 2016;17:259.
24 Gaujoux R, Seoighe C. Semi-supervised Nonnegative Matrix Factorization for gene expression deconvolution: a case study. Infect Genet Evol. 2012;12(5):913–21. 25 Teschendorff AE, Zhuang J, Widschwendter M. Independent surrogate
variable analysis to deconvolve confounding factors in large-scale microarray profiling studies. Bioinformatics. 2011;27(11):1496–505. 26 Smyth GK. Linear models and empirical bayes methods for assessing
differential expression in microarray experiments. Stat Appl Genet Mol Biol. 2004;3:Article3.
27 Breeze CE, Paul DS, van Dongen J, Butcher LM, Ambrose JC, Barrett JE, Lowe R, Rakyan VK, Iotchkova V, Frontini M, et al. eFORGE: a tool for identifying cell type-specific signal in epigenomic data. Cell Rep. 2016;17(8):2137–50. 28 Sheffield NC, Bock C. LOLA: enrichment analysis for genomic region sets and
regulatory elements in R and Bioconductor. Bioinformatics. 2016;32(4):587–9. 29 Horvath S. DNA methylation age of human tissues and cell types. Genome
Biol. 2013;14(10):R115.
30 Yang Z, Wong A, Kuh D, Paul DS, Rakyan VK, Leslie RD, Zheng SC, Widschwendter M, Beck S, Teschendorff AE. Correlation of an epigenetic mitotic clock with cancer risk. Genome Biol. 2016;17(1):205.
31 Jones PA. Functions of DNA methylation: islands, start sites, gene bodies and beyond. Nat Rev Genet. 2012;13(7):484–92.
32 Gustems M, Woellmer A, Rothbauer U, Eck SH, Wieland T, Lutter D, Hammerschmidt W. c-Jun/c-Fos heterodimers regulate cellular genes via a newly identified class of methylated DNA sequence motifs. Nucleic Acids Res. 2014;42(5):3059–72.
33 Varlakhanova NV, Knoepfler PS. Acting locally and globally: Myc's ever-expanding roles on chromatin. Cancer Res. 2009;69(19):7487–90. 34 Costantino L, Barlocco D. STAT 3 as a target for cancer drug discovery. Curr
Med Chem. 2008;15(9):834–43.
35 Handoko L, Xu H, Li G, Ngan CY, Chew E, Schnapp M, Lee CW, Ye C, Ping JL, Mulawadi F, et al. CTCF-mediated functional chromatin interactome in pluripotent cells. Nat Genet. 2011;43(7):630–8.
36 Horvath S, Erhart W, Brosch M, Ammerpohl O, von Schonfels W, Ahrens M, Heits N, Bell JT, Tsai PC, Spector TD, et al. Obesity accelerates epigenetic aging of human liver. Proc Natl Acad Sci USA. 2014;111(43):15538–43. 37 Marioni RE, Shah S, McRae AF, Chen BH, Colicino E, Harris SE, Gibson J,
Henders AK, Redmond P, Cox SR, et al. DNA methylation age of blood predicts all-cause mortality in later life. Genome Biol. 2015;16:25.
38 Christensen BC, Houseman EA, Marsit CJ, Zheng S, Wrensch MR, Wiemels JL, Nelson HH, Karagas MR, Padbury JF, Bueno R, et al. Aging and
environmental exposures alter tissue-specific DNA methylation dependent upon CpG island context. PLoS Genet. 2009;5(8), e1000602.
39 Christensen BC, Kelsey KT, Zheng S, Houseman EA, Marsit CJ, Wrensch MR, Wiemels JL, Nelson HH, Karagas MR, Kushi LH, et al. Breast cancer DNA methylation profiles are associated with tumor size and alcohol and folate intake. PLoS Genet. 2010;6(7), e1001043.
40 Gail MH, Brinton LA, Byar DP, Corle DK, Green SB, Schairer C, Mulvihill JJ. Projecting individualized probabilities of developing breast cancer for white females who are being examined annually. J Natl Cancer Inst. 1989;81(24):1879–86.
41 Madigan MP, Ziegler RG, Benichou J, Byrne C, Hoover RN. Proportion of breast cancer cases in the United States explained by well-established risk factors. J Natl Cancer Inst. 1995;87(22):1681–5.
42 van Gemert WA, Lanting CI, Goldbohm RA, van den Brandt PA, Grooters HG, Kampman E, Kiemeney LA, van Leeuwen FE, Monninkhof EM, de Vries E, et al. The proportion of postmenopausal breast cancer cases in the Netherlands attributable to lifestyle-related risk factors. Breast Cancer Res Treat. 2015;152(1):155–62.
• We accept pre-submission inquiries
• Our selector tool helps you to find the most relevant journal
• We provide round the clock customer support
• Convenient online submission
• Thorough peer review
• Inclusion in PubMed and all major indexing services
• Maximum visibility for your research
Submit your manuscript at www.biomedcentral.com/submit