D A T A N O T E
Open Access
A 44K microarray dataset of the changing
transcriptome in developing Atlantic salmon
(
Salmo salar
L.)
Stuart G Jantzen
†, Dan S Sanderson
†, Kris R von Schalburg, Motoshige Yasuike, Francesco Marass and Ben F Koop
*Abstract
Background:Atlantic salmon (Salmo salarL.) is an environmentally and economically important organism and its gene content is reasonably well characterized. From a transcriptional standpoint, it is important to characterize the changes in gene expression over the course of unperturbed early development, from fertilization through to the parr stage.
Findings:S. salarsamples were taken at 17 time points from 2 to 89 days post fertilization. Total RNA was
extracted and cRNA was synthesized and hybridized to a newly developed 44K oligo salmonid microarray platform. Quantified results were subjected to preliminary data analysis and submitted to NCBI’s Gene Expression Omnibus (GEO). Data can be found under the GEO accession number GSE25938. http://www.ncbi.nlm.nih.gov/geo/query/acc. cgi?acc=GSE25938
Conclusions:Throughout the entire period of development, several thousand genes were found to be
differentially regulated. This work represents the trancriptional characterization of a very large geneset that will be extremely valuable in further examination of the transcriptional changes in Atlantic salmon during the first few months of development. The expression profiles can help to annotate salmon genes in addition to being used as references against any number of experimental variables to which developing salmonids might be subjected.
Background
Atlantic salmon (Salmo salarL.) are an environmentally and economically important organism. The genome has been well studied and is currently being fully sequenced [1-4]. In addition, a number of microarrays have been developed for transcription studies ofS. salar[2,5-7]. As a benefit of the extensive characterization of the tran-scriptome ofS. salar, large scale studies of gene expres-sion changes can be undertaken using these microarray platforms [8].
This study is the first to utilize a newly developed 44K oligo salmonid microarray design, one of the first salmo-nid oligo microarrays. This array comprises approxi-mately 22,000 60-mer oligos that were conserved (95% similar) between rainbow trout (Oncorhynchus mykiss) and Atlantic salmon [6] plus 14,866 additional Atlantic
salmon and 5,661 additional rainbow trout contig sequences. The result is a microarray that has a large transcript representation with very low redundancy. The array is composed of oligos based on roughly 80%
S. salarand 20%O. mykisscontigs. 84% of all features are well annotated with fairly stringent hits (e-value cut-off: 1e-10) to public databases (December 17, 2009). The annotation files may be found at the cGRASP microarray page [9]. Efforts to annotate unknown con-tigs will continue.
Library construction, sequence analysis and contig assembly have been described previously [2]. The 14,866 additionalS. salaroligos were all derived from selected contigs compiled in the local database of the authors (August 11, 2009) [10]. These were chosen first from the approximately 10,000 full length cDNAs in the data-base [11]. The remainder were selected from well anno-tated sequences and then from poorly annoanno-tated sequences with an open reading frame longer than 300 bp represented by two or more clones. 5,206 of the * Correspondence: [email protected]
†Contributed equally
Center for Biomedical Research, University of Victoria, Victoria, British Columbia, V8W 3N5, Canada
additionalO. mykisscontig-derived oligos were selected from the set of well annotated sequences in the local database that did not have a clear homologous represen-tative inS. salar. The remaining 455 were selected from annotated NCBI Nucleotide resources (July 21, 2009) [12] with priority given to immune system related sequences. Representative oligos from sequences identi-fied by Gene Ontology (GO) [13] were included. After sequence selection, oligos were derived from the selected contigs by Agilent Technologies (Santa Clara, CA) and were 60 bp in length. The oligo selection pro-cess was biased in favor of 3’ sequences. While the majority of oligos are unique to contigs (i.e. only one spot on the array can be mapped back to a given con-tig), approximately 27% of oligos, including the original 22,000, were derived from the same contig as at least one other oligo. Finally, in situ oligo synthesis and microarray manufacturing was performed by Agilent. Microarray slides are available through Agilent’s eArray platform, with each slide containing four arrays [14].
Due to the very large number of unique features on this platform, a genome-wide exploration of expression levels in salmonids is expected to produce significant and detailed information on many molecular systems. For example, the genetic factors involved in the very early developmental stages of Atlantic salmon are not completely understood. It is therefore of interest to do a thorough examination of S. salar developmental stages from fertilization through to the parr stage, using a tran-scriptomics approach. Recently, another group has used a microarray platform to profile the changes in gene expression during smoltification in Atlantic salmon [15] when freshwater parr make the transition to saltwater smolt. The dataset presented here complements this ear-lier study.
The objective was to comprehensively monitor the sal-monid transcriptome during controlled and unperturbed development. This work complements and facilitates recent efforts to sequence and annotate the Atlantic sal-mon genome. It further provides a resource that identi-fies expression levels of tens of thousands of genes during the course of development. These baseline expression patterns can be used as references in future experiments to examine physiological, reproductive, mutational, and environmental variables.
Materials and methods
Animals and sampling
Treatment of the fish used in this study was in compli-ance with the regulations of the University of Victoria Animal Care Committee. Eggs from Atlantic salmon (McConnell (Mowi)) were obtained in November, 2009 from Marine Harvest United Hatchery (Fanny Bay, BC, Canada). The eggs were fertilized by gently mixing the
eggs and milt by hand and then washed with partial exchanges of water. Approximately 2,000 fertilized eggs were then transferred and placed in Heath trays (Mari-source, Fife, WA) at the University of Victoria. The embryos and larvae were raised in fresh water at a tem-perature of 12°C and a flow rate of 200 liters/h.
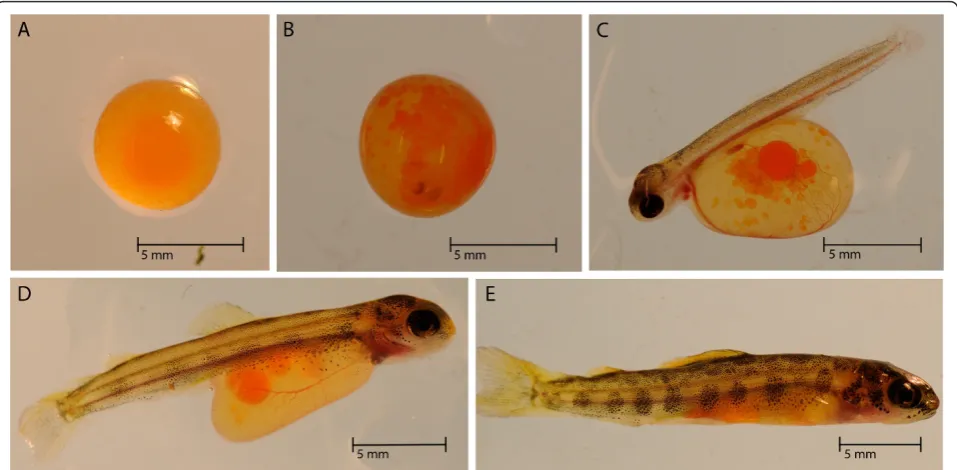
The day of fertilization was marked as 0 days post fer-tilization (dpf), and hatching and yolk sac absorption occurred between 38 to 40 dpf and 68 to 70 dpf, respec-tively. Whole embryos (n = 20) and larvae were col-lected every one to three days for several weeks. Alevin and fry were collected every sixth day for the remainder of the study (Figure 1). Unfertilized eggs were not included in the experimental design, which could be used to examine possible RNA effects from the oocyte. Samples were directly placed into dry ice and stored at -80°C until RNA extraction.
RNA extraction
Total RNAs were extracted in TRIzol reagent (Invitro-gen, Carlsbad, CA) by mixer-mill homogenization (Retsch, Newtown, PA) and spin-column purified using RNeasy Mini kits (Qiagen, Hilden, Germany). The RNA was extracted from three whole individual embryos, lar-vae, or alevins at 2 dpf and then every fifth day (5 to 35 dpf) or sixth day (35 to 89 dpf). Quantity and quality of RNA samples were then measured using UV absor-bance (NanoDrop Technologies, Wilmington, DE) and quality was also checked by agarose gel electrophoresis.
cRNA synthesis, labeling, and purification
material was ultimately available. Due to the small size and early developmental stage of samples from days 2, 5, and 10 dpf, limited RNA quantities necessitated addi-tional extractions and subsequent synthesis and labeling reactions, however repeated procedures produced Cy5 labeled cRNA of the required quantity and quality.
Microarray hybridization and scanning
Experimental samples of Cy5 labeled cRNA were quan-tified on a Nanodrop ND-1000. All samples were found to be of sufficient specific activity with a mean (± SD) of 18.22 ± 2.03 pmol Cy5/μg cRNA as per manufac-turer’s recommendation (Agilent) and an appropriate RNA absorbance ratio with a mean of 2.29 ± 0.06. Next, cRNA fragmentation mixtures were created following the LIQA kit instructions, using 825 ng of experimental sample and 825 ng of reference pool. These mixtures were incubated at 60°C for 30 minutes. After cooling on ice for one minute, hybridization mixtures were pre-pared by adding 2x GEx Hybridization Buffer HI-RPM and mixing well by pipetting. These reactions were loaded in random arrangements with respect to time point onto 44K oligo salmonid microarrays (Agilent-025055) using Agilent SureHyb Hybridization Cham-bers. Each of the 4 × 44K arrays on the microarray slides had 100 μL of hybridization reaction added. The hybridization reactions were allowed to occur for 17 hours at 65°C. Slide washes were performed as per the manufacturer’s instructions, including an ozone-protec-tion step using the Agilent Stabilizaozone-protec-tion and Drying
Solution. Slides were scanned as soon as possible on a ScanArray Express (PerkinElmer, Waltham, MA) scan-ner at 5 μm resolution using a PMT setting of 80 in both channels, a black threshold of 1800, and a full color threshold of 26.8. Slides were stored in a low ozone chamber (typically < 5 ppb) until scanned.
Data processing
Since the temperature of the environment has a strong influence on the rate of development of Atlantic salmon [16], time points as dpf were converted to both degree days and to the relative age in terms of Tau-somite (τs) as proposed by Gorodilov [17] (Table 1). This allowed for the determination of corresponding phenotypic stages independent of the temperature during development.
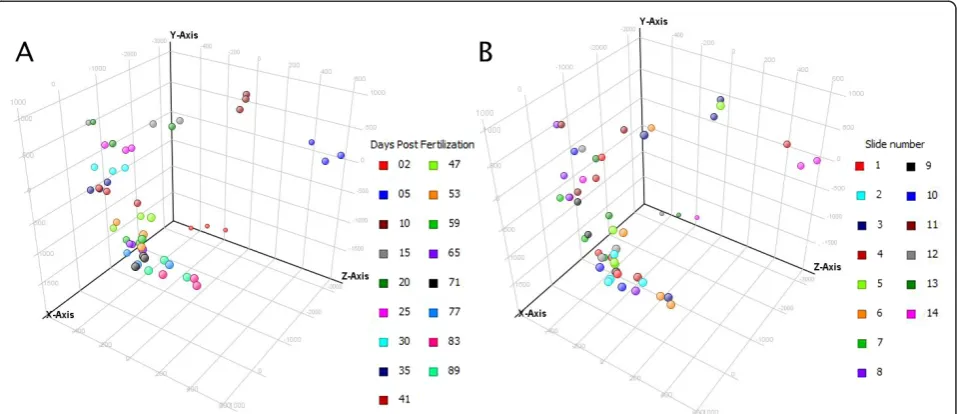
[image:3.595.59.538.89.324.2]This study complies with the MIAME standards [18]. Scanned arrays were quantified using Imagene 8.0 (Bio-discovery, El Segundo, CA) and processed with in-house scripts for input to GeneSpring GX 11.0 (Agilent). Data were imported into GeneSpring under the following conditions: raw data were converted to a threshold value of 1.0, data were log-transformed, a Lowess nor-malization was performed, and a baseline transformation to the median of all samples was performed. As a qual-ity control measure, 3D-PCA graphs were examined with respect to the experimental variable, namely days post fertilization (Figure 2a), and technical variables such as slide number (Figure 2b), with four randomized samples per slide. Clustering according to days post fer-tilization was evident, with earlier days (2, 5, and 10)
being further removed from the rest of the samples. In contrast, no real clustering was observable based on slide number, and this trend continued for other techni-cal variables such as labelling day (data not shown). After data import, entities flagged for various reasons (e.g. poor spot morphology) by Imagene were filtered
out, along with entities possessing raw signal values lower than 500.
[image:4.595.56.540.101.348.2]As an initial exploratory analysis, conditions (dpf) were compared to each other using a sliding window approach. Using a t-test assuming unequal variance (Welch) (p≤ 0.01, fold change≥ 2.0) without multiple
Table 1S. salardevelopmental stages sampled
Days post fertilization (dpf) Degree days (12°C * dpf) Relative age inτs Subperiod
2 24 17 Blastulation
5 60 42 Gastrulation
10 120 83 Somitogenesis
15 180 125 Vascularization of yolksac
20 240 167 Vascularization of yolksac
25 300 208 Formation of caudal rays
30 360 250 Formation of caudal rays
35 420 292 Formation of caudal rays
41 492 342 Free embryo/Alevin
47 564 392 Free embryo/Alevin
53 636 442 Free embryo/Alevin
59 708 492 Alevins have left gravel/
Beginning of parr markings
65 780 542 Fry/Appearance of caudal parr marks
71 852 592 Fry/Yolk-sac completely absorbed
77 924 642 Parr
83 996 692 Parr
89 1068 742 Parr
S. salarsamples were taken at 17 time points, which correspond to specific developmental stages depending on the environmental temperature. Developmental stage can be measured in degree days, as relative age in Tau-somite(τs) [16], or described as a phenotypic subperiod as expected in the wild [16].
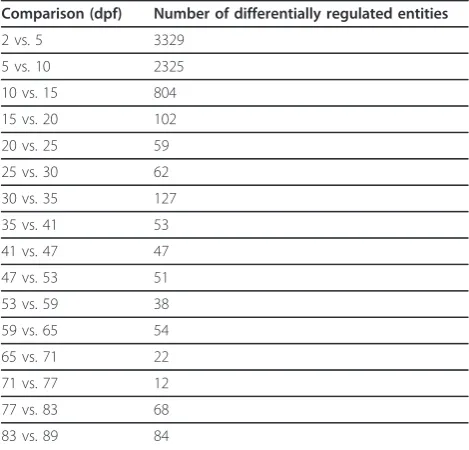
[image:4.595.60.540.476.683.2]test correction (MTC), each time point was compared to the next time point in the series. This allowed a cursory examination of the genes that were differentially regulated as development progressed. Numbers of significantly differentially expressed entities are listed in Table 2 and lists of annotated entities are provided as supplementary tables (additional file 1, additional file 2, additional file 3, additional file 4, additional file 5, addi-tional file 6, addiaddi-tional file 7, addiaddi-tional file 8, addiaddi-tional file 9, additional file 10, additional file 11, additional file 12, additional file 13, additional file 14, additional file 15, additional file 16). With a sample size of three indi-viduals per condition, it is possible that discovery of more subtly changing differential regulation is limited and this may also cause inclusion of some false posi-tives. Nonetheless, it is evident that high numbers of genes are being differentially regulated, especially in the first few weeks of development. In fact, it appears that the vast majority of transcriptional changes occur in the first 10 days of development.
In order to investigate the biological and technical variation within and among conditions, we examined the variation among biological replicates for each entity (Table 3). All 23,854 entities that passed pre-filtering were used to determine the average standard deviation of replicates. The first condition (2 dpf) has the highest mean, indicating a possibly higher level of noise due to biological and technical variation; however the median is highest at 15 dpf, and in fact all days have comparable
values. It appears that the data is not substantially noi-sier in the first days, therefore it is likely that the much higher number of differential transcripts in these com-parisons is biologically accurate.
In terms of ontogenetically relevant probes on the 44K microarray, over 900 entities are currently annotated with the GO term “development”. More specifically, approximately 620 and 180 entities are annotated with the terms “system development” and“embryo develop-ment”, respectively. In this experiment, the majority of entities in each of these categories was expressed above our threshold of 500 in at least one condition. Some of the GO terms that are significantly enriched in the var-ious comparisons include “blastocyst development” between 2 and 5 dpf, “brain development” between 5 and 10 dpf, “organ development” and “induction of apoptosis” between 10 and 15 dpf, and“erythrocyte development” between 15 and 20 dpf, to name just a few. Other researchers may perform fuller and more detailed analyses in accordance with their own questions and hypotheses.
Use of dataset
[image:5.595.56.291.111.336.2]Beyond this preliminary analysis, there is a wealth of information to be gained from these data and we have submitted all normalized and raw data to NCBI’s Gene Expression Omnibus (GEO) [19] for others to examine.
Table 2 Numbers of differentially regulated entities across timeline
Comparison (dpf) Number of differentially regulated entities
2 vs. 5 3329
5 vs. 10 2325
10 vs. 15 804
15 vs. 20 102
20 vs. 25 59
25 vs. 30 62
30 vs. 35 127
35 vs. 41 53
41 vs. 47 47
47 vs. 53 51
53 vs. 59 38
59 vs. 65 54
65 vs. 71 22
71 vs. 77 12
77 vs. 83 68
83 vs. 89 84
A Student’s t-test assuming unequal variation (P≤0.01, FC≥2.0) without MTC was used to compare each sampled time point to the subsequent time point. Numbers of entities that were significantly differentially expressed between the compared time points are presented.
Table 3 Variation among replicate samples across timeline
Condition (dpf) Mean Median Standard deviation
2 0.574 0.453 0.484
5 0.412 0.334 0.359
10 0.342 0.279 0.282
15 0.511 0.459 0.327
20 0.516 0.449 0.344
25 0.408 0.354 0.285
30 0.495 0.438 0.320
35 0.439 0.369 0.339
41 0.473 0.421 0.310
47 0.440 0.370 0.326
53 0.422 0.372 0.290
59 0.351 0.288 0.272
65 0.427 0.358 0.324
71 0.416 0.354 0.311
77 0.490 0.427 0.331
83 0.437 0.382 0.303
89 0.406 0.348 0.291
[image:5.595.305.538.111.350.2]The data are accessible through GEO Series accession number GSE25938 http://www.ncbi.nlm.nih.gov/geo/ query/acc.cgi?acc=GSE25938. This dataset encompasses variation among three individuals per condition and dif-ferences across 17 timepoints. It is evident that this microarray provides the ability to determine a detailed transcriptional basis of ontogeny and this experiment in particular contains a great deal of developmental infor-mation. In addition, these data could be used as a refer-ence for perturbed or abnormal development in other studies, or for researchers to refer to when transcrip-tional patterns of specific genes are discovered in other young salmonids.
Conclusion
Here we present a large and novel dataset that repre-sents an invaluable source of information on the tran-scriptional changes present in developing salmon. We believe these data will be of interest to many research-ers in several fields, including aquaculture, genomics, and developmental and evolutionary biology. Both as an examination of healthy development on its own and as a reference for future studies, this set of expression profiles will prove to be valuable to the scientific community.
Additional material
Additional file 1: 02 vs. 05 annotated entities. Spreadsheet of all annotated significantly differentially regulated entities between 2 and 5 dpf. Includes p-values, fold change, direction of regulation, and annotation information.
Additional file 2: 05 vs. 10 annotated entities. Spreadsheet of all annotated significantly differentially regulated entities between 5 and 10 dpf. Includes p-values, fold change, direction of regulation, and annotation information.
Additional file 3: 10 vs. 15 annotated entities. Spreadsheet of all annotated significantly differentially regulated entities between 10 and 15 dpf. Includes p-values, fold change, direction of regulation, and annotation information.
Additional file 4: 15 vs. 20 annotated entities. Spreadsheet of all annotated significantly differentially regulated entities between 15 and 20 dpf. Includes p-values, fold change, direction of regulation, and annotation information.
Additional file 5: 20 vs. 25 annotated entities. Spreadsheet of all annotated significantly differentially regulated entities between 20 and 25 dpf. Includes p-values, fold change, direction of regulation, and annotation information.
Additional file 6: 25 vs. 30 annotated entities. Spreadsheet of all annotated significantly differentially regulated entities between 25 and 30 dpf. Includes p-values, fold change, direction of regulation, and annotation information.
Additional file 7: 30 vs. 35 annotated entities. Spreadsheet of all annotated significantly differentially regulated entities between 30 and 35 dpf. Includes p-values, fold change, direction of regulation, and annotation information.
Additional file 8: 35 vs. 41 annotated entities. Spreadsheet of all annotated significantly differentially regulated entities between 35 and
41 dpf. Includes p-values, fold change, direction of regulation, and annotation information.
Additional file 9: 41 vs. 47 annotated entities. Spreadsheet of all annotated significantly differentially regulated entities between 41 and 47 dpf. Includes p-values, fold change, direction of regulation, and annotation information.
Additional file 10: 47 vs. 53 annotated entities. Spreadsheet of all annotated significantly differentially regulated entities between 47 and 53 dpf. Includes p-values, fold change, direction of regulation, and annotation information.
Additional file 11: 53 vs. 59 annotated entities. Spreadsheet of all annotated significantly differentially regulated entities between 53 and 59 dpf. Includes p-values, fold change, direction of regulation, and annotation information.
Additional file 12: 59 vs. 65 annotated entities. Spreadsheet of all annotated significantly differentially regulated entities between 59 and 65 dpf. Includes p-values, fold change, direction of regulation, and annotation information.
Additional file 13: 65 vs. 71 annotated entities. Spreadsheet of all annotated significantly differentially regulated entities between 65 and 71 dpf. Includes p-values, fold change, direction of regulation, and annotation information.
Additional file 14: 71 vs. 77 annotated entities. Spreadsheet of all annotated significantly differentially regulated entities between 71 and 77 dpf. Includes p-values, fold change, direction of regulation, and annotation information.
Additional file 15: 77 vs. 83 annotated entities. Spreadsheet of all annotated significantly differentially regulated entities between 77 and 83 dpf. Includes p-values, fold change, direction of regulation, and annotation information.
Additional file 16: 83 vs. 89 annotated entities. Spreadsheet of all annotated significantly differentially regulated entities between 83 and 89 dpf. Includes p-values, fold change, direction of regulation, and annotation information.
Acknowledgements
This project was funded by the Natural Sciences and Engineering Research Council of Canada. Thanks to Marine Harvest for the generous donation of the Atlantic salmon eggs for this study. Thanks also to Brendon Campbell, Amy Hoare, and Brian Ringwood for egg transport and care of developing fish (Animal Care Services, University of Victoria).
Authors’contributions
SGJ performed data processing and analysis and drafted the manuscript. DSS ran microarrays and performed initial data processing. KRVS performed animal sampling and RNA extractions. MY performed additional animal sampling and assisted with microarray reactions. FM designed the 44K microarray. BFK conceived of the study. All authors read and approved the final manuscript.
Competing interests
The authors declare that they have no competing interests.
Received: 15 December 2010 Accepted: 29 March 2011 Published: 29 March 2011
References
1. Ng HSS, Artieri GC, Bosdet EI, Chiu RR, Danzmann GR, Davidson SW, Ferguson MM, Fjell DC, Hoyheim B, Jones JMS, de Jong JP, Koop FB, Krzywinski IM, Lubieniecki K, Marra AM, Mitchell AL, Mathewson C, Osoegawa K, Parisotto ES, Phillips BR, Rise LM, von Schalburg RK, Schein EJ, Shin SH, Siddiqui A, Thorsen J, Wye N, Yang G, Zhu LB:A physical map of the genome of Atlantic salmon,Salmo salar.Genomics2005,
2. Koop BF, von Schalburg KR, Leong J, Walker N, Lieph R, Cooper GA, Robb A, Beetz-Sargent M, Holt RA, Moore R, Brahmbhatt S, Rosner J, Rexroad CE, McGowan CR, Davidson WS:A salmonid EST genomic study: genes, duplications, phylogeny and microarrays.BMC Genomics2008, 9:545.
3. Phillips RB, Keatley KA, Morasch MR, Ventura AB, Lubieniecki KP, Koop BF, Danzmann RG, Davidson WS:Assignment of Atlantic salmon (Salmo salar) linkage groups to specific chromosomes: Conservation of large syntenic blocks corresponding to whole chromosome arms in rainbow trout (Oncorhynchus mykiss).BMC Genet2009,10:46.
4. Davidson WS, Koop BF, Jones SJ, Iturra P, Vidal R, Maass A, Jonassen I, Lien S, Omholt SW:Sequencing the genome of the Atlantic salmon (Salmo salar).Genome Biol2010,11:403.
5. von Schalburg RK, Rise LM, Cooper AG, Brown DG, Gibbs RA, Nelson CC, Davidson SW, Koop FB:Fish and chips: Various methodologies demonstrate utility of a 16,006-gene salmonid microarray.BMC Genomics
2005,6:126.
6. von Schalburg KR, Cooper GA, Leong J, Robb A, Lieph R, Rise ML, Davidson WS, Koop BF:Expansion of the genomics research on Atlantic salmonSalmo salarL. project (GRASP) microarray tools.J Fish Biol2008, 72:2051-2070.
7. Taggart JB, Bron JE, Martin SAM, Seear PJ, Hoyheim B, Talbot R, Carmichael SN, Villeneuve LAN, Sweeney GE, Houlihan DF, Secombes CJ, Tocher DR, Teale AJ:A description of the origins, design and performance of the TRAITS-SGP Atlantic salmonSalmo salarL. cDNA microarray.J Fish Biol2008,72(9):2071-2094.
8. Miller KM, Maclean N:Teleost microarrays: development in a broad phylogenetic range reflecting diverse applications.J Fish Biol2008, 72(9):2039-2050.
9. cGRASP Microarray Page.[http://web.uvic.ca/grasp/microarray/]. 10. cGRASP.[http://web.uvic.ca/grasp].
11. Leong SJ, Jantzen GS, von Schalburg RK, Cooper AG, Messmer MA, Liao YN, Munro S, Moore R, Holt AR, Jones JMS, Davidson SW, Koop FB:Salmo salar andEsox luciusfull-length cDNA sequences reveal changes in evolutionary pressures on a post-tetraploidization genome.BMC Genomics2010,11(1):279.
12. NCBI.[http://www.ncbi.nlm.nih.gov].
13. Ashburner M, Ball AC, Blake AJ, Botstein D, Butler H, Cherry MJ, Davis PA, Dolinski K, Dwight SS, Eppig TJ, Harris AM, Hill PD, Issel-Tarver L, Kasarskis A, Lewis S, Matese CJ, Richardson EJ, Ringwald M, Rubin MG, Sherlock G, GO Consortium:Gene Ontology: tool for the unification of biology.Nat Genet2000,25(1):25-29.
14. Agilent Technologies eArray.[https://earray.chem.agilent.com/earray]. 15. Seear PJ, Carmichael SN, Talbot R, Taggart JB, Bron JE, Sweeney GE:
Differential Gene Expression During Smoltification of Atlantic Salmon (Salmo salarL.): a First Large-Scale Microarray Study.Mar Biotechnol2010, 12(2):126-140.
16. Hamor T, Garside TE:Developmental rates of embryos of Atlantic salmon, Salmo salarL., in response to various levels of temperature, dissolved oxygen, and water exchange.Can J Zool1976,54(11):1912-1917. 17. Gorodilov NY:Description of the early ontogeny of the Atlantic salmon,
Salmo salar, with a novel system of interval (state) identification.Environ Biol Fish1996,47(2):109-127.
18. Brazma A, Hingamp P, Quackenbush J, Sherlock G, Spellman P, Stoeckert C, Aach J, Ansorge W, Ball AC, Causton CH, Gaasterl T, Glenisson P, Holstege CPF, Kim FI, Markowitz V, Matese CJ, Parkinson H, Robinson A, Sarkans U, Schulze-Kremer S, Stewart J, Taylor R, Vilo J, Vingron M: Minimum information about a microarray experiment (MIAME) - toward standards for microarray data.Nat Genet2001,29(4):365-371.
19. Edgar R, Domrachev M, Lash EA:Gene Expression Omnibus: NCBI gene expression and hybridization array data repository.Nucleic Acids Res2002, 30(1):207-210.
doi:10.1186/1756-0500-4-88
Cite this article as:Jantzenet al.:A 44K microarray dataset of the changing transcriptome in developing Atlantic salmon (Salmo salarL.).
BMC Research Notes20114:88.
Submit your next manuscript to BioMed Central and take full advantage of:
• Convenient online submission
• Thorough peer review
• No space constraints or color figure charges
• Immediate publication on acceptance
• Inclusion in PubMed, CAS, Scopus and Google Scholar
• Research which is freely available for redistribution