This is a repository copy of Determination of the stable iron isotopic composition of sequentially leached iron phases in marine sediments.
White Rose Research Online URL for this paper: http://eprints.whiterose.ac.uk/93153/
Version: Accepted Version
Article:
Henkel, S, Kasten, S, Poulton, SW et al. (1 more author) (2016) Determination of the stable iron isotopic composition of sequentially leached iron phases in marine sediments. Chemical Geology, 421. 93 - 102. ISSN 0009-2541
https://doi.org/10.1016/j.chemgeo.2015.12.003
© 2015. This manuscript version is made available under the CC-BY-NC-ND 4.0 license http://creativecommons.org/licenses/by-nc-nd/4.0/
[email protected] https://eprints.whiterose.ac.uk/
Reuse
Unless indicated otherwise, fulltext items are protected by copyright with all rights reserved. The copyright exception in section 29 of the Copyright, Designs and Patents Act 1988 allows the making of a single copy solely for the purpose of non-commercial research or private study within the limits of fair dealing. The publisher or other rights-holder may allow further reproduction and re-use of this version - refer to the White Rose Research Online record for this item. Where records identify the publisher as the copyright holder, users can verify any specific terms of use on the publisher’s website.
Takedown
If you consider content in White Rose Research Online to be in breach of UK law, please notify us by
1
Determination of the stable iron isotopic composition of sequentially leached iron
1
phases in marine sediments
2
3
Susann Henkel1,2, Sabine Kasten2, Simon W. Poulton3, and Michael Staubwasser1 4
5
1 University of Cologne, Zülpicher Str. 49a, 50674 Cologne, Germany 6
2 Alfred Wegener Institute, Helmholtz Centre for Polar and Marine Research, Am 7
Handelshafen 12, 27570 Bremerhaven, Germany 8
3 School of Earth and Environment, The University of Leeds, Leeds, LS2 9JT, United Kingdom 9
10
Corresponding author: Susann Henkel ([email protected]) 11
12
Abstract
13
Reactive iron (oxyhydr)oxide minerals preferentially undergo early diagenetic redox cycling 14
which can result in the production of dissolved Fe(II), adsorption of Fe(II) onto particle 15
surfaces, and the formation of authigenic Fe minerals. The partitioning of iron in sediments 16
has traditionally been studied by applying sequential extractions that target operationally-17
defined iron phases. Here, we complement an existing sequential leaching method by 18
developing a sample processing protocol for 56Fe analysis, which we subsequently use to 19
study Fe phase-specific fractionation related to dissimilatory iron reduction in a modern 20
marine sediment. Carbonate-Fe was extracted by acetate, easily reducible oxides (e.g. 21
ferrihydrite and lepidocrocite) by hydroxylamine-HCl, reducible oxides (e.g. goethite and 22
hematite) by dithionite-citrate, and magnetite by ammonium oxalate. Subsequently, the 23
2
chromatography. The method was applied to surface sediments collected from the North 25
Sea, south of the Island of Helgoland. The acetate-soluble fraction (targeting siderite and 26
ankerite) showed a pronounced downcore 56Fe trend. This iron pool was most depleted in 27
56Fe close to the sediment-water interface, similar to trends observed for pore-water Fe(II). 28
We interpret this pool as surface-reduced Fe(II), rather than siderite or ankerite, that was 29
open to electron and atom exchange with the oxide surface. Common extractions using 0.5 30
M HCl or Na-dithionite alone may not resolve such trends, as they dissolve iron from 31
isotopically distinct pools leading to a mixed signal. Na-dithionite leaching alone, for 32
example, targets the sum of reducible Fe oxides that potentially differ in their isotopic 33
fingerprint. Hence, the development of a sequential extraction Fe isotope protocol provides 34
a new opportunity for detailed study of the behavior of iron in a wide-range of 35
environmental settings. 36
37
Keywords
38
Iron, sediment, sequential extraction, stable Fe isotopes, early diagenesis 39
40
1 Introduction
41
The many aspects of the biogeochemical cycle of Fe, such as sources and sinks, 42
changes in redox state, and phase transformations have been intensely studied in 43
continental and marine environments. Iron fluxes and the bioavailability of respective Fe 44
mineral phases, however, are still poorly constrained (Raiswell and Canfield 2012), mainly 45
due to methodological challenges in tracing the complex reaction pathways in which Fe 46
participates. As early as the 1960s and 1970s, the need for separation of (highly) reactive Fe 47
3
methods (e.g. Mehra and Jackson 1960, Schwertmann 1964, McKeague and Day 1966, 49
Tessier et al. 1979). Since then these schemes have been modified to enhance their 50
selectivity (e.g. Lord III 1980, Phillips and Lovley 1987, Cornwell and Morse 1987, Ferdelman 51
1988, Canfield 1988, Kostka and Luther 1994, Haese et al. 1997, Hyacinthe and Van Capellen 52
2004, Poulton and Canfield 2005, Raiswell et al. 2010). Although operationally-defined and 53
not entirely mineral-specific, these methods are now routinely applied in soil and sediment 54
biogeochemical studies. In soil science, Fe solid phase speciation and distribution patterns 55
are used to classify soils and to reconstruct pedogenesis (e.g. Wiederhold et al. 2007a). Soil 56
Fe mineralogy has been shown to control the mobility of pollutants and other nutrients 57
(Stucki et al. 1988). 58
Fe extractions in modern marine sediments have often been performed to identify 59
the pool of Fe that is potentially reducible during early diagenesis, either through 60
dissimilatory iron reduction (DIR) (e.g. Slomp et al. 1997, Jensen et al. 2003), or by direct 61
abiotic reduction with dissolved sulphide (e.g. Canfield et al. 1992, Poulton et al. 2004). 62
These extraction procedures have also widely been used to study and quantify the post-63
depositional alteration of the primary Fe mineral assemblage including the overprint of 64
rock magnetic characteristics of sediments (e.g. Kasten et al. 1998, Riedinger et al. 2005, 65
März et al. 2008). Furthermore, reactive Fe oxide minerals buried and preserved in 66
subsurface marine sediments have recently been suggested to be an important substrate in 67
the anaerobic oxidation of methane (e.g. Beal et al. 2009, Segarra et al. 2013, Riedinger et al. 68
2014, Sivan et al. 2011, 2014, Egger et al. 2015). Similarly, for ancient sediments, the 69
analysis of sequentially leached solid phase iron species in black shales and banded iron 70
formations, has revealed important insight into the redox-state of the past ocean (e.g. 71
4
A growing number of studies on Fe sources to the ocean, and reaction pathways in 73
the modern or ancient marine environment, have focused on, or have been complemented 74
by, stable Fe isotope analysis (e.g. Anbar and Rouxel 2007, Johnson et al. 2008, Conway and 75
John 2014). In particular, biologically-driven redox cycling initiated by DIR may lead to a 76
specific Fe isotope compositional fingerprint, which distinguishes such Fe from other 77
sources, such as hydrothermal fluids, river discharge, and dust deposition (Beard et al. 78
2003a, Severmann et al. 2010, Homoky et al. 2009, 2013). However, experimental studies 79
biotic and abiotic demonstrate the complexity of Fe isotope fractionation during specific 80
reaction pathways and between the Fe mineral phases involved. For example, isotope 81
fractionation occurs between dissolved Fe, surface-bound Fe, and the bulk of the Fe-oxide 82
mineral during both DIR (Crosby et al. 2007) and abiotic equilibrium exchange (Wu et al. 83
2011). During pyrite formation, Fe isotopes fractionate between dissolved Fe, mackinawite, 84
and pyrite (Guilbaud et al. 2013). The use of Fe isotopes as a fingerprint for a specific source 85
or reaction pathway may therefore require analytical discrimination between different Fe 86
phases. 87
Sequential leaching techniques may provide the means to address the above isotopic 88
complexity. Initial studies have shown, for example, that the isotopic fingerprint of DIR in 89
marine sediments is detectable only in the reactive Fe oxides (Severmann et al. 2006, 90
Staubwasser et al. 2006). Similarly, the first Fe isotope data obtained from partial selective 91
leaching of soils has provided valuable insight into the weathering of Fe minerals and their 92
utilization as nutrient sources during plant growth (Wiederhold 2007b, Guelke et al. 2010). 93
In an attempt to address Fe fluxes to the ocean, Scholz et al. (2014) used Fe concentration 94
data from sequential leaching extracts, in combination with Fe isotope data from HCl 95
5
margin. The logic next step is to apply Fe isotope analyses directly to a full sequential 97
leaching protocol. However, there are a number of analytical issues that must be solved 98
prior to application, such as potential isotope fractionation during the Fe separation 99
chemistry required for isotope analysis, and matrix-induced mass bias from residual leaching 100
chemicals during mass spectrometry. 101
Here, we have developed a protocol to measure Fe isotopes in different 102
operationally-defined Fe pools targeted by a commonly used extraction procedure for 103
modern and ancient sediments (Poulton and Canfield 2005; henceforth referred to as the 104
PC-Method). The method was developed mainly to study the redox evolution of depositional 105
environments recorded in sedimentary archives, but is more broadly applicable to studies of 106
Fe biogeochemistry in modern and ancient settings. The PC-Method targets a variety of 107
´highly reactive´ Fe phases, including carbonate Fe (e.g. siderite) with acetic acid, easily 108
reducible Fe hydroxides and oxyhydroxides (ferrihydrite, lepidocrocite) with hydroxylamine-109
HCl, reducible (oxyhydr)oxides (goethite, hematite, akaganéite) with a solution of Na-110
dithionite and Na-citrate, and magnetite with oxalic acid. Some of these leaching steps have 111
been applied in earlier Fe isotope studies of recent sediments (Staubwasser et al. 2006) and 112
soils (Wiederhold et al. 2007a, 2007b, Guelke et al. 2010), but the full sequential scheme has 113
not previously been applied to Fe isotope studies. The PC-Method includes a separate 114
chromous chloride reduction of FeS2, but this technique extracts other Fe phases as well, 115
and is also unsuitable for Fe isotope analysis because of a mass interference of 54Cr on 54Fe, 116
which cannot be corrected for if Cr is present above typical blank concentrations during 117
mass spectrometry. A better method for extracting silicates (with HF) and pyrite (HF-118
6
isotope analysis by Severmann et al. (2006). This approach may be used subsequently to the 120
extraction protocol shown here, to determine the isotopic composition of pyrite Fe. 121
122
123
2 Method development and testing
124
2.1 Extraction of Fe phases (PC-Method)
125
Leaching is generally started with 5 mL of 1 M Na-acetate (adjusted to pH 4.5 with 126
acetic acid) per ~50 mg of sediment for 24 h under an Ar-atmosphere. This extraction step 127
targets carbonate-associated Fe (Tessier et al. 1979, Poulton and Canfield 2005), but also 128
removes AVS (Cornwell and Morse 1987, Poulton and Canfield 2005) and surface-reduced 129
Fe(II) (Crosby et al. 2005, 2007). In the second step, 5 mL of 1 M hydroxylamine-HCl in 25% 130
v/v acetic acid (Chester and Hughes 1967) are reacted with the residue for 48 h. This step 131
targets easily reducible Fe oxide minerals such as ferrihydrite and lepidocrocite (Poulton and 132
Canfield 2005). Leaching is then continued with a 2 h treatment of 5 mL of Na-dithionite (50 133
g L-1)/Na-citrate solution (pH 4.8) (Mehra and Jackson 1960, Lord III 1980). Compared to 134
Canfield (1989) and Poulton and Canfield (2005) we used less citrate (0.02 M instead of 0.2 135
M) in order to lower the risk of matrix effects during MC-ICP-MS measurements. Citrate is 136
commonly added as a complexing agent in excess to complex Fe(II) in solution. We ensured 137
the stability of Fe in solution by performing this extraction step under anoxic conditions and 138
observed total dissolution of a goethite-hematite mineral standard (see below) and no re-139
precipitation of Fe (oxyhydr)oxides. The sequential extraction is completed by leaching with 140
0.2 M ammonium oxalate/0.17 M oxalic acid for 6 h to dissolve magnetite. After each 141
extraction step samples were centrifuged and the supernatants filtered through 0.2 µm 142
7 144
2.2 Preparation of leachate solutions for isotope analysis
145
The PC-Method 56Fe isotope
146
analysis, where the main problem is uncorrectable matrix-induced bias of measured isotope 147
ratios. Procedures were developed to remove the leaching chemicals prior to standard 148
column chromatography and mass-spectrometric methods (see below). The matrix removal 149
and the accuracies of isotope ratios were verified by reference samples of known 150
composition. These were a) 0.5 mL of an iron standard solution (1000 ppm Fe Certipur®) to 151
which for each leaching step the appropriate chemicals were added and subsequently 152
removed, and b) a hematite-goethite mixture prepared according to Cornell and 153
“ 56F “
154
the dithionite extraction step only. These and all other subsequent (natural and artificial) 155
samples were processed as follows: 156
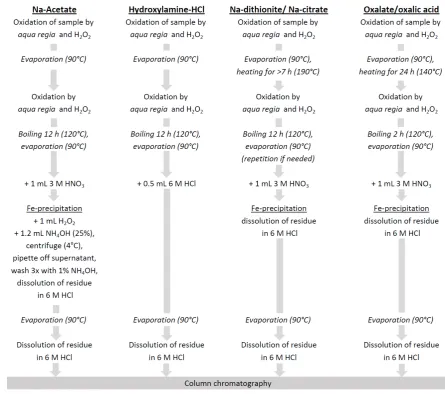
Acetate extraction, (Feaca): After centrifugation and filtration the acetate matrix was 157
destroyed by repetitive oxidation in a mixture of distilled HNO3 and HCl (1:3) with additional 158
H2O2 (supra pure grade) (see below for reproducibility of 56FeFeaca data). The complete 159
procedure for matrix removal is shown in Figure 1. Iron was precipitated from the solution as 160
Fe hydroxide (Fig. 1) to ensure complete separation from matrix. (Centrifuging the samples 161
at 4°C helps to keep the Fe precipitate at the bottom of the test tube.) Subsequently, column 162
chromatography was performed using the BioRad AG®
1-X8 anion exchange resin (Strelow 163
8
Hydroxylamine-HCl extraction (Fehyam): Filtered samples were repetitively oxidized and re-165
dissolved in 6 M HCl before column separation was performed as described for the previous 166
extraction step (Fig. 1). 167
Na-dithionite/Na-citrate extraction (Fedi-ct): Samples were oxidized (Fig. 1) and after 168
evaporation, residues were heated for >7 h at 190°C for thermal destruction of the citrate. 169
Afterwards, H2O2 and aqua regia were carefully added to the samples to oxidize the reduced 170
sulfur species in the remaining dithionite to SO42-. Subsequent iron hydroxide precipitation 171
(Fig. 1) was performed to remove all Fe from the sulfate matrix which would otherwise 172
overload the anion exchange resin. Furthermore, iron precipitation showed whether citrate 173
was fully removed from the solution, whereby incomplete iron precipitation was indicated 174
by a yellowish supernatant color due to citrate remaining in the solution. In this case, 175
thermal heating was repeated. Further processing of the samples for column 176
chromatography was performed as described above. 177
Oxalic acid extraction (Feoxa): The filtrate was oxidized and after evaporation, samples were 178
heated for 24 h at 140°C to further oxidize the oxalate to CO2 (Fig. 1). During heating, oxalate 179
crystals condensating at the rim of the beakers were flushed back with ultra-pure water. 180
Residues were re-dissolved in aqua regia and H2O2 (Fig. 1). After boiling (2 h at 120°C) and 181
evaporation, iron precipitation and sample preparation for column chromatography was 182
performed as described above. Iron precipitation was performed to ensure the 183
completeness of oxalate removal. When Fe precipitation was inhibited, heating of the 184
sample for oxalate destruction was repeated. 185
186
2.3 MC-ICP-MS setup
9
Prior to mass-spectrometry, concentrations of leached sediment samples were 188
matched to 1 ppm following ICP-OES analysis (Spectro Arcos ICP-OES). Iron isotope 189
measurements were performed on a ThermoFinnigan Neptune MC-ICP-MS instrument at 190
the Steinmann Institute in Bonn following the method described by Schoenberg and von 191
Blanckenburg (2005). 53Cr and 60Ni were simultaneously measured to monitor interferences 192
of 54Cr on 54Fe and 58Ni on 58Fe, and the data corrected accordingly. We used the standard-193
sample bracketing method with the IRMM-014 standard. An in-house standard 194
(Johnson&Matthey, Fe Puratronic wire, 56Fe = ) was additionally measured 195
every 6 samples to monitor accuracy. Pore-water samples were matched to 0.2 ppm and 196
measured using an ESI Apex-Q desolvator instead of the regular glass spray chamber. 197
Data are reported as 198
56Fe [‰] = [(56Fe/54Fe
sample) / (56Fe/54FeIRMM-014) 1] * 1000 199
Iron isotope fractionation between two species X and Y are given as 200
56Fe
X-Y = 56FeX - 56FeY 201
202
2.4 Procedure blanks, accuracy and reproducibility of 56Fe dataleached from sediment
203
samples
204
Recoveries of the Certipur® Fe standards were between 83 and 101% for all 205
extractants, when normalized to the unprocessed standard solution (Table 1). The amount of 206
Fe in the standards (0.5 mg) was higher, but in the same order of magnitude as that 207
extracted from sediments. The low recoveries for oxalate are due to loss of material during 208
the sometimes vigorous oxidation reaction. Reagent blanks were 1.2 ng mL-1 for Na acetate 209
solution, 43 ng mL-1 for hydroxylamine-HCl, 54 ng mL-1 for dithionite-citrate, and 4.1 ng mL-1 210
10
0.1 and 0.4 µg Fe (Table 1) and were thus two to three orders of magnitude lower than Fe 212
T G
213
outlier test, =0.05) and therefore eliminated from calculations. Contamination concerned 214
oxalate samples and may have happened during the thermal destruction step. 215
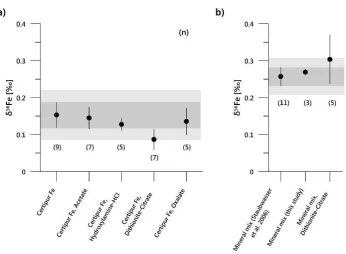
The Certipur® standards that underwent chemical processing were isotopically 216
56Fe = 0.15±0.03 , n=9). Values for the
217
extractants were: 0.14±0.03 for acetate (n=7), 0.13±0.02 for hydroxylamine-HCl (n=5), 218
0.09±0.03 for dithionite-citrate (n=7), and 0.14±0.04 for oxalate (n=5) (Fig. 2). The 219
reproducibility of our internal Certipur® standard, regardless of whether it was subjected to 220
the extraction steps of the PC-Method or not, suggests that the process that led to the loss 221
of Fe during processing of the samples did not result in a significant fractionation of Fe 222
isotopes. 223
The hematite-goethite standard was also dissolved in HCl/HNO3 and measured 224
without further chemical treatment, except for the column separation. This gave a 56Fe 225
composition of 0.27±0.01 1SD, n=3, F T 56Fe value of the dithionite-leached and 226
fully processed mineral standards was 0.30±0.07 5) compared to given by 227
Staubwasser et al. (2006) (n=11). These data demonstrate the absence of matrix-induced 228
bias in Fe isotope ratios in samples leached and subsequently processed by the methods 229
outlined in this study. 230
231
2.5 Selectivity of the Fe extraction steps
232
2.5.1 Materials and set-up of experiments
11
Time resolved leaching rate experiments: Using synthetic minerals, the selectivity of the 234
chemical extractions by Na-acetate, hydroxylamine-HCl, and Na-dithionite/Na-citrate was 235
evaluated. This is important, as dependent on the size of Fe pools and their isotopic 236
differences, non-selectivity of the leaching can lead to incorrect Fe isotope values for the 237
actual target fraction. The minerals were synthesized after Cornell and Schwertmann (1996). 238
About 5 mg of the specific Fe oxide was suspended in 50 mL of an extraction solution not 239
designed to lead to its dissolution: ferrihydrite was treated with Na-acetate for 12, 24, 36, 240
48, and 60 h, goethite and hematite were treated with hydroxylamine-HCl for 12, 24, 36, 48, 241
and 60 h, and magnetite was treated with Na-dithionite/Na-citrate for 1, 2, and 4 h. In 242
contrast to earlier studies (Canfield 1988, Raiswell et al. 1994, Poulton and Canfield 2005) 243
magnetite was significantly dissolved by dithionite treatment (see below) and the leaching 244
was thus repeated using magnetite purchased from Alfa Aesar. Although not used on natural 245
samples in this study, we also evaluated 0.5 M HCl extraction that targets poorly crystalline 246
hydrous ferric oxides such as ferrihydrite (Kosta and Luther 1994, Severmann et al. 2006). 247
The synthetic minerals ferrihydrite, goethite, hematite, and magnetite were subject to 0.5 M 248
HCl for 0.5, 1, 2, 4, and 8 h at room temperature. After each time step, the respective 249
samples were centrifuged and aliquots of 15 mL were filtered. Na-acetate, hydroxylamine-250
HCl, and dithionite samples were processed as described above, but omitting Fe 251
precipitation and column chromatography as only Fe concentrations were to be obtained. 252
The processing of HCl-samples was reduced to evaporation and subsequent re-dissolution in 253
0.3 M HNO3 prior to Fe concentration measurement by ICP-OES. 254
Leaching of pairs of isotopically spiked and non-spiked minerals: Mixtures of two synthetic 255
minerals were treated with extractants (hydroxylamine-HCl, Na-dithionite, and 0.5 M HCl) to 256
12
58Fe-spiked non-target mineral (e.g. non-spiked ferrihydrite plus spiked goethite for 258
hydroxylamine-HCl extraction). Based on the aforementioned observation of our magnetite 259
minerals significantly dissolving in dithionite solution, additional tests with magnetite 260
purchased from Alfa Aesar (non-spiked) were performed with spiked goethite and hematite, 261
respectively. To allow for the high iron concentrations when using pure phases compared to 262
natural sediment samples, about 10 mg of the synthetic minerals (5 mg spiked mineral + 5 263
mg non-spiked mineral) was treated with 50 mL of the respective leaching reagent (in 264
contrast to 50 mg + 5 mL for sediment samples, see above). For each mineral pair, three 265
replicates were processed. After centrifugation, 15 mL of the extract was filtered for further 266
processing for Fe isotope analysis as described above. Dissolution of target and non-target 267
minerals was evaluated by comparing 58Fe/54Fe ratios of the leachates with those of the 268
respective pure synthetic minerals. The latter ratios were determined after dissolution of the 269
pure minerals in aqua regia, evaporation, re-dissolution in 6 M HCl, and column 270
chromatography. 271
272
2.5.2 Selectivity of extraction steps
273
Time resolved leaching rate experiments: With the exception of the dithionite 274
extraction, the treatment of synthetic Fe (oxyhydr)oxide minerals with reagents that are 275
commonly used in the subsequent extraction step led to only minor dissolution, verifying the 276
results of Poulton and Canfield (2005). As expected, mineral dissolution increased with the 277
duration of leaching (Fig. 3). At optimum times for acetate- and hydroxylamine-HCl 278
extractions (according to the PC-Method), less than 1% of the non-target minerals 279
ferrihydrite and goethite + hematite, respectively, were dissolved. Carry-over of ferrihydrite-280
13
(2005) and can thus be considered insignificant. The slightly higher dissolution of hematite in 282
hydroxylamine-HCl compared to goethite could be related to grain-size differences and also 283
the degree of crystallinity of the hematite (freshly-precipitated hematite is more readily 284
dissolved than natural hematite; Raiswell et al. 1994). With respect to iron isotope 285
signatures, a carry-over of <1% of goethite- and hematite-Fe into the fraction of amorphous 286
Fe is, however, insignificant for typical marine or fluvial sediments as Fehyam and Fedi-ct 287
concentrations usually range in the same order of magnitude. 288
We observed considerable dissolution of magnetite in Na-dithionite/Na-citrate for 289
both the magnetite synthesized after Cornell and Schwertmann (1996) and the magnetite 290
purchased from Alfa Aesar. The 2 h-treatment led to dissolution of up to 50% of the 291
magnetite (Fig. 3), which is in contrast to the results of Poulton and Canfield (2005) who 292
observed dissolution of only up to 7%, and Raiswell et al. (1994) who observed only 4% 293
dissolution. In our study the significant difference in dissolution of the magnetite produced 294
after Cornell and Schwertmann (1996) and the purchased magnetite (52% vs. 32% after 2 h 295
in dithionite/citrate) indicates that grain size might considerably affect dissolution. However, 296
the magnetite synthesized after Cornell & Schwertmann was similar to that used by Poulton 297
and Canfield (2005) and yet was strongly dissolved. Interestingly, Kostka and Luther (1994) 298
also observed significant magnetite dissolution in dithionite (90.2%). The authors, however, 299
leached for 4 h at 60°C, so their data are not directly comparable to previous studies. The 300
disparity in our data relative to previous studies was possibly caused by differences in 301
sample size used per volume of solution, crystallinity, or potentially by partial oxidation of 302
magnetite during storage. The 1 h extraction by 0.5 M HCl resulted in effective dissolution of 303
ferrihydrite (>95%) while goethite, hematite, and magnetite remained largely unaffected 304
14
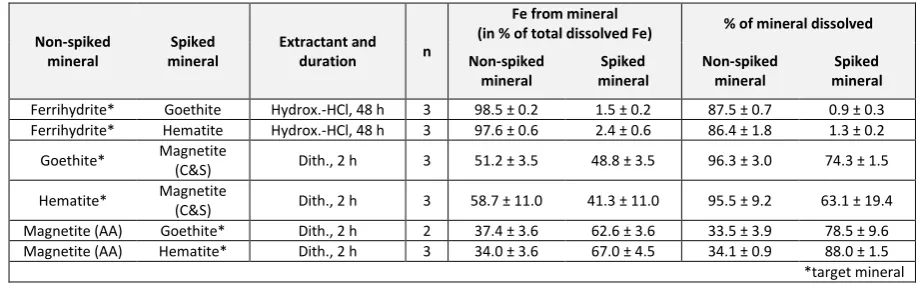
Leaching of pairs of isotopically spiked and non-spiked minerals: Test results of 306
experiments with 58Fe spiked and non-spiked minerals are shown in Table 2. The 58Fe/54Fe 307
ratios of samples and pure minerals as end-members are given in the appendix (Tables A.1 308
and A.2). In accordance with the previous time-resolved experiment, the isotopic data of 309
leached mineral mixtures demonstrate that goethite and hematite remain unaffected by the 310
hydroxylamine-HCl extraction. For both pairs (each with ferrihydrite), 98% of the dissolved 311
Fe in solution was derived from ferrihydrite and ~2% originated from goethite and hematite. 312
In hydroxylamine-HCl, 87% of the ferrihydrite-Fe was recovered, which is slightly less than 313
the 99% given by Poulton and Canfield (2005). Dithionite effectively dissolved goethite and 314
hematite. In the first experiment, where minerals have been mixed with 58Fe-spiked 315
magnetite synthesized after Cornell and Schwertmann (1996), ~96% of goethite and 316
hematite were dissolved after 2 h. In the repeated run with magnetite from Alfa Aesar, 317
recoveries were, however, lower (79 to 88%; Table 2). In both runs, magnetite was 318
significantly dissolved and data produced by the mixing experiment match those of the 319
single mineral extraction: Dithionite extracted up to 50-60% of our synthetic magnetite and 320
30-40% of the Alfa Aesar magnetite. 321
322
3 Application of the new method to surface sediments of the North Sea
323
3.1 Material and methods
324
3.1.1 Core location and sampling
325
Data presented in this study were obtained for surface sediments retrieved by a 326
multicorer in the German Bight (North Sea, 54°5.06' N, 7°54.94' E, 36 m water depth; site 327
HE337-1) in 2010 during cruise HE337 of research vessel HEINCKE. The sediment cores were 328
15
grained sediments in the North Sea with eddy focusing of fine-grained material from the 330
rivers Weser and Ems (Hertweck 1983). Sedimentation rates in the Helgoland mud area are 331
~2.6 mm/yr for the last 750 years (Hebbeln et al. 2003). The location was chosen as 332
sediments exhibit an extended ferruginous zone starting directly below the sediment surface 333
in contrast to deposits within the Helgoland mud area proper, where the upper iron 334
reduction zone is limited to the upper 15 cm (Oni et al. 2015). At the core location, 335
bioturbation (and potentially bioirrigation) occur. However, the generally rather undisturbed 336
pore-water profiles suggest that these processes proceed at a comparatively low rate (see 337
section 3.2). 338
Sediment analyses performed on one core included the sequential iron extractions of 339
the PC-Method for iron concentration and iron isotope analysis, bulk sediment total acid 340
digestion for total Al, Mn, and Fe (Fetotal) contents, in addition to AVS and pyrite-sulfide 341
extraction after Canfield et al. (1986) (without subsequent Fe isotope analysis). Sediment 342
was sampled directly on board using syringes with cut tips. The syringes were sealed and 343
stored in Ar-filled gas-tight glass containers at -20°C until processing to prevent secondary 344
mineral precipitation. Pore-water was sampled from a parallel core using rhizons (Seeberg-345
Elverfeldt et al. 2005, Dickens et al. 2007) that were inserted into pre-drilled holes in the 346
liner. In order to inhibit oxidation during sampling, due to O2 in either the rhizon or the 347
attached syringe, the rhizons were pre-soaked with ultra-pure water and the first 0.5 mL or 348
pore-water was discarded. Pore-water aliquots for 56Fe
Fe(II)aq were acidified with double 349
distilled HCl and stored in pre-cleaned vials at 4°C. 350
351
3.1.2 Sequential Fe extraction (PC-Method)
16
Sediment samples were leached in random order. About 50 mg of freeze-dried 353
sediment was washed with 5 mL of 1 M MgCl2 for 2 h in order to remove pore-water 354
constituents, which will also have removed exchangeable ions on particle surfaces (Tessier et 355
al. 1979, Poulton and Canfield 2005). The MgCl2 washing was performed under an Ar 356
atmosphere to prevent oxidation. The residue was then used for the subsequent extraction 357
steps (see chapter 2.1). The extraction solutions were processed as described in sections 2.2 358
and 2.3. 359
360
3.1.3 Bulk sediment composition
361
Total acid digestion of sediment samples was performed with a CEM Mars Xpress 362
microwave system using ~50 mg of freeze-dried sediment and a mixture of HNO3 (3 mL), HCl 363
(2 mL), and HF (0.5 mL). With each set of samples, blanks and standard reference material 364
(NIST SRM 2702) were processed. Element concentrations were measured by ICP-OES (Iris 365
Intreprid II). Recoveries of the standard were 97.5% for Al, 100.4% for Fe, and 98.9% for Mn. 366
367
3.1.4 AVS- and pyrite-S
368
Acid volatile sulfide and pyrite were determined for the North Sea sediments to both 369
correct the Na-acetate leached Fe pool for the presence of AVS, and to assess the extent of 370
early diagenetic iron transformation at the study site. Extractions (after Canfield et al. 1986) 371
with HCl (for AVS) and chromous chloride distillation (for pyrite) were performed at the 372
University of Leeds. These extractions determine the concentration of sulfide present, which 373
is then stoichiometrically converted to the appropriate Fe concentration. Replicates of three 374
17
all cases. Accuracy was evaluated by analysis of an in-house standard (HN22) with a pyrite-Fe 376
content of 2.12 ± 0.16 wt% (our measured value: 2.18 wt%). 377
378
3.1.5 Pore-water composition
379
On board pore-water analyses comprised the determination of Fe(II)aq using the 380
ferrozine method of Stookey (1970) and of alkalinity by titration with HCl (see appendix A.3 381
for alkalinity). Offshore measurements of SO42- were performed as described by Henkel et al. 382
(2012). Pore-water Fe for 56Fe
Fe(II)aq analysis was concentrated and purified from anions 383
using NTA Superflow (Lohan et al. 2005). The acidified samples were titrated with NH4OH 384
(supra pure grade) to a final pH of 2. In order to oxidize Fe(II) to Fe(III), 10 µM H2O2 was 385
added to the samples before loading of NTA Superflow columns (Qiagen). The NTA columns 386
were pre-conditioned with HCl (pH2, HCl triple distilled). Fe was subsequently eluted using 1 387
M HCl. The samples were further purified by anion exchange chromatography as described 388
in section 2.2 and measured by MC-ICP-MS (see section 2.3). 389
390
3.2 Results and discussion
391
3.2.1 Geochemical results
392
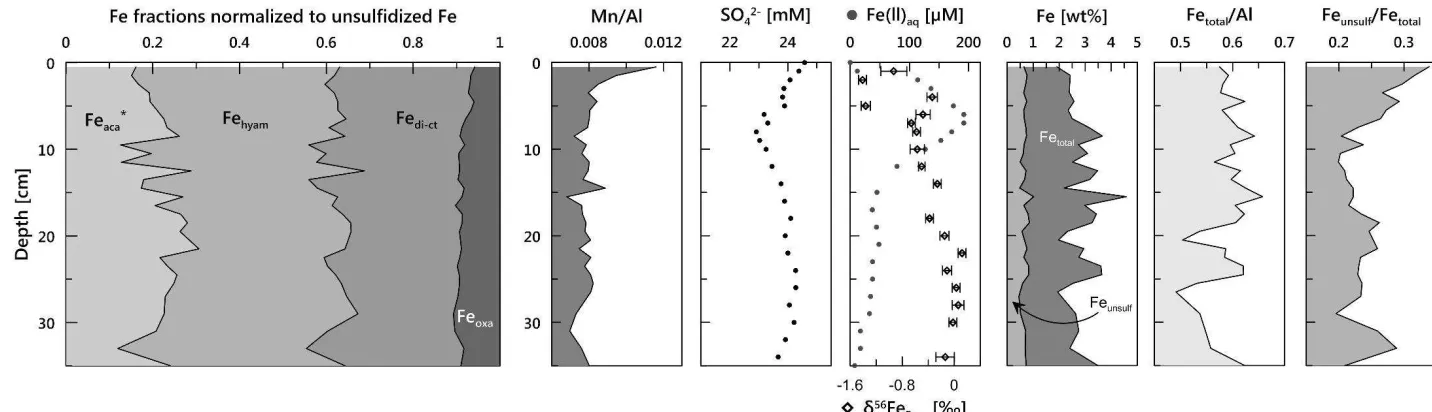
Geochemical data gained for Site HE337-1, including Fe phases and pore-water 393
constituents are shown in Figures 4 and 5 (note that Feaca* has been corrected for FeAVS and 394
that FeAVS was a minor constituent of Feaca in our samples; Figure 5). Total Fe contents range 395
between 1.9 and 4.6 wt%. Unsulfidized reactive iron (Feunsulf =Feaca*+ Fehyam + Fedi-ct + Feox) 396
varies between 0.5 and 1.0 wt% (Fig. 4). Although Feunsulf remains relatively constant with 397
18
of the sediment. At the core top, Fehyam represents about 50% of the unsulfidized Fe pool, 399
and when normalized to Feunsulf, shows an overall decrease to ~20 cm depth (Fig. 5). Feaca 400
and Fedi-ct amount to ~20 and ~30% of Feunsulf, respectively. Whereas Feaca/Feunsulf generally 401
increases towards 20 cm depth, with a subsequent overall decrease below, albeit with 402
significant variability at certain horizons, Fedi-ct/Feunsulf does not show a clear trend with 403
depth. Feoxa is of minor importance, contributing only ~10% to the Feunsulf pool throughout 404
most of the core, perhaps with a slight increase in Feoxa/Feunsulf over the top 10 cm. 405
Regarding the generally lower amount of Feoxa compared to Fedi-ct in this core, we consider 406
the effect of any possible magnetite dissolution in the Fedi-ct extract as being minor. 407
Sulfide-bound Fe is mainly present as pyrite (Fig. 5) with an increase towards 15 cm 408
depth. The FeAVS pool is relatively insignificant, with highest contents of 0.02 wt% at 18 cm 409
depth. Manganese oxide reduction is evidenced by a pronounced Mn/Al decrease in the top 410
3 cm (Fig. 4). Pore-water profiles (Fig. 4) indicate organoclastic sulfate reduction at ~7 cm 411
depth coinciding with a peak in Fe(II)aq (~200 µM) produced by DIR, with ferruginous pore-412
water prevailing over the full length of the core. 56Fe
Feaq values are lightest (-1.3 413
and 4.5 cm depth, where DIR dominates Fe cycling. At 0.5 cm, where Fe(II) is removed from 414
solution by oxidative precipitation (as indicated by a drawdown of Fe(II)aq), 56FeFeaq is 415
slightly heavier (-0.9 ). Below 5 cm depth (still within the Fe(II)aq maximum and coinciding 416
with the presence of AVS), the isotopic composition of pore-water Fe becomes heavier and 417
reaches a value of about zero at 18 cm, where Fe(II)aq concentrations level off to about 40 418
µM. 419
In the leached sediment fractions, a pronounced 56Fe trend with depth is observed 420
19
at depth (Fig. 5). Fehyam shows an overall depletion in 56Fe ( 56Fe = -0.38± ), whereas 422
Fedi-ct and Feoxa show near zero values (-0.07±0.09 and -0.15±0.08 , respectively). 423
424
3.2.2 Early diagenetic iron cycling in shallow North Sea sediments
425
The Fe phases extracted by the dithionite/citrate and oxalate solutions (goethite, 426
hematite, magnetite) are largely unaffected by DIR as concluded from the absence of clear 427
downcore trends in Fedi-ct and Feoxa contents and respective 56Fe profiles (Fig. 5). Near zero 428
values of 56Fe
di-ct and 56Feoxa reflect largely unaltered terrigenous input of these fractions 429
(e.g. Johnson et al. 2008). Fedi-ct and Feoxa contents vary between 0.1 to 0.3 wt% and 0.03 to 430
0.09 wt%, respectively (see appendix A.4). The downcore variability in Fedi-ct/Fereact and 431
Feoxa/Fereact is most likely related to changing depositional regimes/sediment accumulation, 432
rather than to a diagenetic overprint. As has been pointed out by Hebbeln et al. (2003), the 433
intensification of beam-trawl fishing off the German coast increased overall sediment 434
accumulation in the mud area during the 20th century and led to a coarsening of sediments. 435
These changes caused by anthropogenic activity are likely also reflected at Site HE337-1. 436
Here, west of the mud area, sedimentation rates are expected to be lower than the ~2.6 437
mm/yr in the sediment-focusing mud area (Hebbeln et al. 2003). Consequently, the retrieved 438
sediment core covers at least the past 150 yrs and thus the time when sedimentation 439
patterns changed. 440
The slight 56Fe-depletion in the hydroxylamine-leachable fraction ( 56Fe
hyam -441
0.38 ), relative to terrigenous sediments typically showing similar 56Fe values to igneous 442
Beard et al. 2003b) might reflect that part of the pool was diagenetically 443
20
anoxic conditions (below 1-2 cm depth), this pool is used for DIR reflected by a decrease of 445
Fehyam/Feunsulf from 0.45 to 0.35 in the top 10 cm (Fig. 5). However, at this location, the Fehyam 446
reduction does not lead to a significant downcore trend in 56Fe hyam. 447
AVS was detected at 3 cm depth, suggesting that sulfidization starts at this depth, 448
which matches the slight SO42--drawdown (Fig. 4). Pyrite, however, is already present in the 449
surface sediment. Bioturbation might have transported iron sulfides previously formed in 450
the deeper part of the sediments towards the sediment surface. There, AVS is prone to 451
oxidation whereas pyrite is less susceptible to oxidation and survives longer before being 452
buried again into the anoxic zone. 453
The 56Fe
Feaq trend towards a slightly heavier value of -0.9 454
to -1.3 at 1.5 cm and at 4.5 cm, where DIR dominates, is explained by oxidative 455
precipitation of Fe that preferentially removes light Fe isotopes (Staubwasser et al. 2013). 456
Since the water column above the sediment is fully oxic, Fe-oxides must precipitate at the 457
sediment surface. The oxidative layer, however, only extents to about 1 cm. Directly below, 458
DIR dominates as indicated by the low 56Fe
Feaq. Below 5 cm, and in the sample at 3.5 cm, 459
56Fe
Feaq is only -0.4 . We suggest that at these depths, AVS formation removes light Fe 460
isotopes from solution. The sediment core was significantly bioturbated and the 3.5 cm 461
sample might reflect local AVS formation in a burrow with elevated TOC contents. Since the 462
Fe(II)aq profile suggests maximum rates of DIR at about 6 cm, DIR and AVS formation seem to 463
coincide at least between 3 and 6 cm depth. Below 18 cm, 56Fe
Feaq reaches values of about 464
zero suggesting that DIR is no longer significant and Fe diagenesis is dominated by reactions 465
with H2S. 466
21
3.2.3 Acetate-leachable iron fraction
468
The comparatively high amounts of Feaca found at site HE337-1 (0.16±0.05 wt%) are 469
unlikely to be due to the presence of siderite or AVS. AVS only accounts for up to 8% of the 470
Feaca fraction. The depth of the AVS-maximum (17-21 cm), however, coincides with a local 471
minimum in 56Fe
aca, so the low 56Feaca values at these depths might result from dissolution 472
of the 56Fe-depleted amorphous Fe sulfides (Guilbaud et al. 2013) during the Na-acetate 473
extraction. Siderite is generally considered rare in modern shallow organic-rich marine 474
sediment as it is thermodynamically unstable in the presence of H2S (Haese 2006). 475
Organoclastic sulfate reduction is clearly occurring in these sediments, as indicated by the 476
presence of AVS and the broad ferruginous zone. As such, even though H2S is quantitatively 477
removed from solution by reaction with Fe minerals (Fig. 4), siderite would not be expected 478
to form in these sediments. Additionally, 56Fe
Fe(II)aq data support an absence of authigenic 479
siderite formation: Abiotic siderite precipitation is characterized by a preferential uptake of 480
light isotopes from Fe(II)aq. The respective fractionation factor given by Wiesli et al. (2004) is 481
56Fe
Fe(II)aq-siderite = +0.48±0.22 . If Feaca with 56FeFeaca ranging between -1 and F 482
was mainly derived from authigenic siderite, respective 56Fe
Fe(II)aq values would need to be 483
between -0.5 and 0.5 In the top 10 cm (where DIR dominates) 56Fe
Fe(II)aq values are, 484
however, light (-0.4 to - compared to 56Fe Feaca. 485
The Feaca extraction does not include Fe(II)aq as this has been removed by washing 486
the samples with 1 M MgCl2 before the sequential extraction. Without performing a washing 487
step, Fe(II)aq would potentially amount to a maximum of ~20 µg/g sediment, corresponding 488
to ~2% of the Feaca pool. The above considerations exclude siderite, AVS, and Fe(II)aq as 489
forming a significant proportion of the Na-acetate leached fraction. Instead, we suggest that 490
22
DIR (e.g. Beard et al. 2003a, Williams and Scherer 2004, Crosby et al. 2005, 2007, Mikutta et 492
al. 2009), or Fe(II) that has formed at the surface of Fe oxide minerals via direct abiotic 493
reaction with sulfide, but which dissolves only slowly from the mineral surface at 494
circumneutral pH (Poulton 2003, Poulton et al. 2004). Crosby et al. (2005, 2007) investigated 495
isotopic fractionation during DIR using synthesized goethite and hematite, and measured 496
acetate-leached Fe(II)sorb with negative 56Fe values resembling those of Fe(II)aq ( 56Fe Fe(II)aq-497
Fe(II)sorb=-0.87±0.09 and -0.30±0.08 for goethite and hematite, respectively). Fe(II)sorb 498
derives from 56Fe-depleted pore-water and undergoes electron transfer and Fe(II)-Fe(III) 499
atom exchange with a reactive Fe(III) layer on the ferric substrate (Williams and Scherer 500
2004; Crosby et al. 2005, 2007). The oxide surface becomes more and more enriched in 56Fe 501
balancing out the light Fe(II)aq (Crosby et al. 2005, 2007). Fe(II)sorb thus represents an 502
intermediate between the light Fe(II)aq and isotopically heavy reactive Fe(III). The natural 503
sediments investigated here represent a mineralogically much more complex environment. 504
Nevertheless, we observe trends that resemble those shown in laboratory studies. Therefore 505
we suggest that the underlying processes observed are the same and the light 56Fe values 506
we measure for the Feaca pool likely dominantly reflect Fe(II) at the mineral surface that is 507
fractionated by coupled electron and atom exchange. 508
Our data show variations in 56Fe
Feaca-Fehyam of between -0.7 to 0.6 , which is distinct 509
from the fractionation factors found by Crosby et al. (2007). Their 56Fe
Fe(II)sorb-Fe(III)react is 510
~-1.75 for goethite and -2.65 for hematite experiments. However, the processes at our 511
study site take place in an open system with diffusive Fe(II)aq transport, preferential removal 512
of 54Fe from Fe(II)
aq by sulfide precipitation, and non-controlled exposure times of ferric 513
23
correspond to the reactive Fe(III) layer (not to the whole ferric substrate), the fractionation 515
factors are not directly comparable. 516
The 56Fe measurements suggest that of the unsulfidized solid phase Fe pools in 517
modern DIR-dominated marine sediments, the acetate-leachable pool is the most dynamic. 518
A sequential extraction for marine sediments that uses acetate as a first step followed by 519
hydroxylamine-HCl or 0.5 M HCl leaching is thus to be preferred over leaching with Na-520
dithionite alone. Leaching by Na-dithionite dissolves a mixture of Fe fractions that are 521
otherwise distinct in origin, reactivity, and isotopic composition and does not selectively 522
resolve the pools truly affected by DIR. Similarly, extractions using 0.5 M HCl alone (i.e. not 523
including the Feaca extraction first) dissolve the total Fe fraction, which 524
mainly includes three isotopically distinct Fe pools: the light Feaca pool that has been shown 525
here to mainly comprise surface-reduced Fe(II), unaltered poorly crystalline hydrous ferric 526
oxides such as ferrihydrite, and 56Fe-enriched reactive Fe at the oxide surface (as identified 527
by Williams and Scherer 2004 and Crosby et al. 2005, 2007). Interpretation of the acetate 528
fraction and its isotopic composition, however, can be problematic where a discrimination 529
between AVS-Fe, surface-reduced Fe(II), and siderite is not possible and where pore-water 530
56Fe data are not available. 531
532
4 Conclusions
533
We have developed a procedure to complement an existing sequential extraction 534
method for Fe phases in marine sediment, to enable stable Fe isotope analysis on the 535
leachates. Processing of the samples for matrix removal did not lead to significant Fe isotope 536
fractionation. This new method was applied to surface sediments collected from the 537
24
d 56Fe values of individual reactive Fe pools demonstrates their different genetic 539
origin: ferrihydrite/lepidocrocite showed 56Fe values (- as they 540
likely include authigenic/secondary phases originating from light Fe(II)aq released into the 541
pore-water by DIR. The detrital origin of the goethite/hematite and magnetite fractions was 542
56Fe G not considerably involved
543
in early diagenetic Fe cycling at this locality. The 56Fe data show large downcore 56Fe 544
variations in the acetate-leachable fraction. This trend could not be explained by AVS-Fe as 545
respective concentrations were too low. Furthermore, diagenetic siderite was excluded as a 546
significant contributor to the acetate-leachable fraction. We conclude that in these 547
sediments the Na-acetate extraction dominantly comprises surface-reduced Fe(II) which 548
shows a downcore isotopic trend similar to that for Fe(II)aq. Although more complex to 549
interpret based on the variety of processes that occur in natural sediments, our data are 550
consistent with the previous laboratory results of Crosby et al. (2005, 2007), who showed 551
that Fe(II)sorb is (isotopically) an intermediate between Fe(II)aq and the ferric substrate. 552
Leaching sediments by 0.5 M HCl or Na-dithionite alone would not resolve this. With 553
extraction by 0.5 M HCl, the isotopically light Fe(II) would be collected together with the 554
56Fe-enriched reactive Fe(III) layer at the mineral-surface and the unfractionated initial ferric 555
substrate. The combination of sequential Fe extractions and subsequent 56Fe analyses as 556
performed in this study represents an approach that can be useful for a broad range of 557
scientific questions in ancient and modern environments characterized by severe redox 558
changes or where control mechanisms for mineral formation (biotic vs. abiotic) are not fully 559
understood. 560
25
Acknowledgments: We thank J. Scheld, M. Harak, and J. Menges for assistance in the 562
laboratory at the University of Cologne and appreciate the help of Ingrid Stimac (Alfred 563
Wegener Institute) concerning sulfate measurements and assistance during total digestion 564
of bulk sediments. R. Guilbaud is thanked for giving support during AVS and pyrite 565
determinations at the University of Leeds. X-ray diffractions of synthetic minerals were 566
performed by P. Held (University of Cologne). We further acknowledge F. Wombacher for 567
support concerning MC-ICP-MS at the Steinmann Institute in Bonn and Alison McAnena for 568
producing synthetic minerals. Finally, we thank Jeremy Owens and an anonymous reviewer 569
for helpful comments on the manuscript. This study was funded by the German Research 570
Foundation (DFG) within Priority P A Research with Comparable 571
I A “ I A and is associated to the IMCOAST project (Impact of 572
climate induced glacial melting on marine coastal systems in the western Antarctic Peninsula 573
region) (grant numbers STA 936/5-1 and KA 2769/3-1). We acknowledge additional funding 574
by the Helmholtz Association (Alfred Wegener Institute, Helmholtz Centre for Polar and 575
Marine Research) in the framework of the research programs PACES I and PACES II. Data of 576
this study are available via the Pangaea database. 577
578
References
579
Anbar, A.D. and O. Rouxel (2007) Metal stable isotopes in paleoceanography. Annual Review 580
of Earth and Planetary Sciences 35, 717 746. 581
Beard, B.L., C.M. Johnson, J.L. Skulan, K.H. Nealson, L. Cox, and H. Sun (2003a) Application of 582
Fe isotopes to tracing the geochemical and biological cycling of Fe. Chemical Geology 195, 583
26
Beal, E.J., C.H. House, and V.J. Orphan (2009) Manganese- and iron-dependant marine 585
methane oxidation. Science 325, 184-187. 586
Beard, B.L., C.M. Johnson, K.L. Von Damm, and R.L. Poulson (2003b) Iron isotope constraints 587
on Fe cycling and mass balance in oxygenated Earth oceans. Geology 31, 629-632. 588
Canfield, D.E., R. Raiswell, J.T. Westrich, C.M. Reaves and R.A. Berner (1986), The use of 589
chromium reduction in the analysis of reduced inorganic sulfur in sediments and shales. 590
Chemical Geology 54, 149 155. 591
Canfield, D.E. (1988) Sulfate reduction and the diagenesis of iron in anoxic marine 592
sediments. Ph.D. thesis. Yale University, 248 pp. 593
Canfield, D.E. (1989) Reactive iron in marine sediments. Geochimimica et Cosmochimica 594
Acta 53(6), 619 632. 595
Canfield, D.E., R. Raiswell, and S. Bottrell (1992) The reactivity of sedimentary iron minerals 596
towards sulfide. American Journal of Science 292, 659 683. 597
Chester, R. and M.J. Hughes (1967) A chemical technique for the separation of ferro-598
manganese minerals, carbonate minerals and adsorbed trace elements from pelagic 599
sediments. Chemical Geology 2, 249 262. 600
Conway, T.M. and S.G. John (2014) Quantification of dissolved iron sources to the North 601
Atlantic Ocean. Nature 511, 212 215. 602
Cornell, R.M. and U. Schwertmann (1996) The iron oxides: structure, properties, reactions, 603
occurrences and uses. VCH Publishers, Weinheim, Germany. 604
Cornwell, J.C. and J.W. Morse (1987) The characterization of iron sulfide minerals in anoxic 605
27
Crosby, H.A., C.M. Johnson, E.E. Roden, and B.L. Beard (2005) Coupled Fe(II)-Fe(III) electron 607
and atom exchange as a mechanism for Fe isotope fractionation during dissimilatory iron 608
oxide reduction. Environmental Science and Technology 39, 6698 6704. 609
Crosby, H.A., E.E. Roden, C.M. Johnson, and B.L. Beard (2007) The mechanism of iron isotope 610
fractionation produced during dissimilatory Fe(III) reduction by Shewanella putrefaciens
611
and Geobacter sulfurreducens. Geobiology 5, 169 189. 612
Dickens, G.R., M. Kölling, D.C. Smith, L. Schnieders, and the IODP Expedition 302 Scientists 613
(2007) Rhizon sampling of pore waters on scientific drilling expeditions: An example from 614
the IODP Expedition 302, Arctic Coring Expedition (ACEX). Proc. IODP Scientific Drilling 4, 615
doi:10.22 04/iodp.sd.4.08.2007. 616
Egger M., O. Rasigraf, C.J. “ T J M “ M J T R C V N 617
B B K K F E C.P. Slomp (2015) Iron-mediated anaerobic oxidation of 618
methane in brackish coastal sediments. Environmental Science and Technology 49, 277-619
283. 620
Ferdelman, T.G. (1988) The distribution of sulfur, iron, manganese, copper, and uranium in a 621
salt marsh sediment core as determined by a sequential extraction method. Master thesis, 622
University Delaware. 623
Guelke, M., F. von Blanckenburg, R. Schoenberg, M. Staubwasser, and H. Stuetzel (2010) 624
Determining the stable Fe isotope signature of plant-available iron in soils. Chemical 625
Geology 277, 269 280. 626
Guilbaud, R., I.B. Butler, and R.M. Ellam (2013) Abiotic pyrite formation produces a large Fe 627
isotope fractionation. Science 332, 1548 1551. 628
Haese, R.R. (2006) The Biogeochemistry of Iron. In: Schulz H.D., Zabel, M. (editors) Marine 629
28
Haese, R.R., K. Wallmann, A. Dahmke, U. Kretzmann, P.J. Müller and H.D. Schulz (1997) Iron 631
species determination to investigate early diagenetic reactivity in marine sediments. 632
Geochimica et Cosmochimica Acta 61(1), 63 72. 633
Hebbeln, D., C. Scheurle, and F. Lamy (2003) Depositional history of the Helgoland mud area, 634
German Bight, North Sea. Geo-Marine Letters 23, 81 90. 635
Henkel, S., J.M. Mogollón, Kerstin Nöthen, C. Franke, K. Bogus, E. Robin, A. Bahr, M. 636
Blumenberg, T. Pape, R. Seifert, C. März, G.J. de Lange, and S. Kasten (2012) Diagenetic 637
barium cycling in Black Sea sediments A case study for anoxic marine environments. 638
Geochimica et Cosmochimica Acta 88, 88 105. 639
Hertweck, G. (1983) Das Schlickgebiet in der inneren Deutschen Bucht. Aufnahme mit dem 640
Sedimentechographen. Senckenbergiana marit 15, 219 249. 641
Homoky, W.B., S. Severmann, R.A. Mills, P.J. Statham, and G.R. Fones (2009) Pore-fluid Fe 642
isotopes reflect the extent of benthic Fe redox recycling: Evidence from continental shelf 643
and deep-sea sediments. Geology, 37(8), 751 754. 644
Homoky, W.B., S.G. John, T.M. Conway, and R.A. Mills (2013) Distinct iron isotopic signatures 645
and supply from marine sediment dissolution. Nature Communications, 4:2143. 646
Huerta-Diaz, M. and J.W. Morse (1990) A quantitative method for determination of trace 647
metal concentrations in sedimentary pyrite. Marine Chemistry 29, 119 144. 648
Hyacinthe, C. and P. van Cappellen (2004) An authigenic iron phosphate phase in estuarine 649
sediments: composition, formation and chemical reactivity. Marine Chemistry 91, 227 251. 650
Jensen, M.M., B. Thamdrup, S. Rysgaard, M. Holmer, and H. Fossing (2003) Rates and 651
regulation of microbial iron reduction in sediments of Baltic-North Sea transition. 652
29
Johnson, C.M, B.L. Beard, and E.E. Roden (2008) The iron isotope fingerprints of redox and 654
biogeochemical cycling in modern and ancient Earth. Annual Review of Earth and Planetary 655
Sciences 36, 457 493. 656
Kasten, S., T. Freudenthal, F.X. Gingele, and H.D. Schulz (1998) Simultaneous formation of 657
iron-rich layers at different redox boundaries in sediments of the Amazon deep-sea fan 658
Geochimica et Cosmochimica Acta 62(13), 2253 2264. 659
Kostka, J.E. and G.W. Luther (1994) Partitioning and speciation of solid iron in saltmarsh 660
sediments. Geochimica et Cosmochimica Acta 58, 1701 1710. 661
Lohan, M.C., A.M. Aguilar-Islas, R.P. Franks and K.W. Bruland (2005) Determination of iron 662
and copper in seawater at pH 1.7 with a new commercially available chelating resin, NTA 663
Superflow. Analytica Chimica Acta 530, 121 129. 664
Lord III, C.J. (1980) The chemistry and cycling of iron, manganese and sulfur in a salt marsh 665
sediment, Dissertation thesis, University of Delaware. 666
März, C., J. Hoffmann, U. Bleil, G.J. de Lange, and S. Kasten (2008) Diagenetic changes of 667
magnetic and geochemical signals by anaerobic methane oxidation in sediments of the 668
Zambezi deep-sea fan (SW Indian Ocean). Marine Geology 255, 118-130. 669
McKeague, J.A. and J.H. Day (1966) Dithionite- and oxalate-extractable Fe and Al as aids in 670
differentiating various classes of soils. Canadian Journal of Soil Science 46, 13 22. 671
Mehra, O.P. and M.L. Jackson (1960) Iron oxide removal from soils and clays by a dithionite-672
citrate system buffered with sodium bicarbonate. 7th National Conference on Clays and 673
Clay Minerals, 317 327. 674
Mikutta, C., J.G. Wiederhold, O.A. Cirpka, T.B. Hofstetter, B. Bourdon, U. von Gunten (2009) 675
Iron isotope fractionation and atom exchange during sorption of ferrous iron to mineral 676
30
Oni, O., T. Miyatake, S. Kasten, T. Richter-Heitmann, D. Fischer, L. Wagenknecht, A. Kulkarni, 678
M. Blumers, S.I. Shylin, V. Ksenofontov, B.F.O. Costa, G. Klingelhöfer, and M.W. Friedrich 679
(2015) Distinct microbial populations are tightly linked to the profile of dissolved iron in the 680
methanic sediments of the Helgoland mud area, North Sea. Frontiers in Microbiology, doi: 681
10.3389/fmicb.2015.0036. 682
Phillips, E.J.P. and D.R. Lovley (1987) Determination of Fe(III) and Fe(II) in oxalate extracts of 683
sediment. Soil Science Society of America Journal 51, 938 941. 684
Poulton, S.W. (2003) Sulfide oxidation and iron dissolution kinetics during the reaction of 685
dissolved sulfide with ferrihydrite. Chemical Geology 202, 79-94. 686
Poulton, S.W., M.D. Krom, and R. Raiswell. (2004) A revised scheme for the reactivity of iron 687
(oxyhydr)oxide mineral towards dissolved sulfide. Geochimica et Cosmochimica Acta 68, 688
3703 3715. 689
Poulton, S.W. and D.E. Canfield (2005) Development of a sequential extraction procedure for 690
iron: implications for iron partitioning in continentally derived particulates. Chemical 691
Geology 214, 209 221. 692
Poulton, S.W. and D.E. Canfield (2011) Ferruginous conditions: A dominant feature of the 693
E E 112.
694
Raiswell, R., D.E. Canfield, and R.A. Berner (1994) A comparison of iron extraction methods 695
for the determination of degree of pyritisation and the recognition of iron-limited pyrite 696
formation. Chemical Geology 111, 101 110. 697
Raiswell, R., H.P. Vu, L. Brinza, L.G. Benning (2010) The determination of labile Fe in 698
ferrihydrite by ascorbic acid extraction: methodology, dissolution kinetics and loss of 699
31
Raiswell and Canfield (2012) The iron biogeochemical cycle past and present. Geochemical 701
Perspectives 1(1). 702
Riedinger, N., K. Pfeifer, S. Kasten, J.F.L. Garming, C. Vogt, and C. Hensen (2005) Diagenetic 703
alteration of magnetic signals by anaerobic oxidation of methane related to a change in 704
sedimentation rate. Geochimica et Cosmochimica Acta 69(16), 4117 4126. 705
Riedinger N., M.J. Formolo, T.W. Lyons, S. Henkel, A. Beck, and S. Kasten (2014) An inorganic 706
geochemical argument for coupled anaerobic oxidation of methane and iron reduction in 707
marine sediments. Geobiology 81. 708
Schoenberg, R. and von F. Blanckenburg (2005), An assessment of the accuracy of stable Fe 709
isotope ratio measurements on samples with organic and inorganic matrices by high-710
resolution multicollector ICP-MS. International Journal of Mass Spectrometry 242, 257 711
272. 712
Scholz, F., S. Severmann, J. McManus, A. Noffke, U. Lomnitz, and C. Hensen (2014) On the 713
isotope composition of reactive iron in marine sediments: Redox shuttle versus early 714
diagenesis. Chemical Geology 389, 48 59. 715
Schwertmann, U. (1964) Differenzierung der Eisenoxide des Bodens durch photochemische 716
Extraktion mit saurer Ammoniumoxalat-Lösung. Zeitschrift zur Pflanzenernährung und 717
Bodenkunde, 195, 194 202. 718
Seeberg-Elverfeldt, J., M. Schlüter, T. Feseker and M. Kölling (2005), Rhizon sampling of 719
porewaters near the sediment-water interface of aquatic systems. Limnology and 720
Oceanography: Methods 3, 361 371. 721
Segarra, K.E.A., C. Comerford, J. Slaughter, and S.B. Joye (2013). Impact of electron acceptor 722
availability on the anaerobic oxidation of methane in coastal freshwater and brackish 723
32
Severmann, S., C.M. Johnson, B.L. Beard, and J. McManus (2006) The effect of early 725
diagenesis on the Fe isotope compositions of porewaters and authigenic minerals in 726
continental margin sediments. Geochimica et Cosmochimica Acta 70, 2006 2022. 727
Severmann, S., J. McManus, W.M. Berelson, and D.E. Hammond (2010) The continental shelf 728
benthic iron flux and its isotope composition. Geochimica et Cosmochimica Acta, 74, 3984 729
4004. 730
Sivan, O., M. Adler, A. Pearson, F. Gelman, I. Bar-Or, S.G. John, and W. Eckerte (2011) 731
Geochemical evidence for iron-mediated anaerobic oxidation of methane. Limnology and 732
Oceanography, 56(4), 1536 1544. 733
Sivan, O., G. Antler, A.V. Turchyn, J.J. Marlow, and V.J. Orphan (2014) Iron oxides stimulate 734
sulfate-driven anaerobic methane oxidation in seeps. Proceedings of the National Academy 735
of Sciences of the United States of America 736
Slomp, C.P., J.F.P. Malschaert, L. Lohse, and W. Van Raaphorst (1997) Iron and manganese 737
cycling in different sedimentary environments on the North Sea continental margin. 738
Continental Shelf Research 17(9), 1083-1117. 739
Staubwasser, M., F. v. Blanckenburg, and R. Schoenberg (2006) Iron isotopes in the early 740
marine diagenetic iron cycle. Geology 34, 629 632. 741
Staubwasser, M., R. Schoenberg, F. von Blanckenburg, S. Krüger, and C. Pohl (2013) Isotope 742
fractionation between dissolved and suspended particulate Fe in the oxic and anoxic water 743
column of the Baltic Sea. Biogeosciences 10, 233 245. 744
Stookey, L. (1970) Ferrozine A new spectrophotometric reagent for iron. Analytical 745
33
Strelow, F.W.E. (1980) Improved separation of iron from copper and other elements by 747
anion-exchange chromatography on a 4% cross-linkage resin with high concentrations of 748
hydrochloric acid. Talanta 27, 727 732. 749
Stucki, J.W., B.A. Goodman, and U. Schwertmann (Eds) (1988) Iron in soils and clay minerals. 750
D. Reidel, Dordrecht, the Netherlands. 751
Tessier, A., P.G.C. Campbell, M. Bisson, (1979) Sequential extraction procedure for the 752
speciation of particulate trace metals. Analytical Chemistry 51, 844 851. 753
Wiederhold, J.G., N. Teutsch, S.M. Kraemer, A.N. Halliday, and R. Kretschmar (2007a) Iron 754
isotope fractionation during pedogenesis in redoximorphic soils. Soil Science Society of 755
America Journal 71(6), 1840 1850. 756
Wiederhold, J.G., N. Teutsch, S.M. Kraemer, A.N. Halliday, and R. Kretzschmar (2007b) Iron 757
isotope fractionation in oxic soils by mineral weathering and podsolization. Geochimica et 758
Cosmochimica Acta 71 (23), 5821 5833. 759
Wiesli, R.A., B.L. Beard, and C.M. Johnson (2004) Experimental determination of Fe isotope 760
F II in abiotic systems.
761
Chemical Geology 211, 343 362. 762
Williams, A.G.B. and M.M. Scherer (2004) Spectroscopic evidence for Fe(II)-Fe(III) electron 763
transfer at the iron oxide-water interface. Environmental Science and Technology 38, 764
4782 4790. 765
Wu, L., B.L. Beard, E.E. Roden, and C.M. Johnson (2011) Stable iron isotope fractionation 766
between aqueous Fe(II) and hydrous ferric oxide. Environmental Science and Technology 767
34 769
Fig. 1: Chemical processing of iron extracts for Fe isotope analysis. 770
35 772
773
Fig. I 56Fe) of a) the Certipur® Fe solution without addition of leaching reagents and 774
chemical processing (mineral mix, Certipur® Fe) and after addition of reagents and subsequent 775
purification and b) of the mineral mix standard. Error bars are the standard deviation (1SD). The 776
light greyish area indicates 2SD of the reference standard. 777
778
779
Fig. 3: Dissolution of non-target minerals by chemical treatment with acetate, hydroxylamine-HCl, 780
Na-dithionite and dissolution of target (ferrihydrite) and non-target minerals (goethite, hematite, 781
and magnetite) by 0.5 M HCl. The dashed lines indicate optimum extraction times for sediment 782
samples at room temperature as given by Poulton and Canfield (2005) and Kostka and Luther 783
(1994), respectively. Tests with dithionite were performed with magnetite synthesized after Cornell 784
[image:36.595.126.473.93.347.2] [image:36.595.71.523.495.608.2]