R E S E A R C H
Open Access
Plasma nuclear and mitochondrial DNA levels as
predictors of outcome in severe sepsis
patients in the emergency room
Chia-Te Kung
1, Sheng-Yuan Hsiao
1, Tsung-Cheng Tsai
1, Chih-Min Su
1, Wen-Neng Chang
2, Chi-Ren Huang
2,
Hung-Chen Wang
3, Wei-Che Lin
4, Hsueh-Wen Chang
6, Yu-Jun Lin
3,6, Ben-Chung Cheng
6,5, Ben Yu-Jih Su
5,
Nai-Wen Tsai
2,7*†and Cheng-Hsien Lu
2,6,7*†Abstract
Background and aim:The sensitivity and specificity of biomarkers and scoring systems used for predicting fatality of severe sepsis patients remain unsatisfactory. This study aimed to determine the prognostic value of circulating plasma DNA levels in severe septic patients presenting at the Emergency Department (ED).
Methods:Sixty-seven consecutive patients with severe sepsis and 33 controls were evaluated. Plasma DNA levels were estimated by real-time quantitative polymerase chain reaction assay using primers for the humanβ -hemoglobin and ND2 gene. The patients’clinical and laboratory data on admission were analyzed.
Results:The median plasma nuclear and mitochondria DNA levels for severe septic patients on admission were significantly higher than those of the controls. The mean plasma nuclear DNA level on admission correlated with lactate concentration (γ= 0.36,p= 0.003) and plasma mitochondrial DNA on admission (γ= 0.708,p<0.001). Significant prognostic factors for fatality included mechanical ventilation within the first 24 hours (p= 0.013), mean sequential organ failure assessment (SOFA) score on admission (p= 0.04), serum lactate (p <0.001), and both plasma nuclear and mitochondrial DNA on admission (p <0.001). Plasma mitochondrial DNA was an independent predictor of fatality by stepwise logistic regression such that an increase by one ng/mL in level would increase fatality rate by 0.7%.
Conclusion:Plasma DNA has potential use for predicting outcome in septic patients arriving at the emergency room. Plasma mitochondrial DNA level on admission is a more powerful predictor than lactate concentration or SOFA scores on admission.
Keywords:Hospital mortality, Mitochondrial DNA, Nucleus DNA, Severe sepsis
Background
Severe sepsis and septic shock remain a great challenge in critical care because of their common occurrence, high costs of care, and significant mortality. They are the major causes of death in patients admitted to the emer-gency department (ED) and intensive care units (ICU),
with mortality rates between 30% and 60% in different reports [1]. Numerous biomarkers for predicting mor-bidity and mortality in the critical care setting have been evaluated, but none have been proven entirely useful.
Plasma DNA can be defined as DNA fragments that are detectable in extracellular fluid and are of two types: “free” DNA present in plasma (including DNA packed into nucleosomes of apoptotic cells) or DNA associated with circulating lymphocytes (considered a minor com-ponent) [2]. Circulating plasma DNA has recently received increasing attention and has been studied in various acute and chronic disorders. Based on current evidence, DNA is released into the circulation from
* Correspondence:[email protected];[email protected]
†Equal contributors
2Department of Neurology, Chang Gung University College of Medicine,
Kaohsiung, Taiwan
7Department of Neurology, Kaohsiung Chang Gung Memorial Hospital,
Chang Gung University College of Medicine, No. 123, Ta Pei Road, Niao Sung Hsiang, Kaohsiung City 833, Taiwan
Full list of author information is available at the end of the article
apoptotic and necrotic cells, although the exact mechanism is unclear [3,4]. An increase in plasma DNA concentration may be due to either increased liberation from cells or decreased clearance efficiency. Experimental animal studies have produced evidence suggesting that the liver and kidneys are the prime candidates for plasma DNA removal [5]. Rapid active liberation processes whereby DNA is released into plasma from either cell tissues or leucocytes are also possible. However, in critically ill conditions, organs responsible for elimination may be damaged as a consequence of ongoing systemic inflammation.
The early and high concentrations of plasma β -globulin DNA observed in various critical conditions, including trauma, stroke, myocardial infarction and septic shock, have been proposed as prognostic markers [6-11]. Apoptosis plays an important role in the patho-physiologic process of sepsis and circulating DNA has been detected in the plasma of septic patients [12]. Fur-thermore, fragmented DNA packed during apoptosis has been found in patients with severe sepsis [13]. Pre-liminary data from ICU and bacteremia patients suggest that admission plasma DNA concentrations may be higher in non-survivors than in survivors [14,15].
The aim of the present study was to investigate the prognostic value of circulating plasma DNA levels in patients with severe sepsis in the ED and intensive care setting.
Patients and methods
Study population and definition
This prospective study on the time course of plasma nuclear and mitochondrial DNA levels in severe sepsis and septic shock patients was conducted over a one-year period (January to December 2011). Sixty-seven adult non-traumatic patients at Chang Gung Memorial Hospital in Kaohsiung, a 2482-bed acute care teaching hospital that provides both primary and tertiary referral care, were enrolled. The hospital’s Institutional Review Committee on Human Research approved the study protocol and all of the patients provided written informed consent.
All patients aged >18 years consecutively admitted from the ED were screened daily for severe sepsis and septic shock according to specific criteria defined by the American College of Chest Physicians/Society of Critical Care Medicine. These criteria were suspected or con-firmed infection, two or more manifestations of systemic inflammatory response syndrome, and at least one sepsis-induced acute organ dysfunction. Patients who met all three criteria were included [16].
For comparison, 33 age- and sex-matched healthy volunteers who received annual physical check-up and without clinical evidence of infection were recruited as controls.
Clinical assessment and treatment
The medical records were prospectively recorded using pre-existing standardized evaluation forms that included demographic data, Acute Physiology and Chronic Health Evaluation (APACHE) II score, and the Sequen-tial Organ Failure Assessment (SOFA) score, which was calculated during the first 24 hours of admission to as-sess the severity of organ dysfunction. Basic laboratory test, lactate concentration, B-type natriuretic peptide, and inflammatory markers (i.e., plasma C-reactive pro-tein and procalcitonin) were taken on ED admission. Data on the source of infection and use of antibiotics were recorded.
The course of various organ dysfunctions and support-ive treatments, including vasoactsupport-ive and ventilator ther-apies and renal replacement therther-apies, were recorded. Physicians evaluated the association of existing organ dysfunction and severe sepsis daily. Severe organ dys-function or organ failure was defined as SOFA score≥3. Patients on chronic dialysis treatment on admission and those with severe chronic liver disease were excluded from the acute organ dysfunction assessment. It was also institutional practice to consult an infectious disease specialist for anti-microbial treatment according to treat-ment guidelines for different infectious etiologies during the first 24 hours, and the provision of hydrocortisone (300 mg/day) therapy for 4 days.
Blood sampling and assessment of plasma nuclear and mitochondrial DNA
Blood samples were collected on presentation to the ED (Day 1). Follow-up blood samples studies were obtained on Days 4 and 7 after admission to the wards or ICU. Under minimal tourniquet pressure, blood was taken from the antecubital vein using a sterile 19-gauge needle syringe in a single attempt while the patients was in a sitting position for at least 10 min. Peripheral venous blood (3 ml) was collected into EDTA-containing tubes. Two milliliters of whole blood was drawn from a periph-eral vein using a 0.9-mm needle, with the cuff pressure limited to 40 mm Hg. The other samples were kept in heparinized tubes (50 IU heparin/ml; Sarstedt, Numbrecht, Germany). Heparin was chosen as the anti-coagulant because of its superior results compared to ethylene-diaminetetra-acetic acid, citrate, and a special cocktail (132 mM ethylenediaminetetra-acetic acid, 0.7% hydroxychloroquine sulfate, and 20 U heparin/ml) in experimental conditions. Procedural details were as described previously [17,18].
10 min at 10,000 rpm. The upper portion of plasma was then removed by a Pasteur pipette and placed into a further clear tube and frozen at −20°C prior to extrac-tion. DNA was extracted from 200-μl plasma samples using a QIAamp Blood Kit (Qiagen, Frederick, MD) via the“blood and body fluid protocol”based on the manu-facturer’s instructions. The exact amount used was documented for calculation of DNA concentration.
Plasma DNA was measured with the β-globin and MT-ND2 genes by real-time quantitative polymerase chain reaction (RT-PCR) assay (Roche Lightcycler; Roche, Lewes, UK) based on continuous measurements of SYBR Green fluorescent dye that could bind to double-stranded DNA generated during PCR [17,18]. The β-globin gene was present in all nucleated cells of the body, while the MT-ND2 gene was specific to mito-chondrial DNA. The β-globin PCR system consisted of amplification primers β- globin-354F (5′-GTG CAC CTG ACT CCT GAG GAG A-3′) and β-globin- 455R (5′-CCT TGA TAC CAA CCT GCC CAG-3′). The 101-base-pair amplicon was detected using primer sequences and verified in the Genbank database (accession number U01317) [6]. The MT-ND2 PCR system consisted of the amplification primers MT-ND2-156F (5′-CAC AGA AGC TGC CAT CAA GTA-3′) and MT-ND2-245R (5′
-CCG GAG AGT ATA TTG TTG AAG AG-3′). The
90-base-pair amplicon was detected using primer sequences and verified in the Genbank database (accession number NC012920).
The generation of a plasma DNA standard curve was accomplished using human genomic DNA. The expres-sion of quantitative results as kilogenome-equivalents/l was as described previously [17,18]. One genome-equivalent was defined as the amount of a particular tar-get sequence contained in a single diploid human cell.
All tests were performed by a quality-controlled central laboratory at Chang-Gung Memorial Hospital. Concentrations of CRP were determined by enzyme immunoassay with a detection limit of <5 mg/dL (EMIT; Merck Diagnostica; Zurich, Switzerland), while PCT was
measured using Enzyme-Linked Fluorescent Assay
(VIDAS; bioMerieux; Ponte a Ema, Italy). Serum lactate levels were measured using a serum-based assay cata-lyzed by lactate oxidase (Vitros, Ortho Clinical Diagnos-tics, Rochester, NY).
Statistical analysis
Data were expressed as mean ± SD or median (inter-quartile range). Univariate analyses were compared using Student’s t-test while categorical variables were com-pared usingχ2 test or Fisher's exact test, as appropriate. Multiple comparisons among pairs of means were per-formed by multiple significant tests with Bonferroni method. Repeated measures of ANOVA were used to
compare plasma cell-free DNA at three different time points after severe sepsis. Analysis of covariance (ANCOVA) was used to compare the groups after con-trolling for potential confounding variables.
Correlation analysis was used to explore the rela-tionship among 24-h APACHE II score, SOFA score, Lactate, C-reactive protein, procalcitonin, creatinine concentration, and levels of plasma nuclear and mito-chondrial DNA of severe sepsis patients on admission. Stepwise logistic regression was used to evaluate the relationship between significant variables and thera-peutic outcomes, with adjustments for other potential confounding factors. Variables with zero cell count in a 2-by-2 table were eliminated from logistic analysis and only those strongly associated with fatality (p< 0.05) were included in the final model. Receivers operating characteristic (ROC) curves were used to estimate an optimal cut-off value for the use of both DNA nuclear and mitochondria DNA measurements for predicting death as well as the sensitivity and specificity of the test at this level. All statistical analyses were conducted using the SAS software package, ver. 9.1 (2002, SAS Statistical Institute, Cary, NC).
Results
Baseline characteristics of the study patients
The baseline characteristics of adult severe sepsis and septic shock cases (n = 67) and healthy controls (n = 33) showed no significant differences in underlying disease (i.e., hypertension, diabetes mellitus, and cardiac disease) (Table 1). The controls had median plasma nuclear DNA level of 25 ng/ml (range, 19–41 ng/ml) and median plasma mitochondria DNA level of 16 ng/ml (range, 7–23 ng/ml). The median plasma nuclear and mitochondria DNA levels for severe sepsis patients on ED admission were significantly higher at 436 ng/ml (range, 216–1140 ng/ml) and 149 ng/ml (range, 79– 304 ng/ml), respectively (bothp <0.001).
The median length of hospital stay was 14 days (range, 9–30 days). Furthermore, the mean first 24-h nuclear and mitochondria DNA concentrations were higher in patients who received mechanical ventilation in the ED compared to patients who did not (1603 vs. 715; p= 0.016 and 380 vs. 183;p= 0.047).
Time course of plasma nuclear and mitochondrial DNA levels
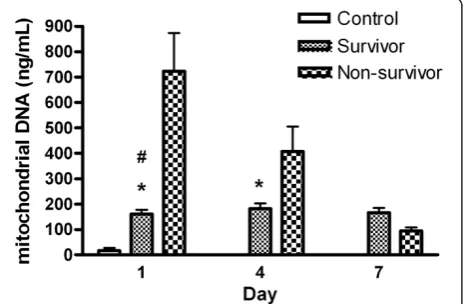
Time course of circulating nuclear DNA and mitochon-drial DNA in severe sepsis patients and control subjects were presented in Figure 1 and Figure 2, respectively. In patients with severe sepsis, the mean plasma nuclear DNA was significantly higher in non-survivors than in survivors on admission (2855 ± 2292 vs. 675 ± 904, p< 0.001) and 72-h later (2161 ± 2226 vs. 429 ± 255, p< 0.001). Mean mitochondrial DNA concentrations were also higher in non-survivors than in survivors on admission (723 ± 830 vs. 161 ± 128, p< 0.001) and 72-h later (406 ± 367 vs. 182 ± 129, p =0.001). Although plasma nuclear and mitochondrial DNA levels decreased after anti-microbial therapy, there were no significant differences between survivors and non-survivors at three time periods (Days 1, 4, and 7) (p =0.302 andp =0.073).
Correlation between plasma DNA and inflammatory biomarkers
By correlation analysis, the mean plasma nuclear DNA level on admission significantly correlated with lactate concentration (γ= 0.36,p= 0.003) and plasma mitochon-drial DNA on admission (γ= 0.708,p<0.001). There was no significant correlation between plasma nuclear DNA and C-reactive protein (γ= 0.047, p= 0.705), N-terminal brain natriuretic peptide (γ= 0.005, p= 0.971), and pro-calcitonin (γ=−0.104, p= 0.971). There were also no significant correlations between plasma mitochondrial DNA and lactate concentration (γ= 0.164,p= 0.185), C-reactive protein (γ=−0.093,p= 0.457), N-terminal brain natriuretic peptide (γ= 0.014,p= 0.922), and procalcito-nin (γ=−0.103,p= 0.432).
Outcome and prognostic factors
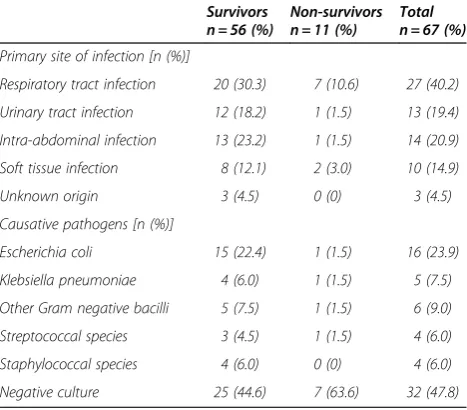
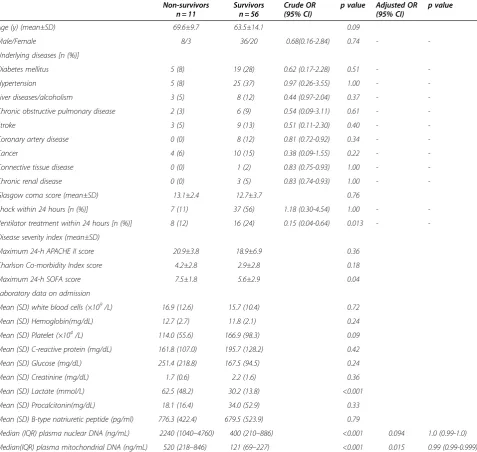
[image:4.595.57.291.111.379.2]Eleven of the 67 (16%) patients died in the hospital, in-cluding 29 who received concomitant steroid therapy on admission for sepsis. The case fatality in steroid users and non-users was 17% (5/29) and 15.8% (6/38), respect-ively (p= 0.874). Potential prognostic factors of the 67 severe septic patients were listed in Table 3. Statistical analysis of the clinical manifestations and laboratory data between survivors and non-survivors revealed that the following were significant: mechanical ventilation within the first 24 h (p= 0.013), mean SOFA score on admission (p= 0.04), serum lactate (p <0.001), and both the plasma nuclear (p <0.001) and mitochondrial DNA on admission (p <0.001). Of the variables used in the logistic regression (i.e., mechanical ventilation within the first 24 h, mean SOFA score on admission, serum lactate, and plasma nuclear and mitochondrial DNA on admission), only plasma mitochondrial DNA level was independently predictive of fatality, with a 0.7% increase in fatality rate per 1.0 ng/mL increase in level. The area Table 2 Source of infection and causative pathogens in
septic patients
Survivors
n = 56 (%) Non-survivorsn = 11 (%) Totaln = 67 (%)
Primary site of infection [n (%)]
Respiratory tract infection 20 (30.3) 7 (10.6) 27 (40.2)
Urinary tract infection 12 (18.2) 1 (1.5) 13 (19.4)
Intra-abdominal infection 13 (23.2) 1 (1.5) 14 (20.9)
Soft tissue infection 8 (12.1) 2 (3.0) 10 (14.9)
Unknown origin 3 (4.5) 0 (0) 3 (4.5)
Causative pathogens [n (%)]
Escherichia coli 15 (22.4) 1 (1.5) 16 (23.9)
Klebsiella pneumoniae 4 (6.0) 1 (1.5) 5 (7.5)
Other Gram negative bacilli 5 (7.5) 1 (1.5) 6 (9.0)
Streptococcal species 3 (4.5) 1 (1.5) 4 (6.0)
Staphylococcal species 4 (6.0) 0 (0) 4 (6.0)
[image:4.595.57.291.529.734.2]Negative culture 25 (44.6) 7 (63.6) 32 (47.8)
Table 1 Baseline characteristics of severe sepsis patients and control subjects
Control n = 33
Study Patients n = 67
p value
Age (y) (mean±SD) 66.3± 8.0 64.8± 13.8 0.57
Male (%) 66.7 65.7 1.00
Underlying diseases
Diabetes mellitus (%) 54.5 35.8 0.09
Hypertension (%) 60.6 44.8 0.20
Cardiac disease (%) 12.1 11.9 1.00
Systolic blood pressure (mmHg) (mean±SD)
143±15.2 112.2±42.3 <0.001
Diastolic blood pressure (mmHg) (mean±SD)
76.5±10.1 70.5±24.2 0.09
Laboratory data†
Mean (SD) WBC (×109/L) 6.8 (2.5) 15.9 (10.7) <0.001
Mean (SD) Platelet (×104/L) 234.4 (66.4) 158.2 (94.4) <0.001
Mean (SD) Hemoglobin(mg/dL) 13.6 (1.7) 11.9 (2.2) <0.001
Mean (SD) CRP (mg/dL) 1.2 (0.9) 189.6 (124.8) <0.001
Median (IQR) plasma nuclear DNA (ng/mL)
25 (19,41) 436 (216,1140) <0.001
Median(IQR) plasma mitochondrial DNA ( ng/mL)
16 (7,23) 149 (79,304) <0.001
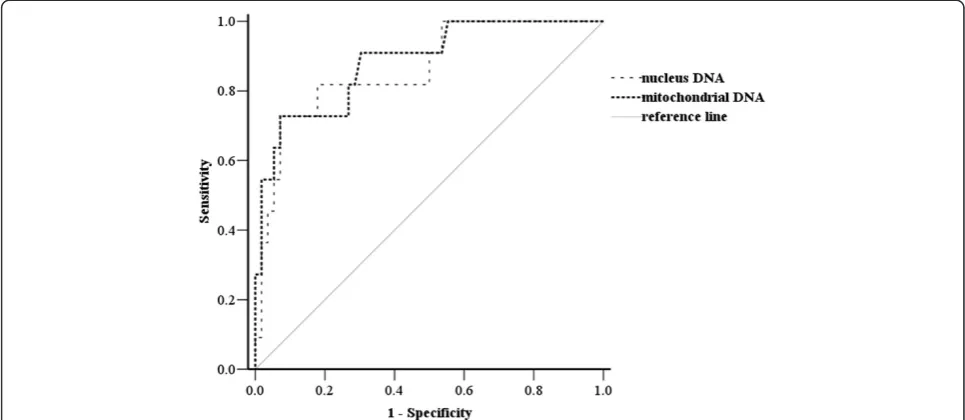
under the ROC curve for both plasma mitochondrial and nuclear DNA level on admission was 0.883 (p< 0.001, 95% CI, 0.774-0.992) and 0.864 (p< 0.001, 95% CI, 0.773-0.984), respectively (Figure 3). The cut-off value for both plasma mitochondrial and nuclear DNA for predicting hospital fatality was 198 ng/ml (91% sensi-tivity and 72% specificity) and 1012 ng/ml (82% sensitiv-ity and 82% specificsensitiv-ity), respectively.
Discussion
This study assessed serial circulating plasma nuclear and mitochondrial DNA levels in patients with severe sepsis and septic shock, and produced four major findings.
[image:5.595.60.538.102.554.2]First, both plasma nuclear and mitochondrial DNA con-centrations on admission are significantly higher in severe septic patients than in healthy controls. Second, both plasma nuclear and mitochondrial DNA concentra-tions on admission are significantly higher in non-survivors than in non-survivors. Third, both plasma nuclear and mitochondrial DNA levels increase shortly after severe infection and gradually decrease after antimicro-bial therapy. Furthermore, there were seven (7/11, 64%) fatal cases with imminent death within 7 days and their blood samples on Day 7 were not available. This may explain why the concentration rates of plasma DNA and plasma mitochondrial DNA were significant higher on Table 3 Prognostic factors of septic patients at the emergency room
Non-survivors
n = 11 Survivorsn = 56 Crude OR(95% CI) p value Adjusted OR(95% CI) p value
Age (y) (mean±SD) 69.6±9.7 63.5±14.1 0.09
Male/Female 8/3 36/20 0.68(0.16-2.84) 0.74 -
-Underlying diseases [n (%)]
Diabetes mellitus 5 (8) 19 (28) 0.62 (0.17-2.28) 0.51 -
-Hypertension 5 (8) 25 (37) 0.97 (0.26-3.55) 1.00 -
-Liver diseases/alcoholism 3 (5) 8 (12) 0.44 (0.97-2.04) 0.37 -
-Chronic obstructive pulmonary disease 2 (3) 6 (9) 0.54 (0.09-3.11) 0.61 -
-Stroke 3 (5) 9 (13) 0.51 (0.11-2.30) 0.40 -
-Coronary artery disease 0 (0) 8 (12) 0.81 (0.72-0.92) 0.34 -
-Cancer 4 (6) 10 (15) 0.38 (0.09-1.55) 0.22 -
-Connective tissue disease 0 (0) 1 (2) 0.83 (0.75-0.93) 1.00 -
-Chronic renal disease 0 (0) 3 (5) 0.83 (0.74-0.93) 1.00 -
-Glasgow coma score (mean±SD) 13.1±2.4 12.7±3.7 0.76
Shock within 24 hours [n (%)] 7 (11) 37 (56) 1.18 (0.30-4.54) 1.00 -
-Ventilator treatment within 24 hours [n (%)] 8 (12) 16 (24) 0.15 (0.04-0.64) 0.013 -
-Disease severity index (mean±SD)
Maximum 24-h APACHE II score 20.9±3.8 18.9±6.9 0.36
Charlson Co-morbidity Index score 4.2±2.8 2.9±2.8 0.18
Maximum 24-h SOFA score 7.5±1.8 5.6±2.9 0.04
Laboratory data on admission
Mean (SD) white blood cells (×109/L) 16.9 (12.6) 15.7 (10.4) 0.72
Mean (SD) Hemoglobin(mg/dL) 12.7 (2.7) 11.8 (2.1) 0.24
Mean (SD) Platelet (×104/L) 114.0 (55.6) 166.9 (98.3) 0.09
Mean (SD) C-reactive protein (mg/dL) 161.8 (107.0) 195.7 (128.2) 0.42
Mean (SD) Glucose (mg/dL) 251.4 (218.8) 167.5 (94.5) 0.24
Mean (SD) Creatinine (mg/dL) 1.7 (0.6) 2.2 (1.6) 0.36
Mean (SD) Lactate (mmol/L) 62.5 (48.2) 30.2 (13.8) <0.001
Mean (SD) Procalcitonin(mg/dL) 18.1 (16.4) 34.0 (52.9) 0.33
Mean (SD) B-type natriuretic peptide (pg/ml) 776.3 (422.4) 679.5 (523.9) 0.79
Median (IQR) plasma nuclear DNA (ng/mL) 2240 (1040–4760) 400 (210–886) <0.001 0.094 1.0 (0.99-1.0)
Median(IQR) plasma mitochondrial DNA (ng/mL) 520 (218–846) 121 (69–227) <0.001 0.015 0.99 (0.99-0.999)
Days 1 and 4 in the non-survivor group but similarly decreased in 7 days after treatment between the survivor and non-survivor groups. Lastly, significant prognostic factors for fatality include mechanical ventilation within the first 24 h, mean sequential organ failure assessment (SOFA) score on admission, serum lactate, and both plasma nuclear and mitochondrial DNA levels on admis-sion, but only plasma mitochondrial DNA level is an independent predictor of fatality. Its cut-off value is 198 ng/ml (91% sensitivity and 72% specificity) and any increase of 1.0 ng/mL increases fatality rate by 0.7%. Plasma mitochondrial DNA level on admission is a more powerful predictor than lactate concentration or SOFA scores on admission, which are commonly used in clin-ical practice.
The present study shows that lactate concentrations on admission correlate independently with admission plasma DNA concentration. Both measures show signifi-cant differences between survivors and non-survivors,
which may reflect similar mechanisms of septic shock-induced tissue hypoxia on apoptotic or necrotic cell death. Although the mechanisms underlying apoptosis in sepsis remain elusive, imbalance between oxygen delivery and consumption resulting in anaerobic glycoly-sis and lactate production are central features of severe septic infection. This may lead to oxygen deprivation, endothelial cell damage, and subsequent apoptotic cell death [19]. Previous studies indicate that circulating DNA originates from apoptotic and necrotic cells in cancer patients [4]. Huttunen et al. also showed that cell-free DNA expresses apoptotic fragmentation in bacteremia non-survivors [20], although the exact mechanism is not clear, reflecting the extent of cellular damage.
The present study reveals that circulating plasma nuclear and mitochondrial DNA concentrations are sig-nificantly higher in patients with mechanical ventilation on admission to the ED and in those who die within 6 days, and correlate highly with lactate concentrations. Thus, plasma nuclear and mitochondrial DNA concen-trations are also good indicators of clinical severity in the ED. Rhodes et al. measured plasma nuclear DNA levels in 52 consecutive severely ill patients with or with-out severe sepsis or septic shocks who were in various categories of underlying conditions (i.e., traumatic, surgi-cal, and non-surgical) and receiving heterogeneous treat-ments (i.e., surgical procedures, conservative treatment, or combined surgical and conservative management). However, only one blood sample was taken from each patient on admission. The study found that plasma nuclear DNA was higher in ICU patients than in healthy controls, and was higher in patients who developed sepsis or who subsequently died either in the ICU or in the ward [15].
In contrast, the current study enrolled non-traumatic, non-surgical severe septic patients at the ED patient. Both serial plasma nuclear and mitochondrial DNA levels were examined and demonstrated that both had potential use for predicting outcome in septic patients at the ED and plasma mitochondrial DNA level on admis-sion is a more powerful predictor than lactate concen-tration or SOFA scores on admission. The discrepancy between the two studies may be attributed to different methodologies (e.g. patients on enrollment, heteroge-neous treatments, and plasma DNA level), follow-up period (one blood sample vs. serial measurement), and statistical analysis methods.
[image:6.595.57.290.89.230.2]Because the changing pattern of time course in plasma nuclear DNA is similar to that of mitochondrial DNA, both may originate from the same tissues by similar mechanisms. However, there is no correlation between plasma DNA concentrations and the three biochemical markers in this study used to assess prognosis (i.e., C-reactive protein, brain natriuretic peptide, and procalcitonin) in the ED.
Figure 1Levels of circulating nuclear DNA in plasma on different days in severe sepsis patients and control subjects.
#
p< 0.001, severe sepsis patients vs. controls; *p< 0.001, survivors vs. non-survivors.
Figure 2Levels of circulating mitochondrial DNA in plasma on different days in severe sepsis patients and control subjects.
[image:6.595.59.291.532.684.2]As such, the mechanisms necessary for the release of DNA are different from those implicated in the release of these biochemical markers. Several forms of sepsis-induced host cell death have been described during infection. The type of death the cell undergoes depends on the nature of the pathogen, pathogen load, and site of infection. Pyroptotic, apoptotic, autophagic, or oncotic cells display a distinct set of morphologic and biochem-ical characteristics [21]. Consequently, the source of free plasma DNA is complicated by the co-existence of sev-eral potential mechanisms of DNA release. Further pro-spective study is needed to clarify this relationship.
Study limitation
Although the present study demonstrates that higher plasma mitochondrial DNA level on admission is a powerful biomarker for fatality in severe septic patients, this study has several limitations. First, plasma nuclear and mitochondrial DNA levels may be influenced by age and pre-existing diseases. Second, cellular damage indi-cated by plasma DNA may occur in different tissues and by several mechanisms of DNA release due to the het-erogeneity of pathogens and critical illness of patients. Third, mechanisms of plasma DNA degradation and clearance also remain uncertain, particularly the impact of impaired renal and hepatic function on circulating DNA levels, which may be very complicated. Lastly, the choice of therapeutic strategy for sepsis (e.g., use of ster-oids, dosage and duration of steroids) may be different for each patient based on the preference of his/her doc-tor. This may cause potential bias in the statistical anal-ysis. Large-scale prospective studies are warranted to
evaluate the prognostic contribution of plasma DNA on clinical outcomes.
Conclusion
Plasma DNA level has potential use in predicting the outcome of septic patients at the emergency room. Plasma mitochondrial DNA level on admission is a more powerful predictor than lactate concentration or SOFA score on admission, both of which are commonly used for outcome prediction in clinical practice. Cell-free DNA level in blood circulation is a novel biomarker for the prognosis of clinical diseases rather than diagnosis. The method has recently received increasing attention and its clinical application is expected. Based on the results, serial plasma DNA seems to meet the major requirement for outcome prediction in the treatment of severe sepsis. Plasma DNA assay can be considered a biomarker that should be added to the panel of conven-tional inflammatory biomarkers.
Ethics approval
The study was approved by Chang Gung Memorial Hospi-tal’s Institutional Review Committee on Human Research.
Competing interests
The authors declare that they have no competing interests.
Authors’contributions
[image:7.595.56.539.90.300.2]Acknowledgements
This work was supported by grants from Chang Gung Memorial Hospital (Chang Gung Medical Research Project CMRPG891341) and NHRI-EX101-10142EI. The authors thank all of the subjects who participated in this study.
Author details
1Department of Emergency Medicine, Chang Gung University College of
Medicine, Kaohsiung, Taiwan.2Department of Neurology, Chang Gung University College of Medicine, Kaohsiung, Taiwan.3Department of
Neurosurgery, Chang Gung University College of Medicine, Kaohsiung, Taiwan.4Department of Radiology, Chang Gung University College of
Medicine, Kaohsiung, Taiwan.5Medicine, Chang Gung Memorial Hospital-Kaohsiung Medical Center, Chang Gung University College of Medicine, Kaohsiung, Taiwan.6Department of Biological Science, National Sun Yat-Sen University, Kaohsiung, Taiwan.7Department of Neurology, Kaohsiung Chang
Gung Memorial Hospital, Chang Gung University College of Medicine, No. 123, Ta Pei Road, Niao Sung Hsiang, Kaohsiung City 833, Taiwan.
Received: 17 March 2012 Accepted: 7 June 2012 Published: 21 June 2012
References
1. Martin GS, Mannino DM, Eaton S, Moss M:The epidemiology of sepsis in the United States from 1979 through 2000.N Engl J Med2003,
348:1546–1554.
2. Leon SA, Shapiro B, Sklaroff DM, Yaros MJ:Free DNA in the serum of cancer patients and the effect of therapy.Cancer Res1977,37:646–650. 3. Jiang N, Pisetsky DS:The effect of inflammation on the generation of
plasma DNA from dead and dying cell in the peritoneum.J Leukoc Biol
2005,77:1–7.
4. Jahr S, Hentze H, English S, Hardt D, Fackelmayer FO, Hesch RD, Knippers R:
DNA fragments in the blood plasma of cancer patients: quantitations and evidence for their origin from apoptotic and necrotic cells.Cancer Res2001,61:1659–1665.
5. Tsumita T, Iwanagam M:Fate of injected deoxyribonucleic acid in mice.
Nature1963,198:1088–1089.
6. Lo YM, Rainer TH, Chan LY, Hjelm NM, Cocks RA:Plasma DNA as a prognostic marker in trauma patients.Clin Chem2000,46:319–323. 7. Chang CP, Chia RH, Wu TL, Tsao KC, Sun CF, Wu JT:Elevated cell-free
serum DNA detected in patients with myocardial infarction.Clin Chim Acta2003,327:95–101.
8. Rainer TH, Wong LK, Lam W, Yuen E, Lam NY, Metreweli C, Lo YM:
Prognostic use of circulating plasma nucleic acid concentrations in patients with acute stroke.Clin Chem2003,49:562–569.
9. Saukkonen K, Lakkisto P, Pettila V, Varpula M, Karlsson S, Ruokonen E, Pulkki K:Cell-free plasma DNA as a predictor of outcome in severe sepsis and septic shock.Clin Chem2008,54:1000–1007.
10. Huang CH, Tsai MS, Hsu CY, Chen HW, Wang TD, Chang WT, Ma MH, Chien KL, Chen SC, Chen WJ:Circulating cell-free DNA levels correlate with post-resuscitation survival rates in out-of-hospital cardiac arrest patients.Resuscitation2012,83:213–218.
11. Okkonen M, Lakkisto P, Korhonen AM, Parviai-nen I, Reinikainen M, Varpula T, Pettilä V:Plasma cell-free DNA in patients needing mechanical ventilation.Crit Care2011,15:R196.
12. Hotchkiss RS, Nicholson DW:Apoptosis and caspases regulate death and inflammation in the sepsis.Nat Rev Immunol2006,6:813–822.
13. Martins GA, Kawamura MT, Carvalho Mda G:Detection of DNA in the plasma of septic patients.Ann NY Acad Sci2000,906:134–140. 14. Zeerleder S, Zwart B, Wuillemin WA, Aarden LA, Groeneveld AB, Caliezi C,
van Nieuwenhuijze A, van Mierlo GJ, Eerenberg AJ, Lammle B, Hack CE:
Elevated nucleosome levels in systemic inflammation and sepsis.Crit Care Med2003,31:1947–1951.
15. Rhodes A, Wort SJ, Thomas H, Collinson P, Bennett ED:Plasma DNA concentration as predictor of mortality and sepsis in critically ill patients.
Crit Care2006,10:R60.
16. American College of Chest Physicians/ Society of Critical Care Medicine Consensus Committee:Definition for sepsis and organ failures and guidelines for the use of innovative therapies in sepsis.Chest1992,
101:1658–1662.
17. Lo YM, Tein MS, Lau TK, Haines CJ, Leung TN, Poon PM, Wainscoat JS, Johnson PJ, Chang AM, Hjelm NM:Quantitative analysis of fetal DNA in
maternal plasma and serum: implications for non-invasive pre-natal diagnosis.Am J Hum Genet1998,62:768–775.
18. Chiu RW, Chan LY, Lam NY, Tsui NB, Ng EK, Rainer TH, Lo YM:Quantitative analysis of circulating mitochondrial DNA in plasma.Clin Chem2003,
49:719–726.
19. Brunelle JK, Chandel NS:Oxygen deprivation induced cell death: an update.Apoptosis2002,7:475–482.
20. Huttunen R, Kuparinen T, Jylhava J:Fatal outcome in bacteremia is characterized by high plasma cell free DNA concentration and apoptotic DNA fragmentation: A prospective cohort study.PLoS One2011,6:e21700. 21. Labbeand K, Saleh M:Cell death in the host response to infection.Cell
Death Differ2008,15:1339–1349.
doi:10.1186/1479-5876-10-130
Cite this article as:Kunget al.:Plasma nuclear and mitochondrial DNA levels as predictors of outcome in severe sepsis patients in the emergency room.Journal of Translational Medicine201210:130.
Submit your next manuscript to BioMed Central and take full advantage of:
• Convenient online submission
• Thorough peer review
• No space constraints or color figure charges
• Immediate publication on acceptance
• Inclusion in PubMed, CAS, Scopus and Google Scholar
• Research which is freely available for redistribution