JOINT ANNUAL REPORT
2006
CONTENTS
List of Acronyms
I EXECUTIVE SUMMARY ... 3
II. UPDATE ON POLITICAL, ECONOMIC AND SOCIAL SITUATION ... 6
II.1 Update on the Political Situation... 6
II.2 Update on the Economic situation ... 7
II.2.1 Macro-economic changes and structural reforms: ... 7
II.2.2 Quality of management in public finances and budgetary expenditure ... 10
II.2.3 Integration into the world economy and negotiation positions with regard to EPA ... 11
II.3 Update on the Social Situation... 13
II.4 Update on the Environmental Situation ... 23
III. OVERVIEW OF PAST AND ONGOING COOPERATION ... 24
III.1 Focal sectors... 27
III.2 Macro-economic support ... 29
III.3 Projects and Programmes Outside Focal Sectors... 29
III.4 Utilisation of Resources for Non State Actors (NSAs)... 34
III.5 Utilisation of Envelope B... 36
III.6 Other Instruments... 36
IV. ASSESSMENT OF PERFORMANCE INDICATORS ... 38
V. DONOR COORDINATION AND HARMONISATION ... 38
VI. DIALOGUE IN COUNTRY WITH THE NAO AND NSAs ... 39
VII. CONCLUSIONS ... 40
Annexes and tables
Annex I Country at a glance
Annex II Indicative timetables for commitments and disbursements Annex III Financial situation for 9th EDF (grants)
Annex IV Financial situation for 8th EDF (grants) Annex V Financial situation for 7th EDF (grants)
Annex VI Financial situation for 6th EDF (closed for Swaziland) Annex VII Budget lines (Not included)
Annex VIII Sector fiches, including budget support (Not Included) Annex IX counterpart funds (Not applicable)
Annex XII Core economic data
Annex XIII The PFM Performance Report
Annex XIV Summary of the Country Environment Profile (CEP)
Annex XV Intervention Framework for Support to Education and Training (SET) Annex XVI Intervention Framework for Smallholder Irrigation (LUSIP)
Annex XVII Revised Indicator Results and Impact Management System (LUSIP) Annex XVIII LUSIP works progress
Annex XIX Donor Matrix
ANNEX XX National Adaptation Strategy to the EU SUGAR Reforms measures:
List of Acronyms
AIDS - Acquired Immune Deficiency Syndrome. AGOA - African Growth and Opportunity Act.
AMICAALL - Alliance of Mayors and Municipal Leaders on HIV/AIDS in Africa. ANC - Anti Natal Care.
ARV - Anti Retroviral.
ART - Anti Retroviral Therapy.
BNLS - Botswana, Namibia, Lesotho, Swaziland
CANGO - Coordination Assembly of Non Governmental Organizations.
CEDAW - Convention on the Elimination of All Forms of Discrimination Against Women. CSO - Central Statistical Office (Swaziland).
CCA - Common Country Assessment.
CMTC - Multi Sectoral Crisis Management and Technical Committee. CITES - Convention on International Trade in Endangered Species. CMA - Common Monetary Area.
COMESA - Common Market for Eastern and Southern Africa. CSO - Central Statistic Office
EFTA - European Free Trade Association ESRA - Economic and Social Reform Agenda. FDI - Foreign Direct Investment.
FLAS - Family Life Association. GER - Gross Enrolment Rate.
GSP - Generalized System of Preferences. GDP - Gross Domestic Product.
GoS – Government of Swaziland HIV - Human ImmunoVirus.
ICT - Information and Communication Technologies. ILO - International Labour Organisation.
JICA - Japanese International Cooperation Agency. LMIC - Low Middle Income Country.
MAP - Millennium Action Plan.
MDGs - Millennium Development Goals.
MDGR - Millennium Development Goals Country Report. MICS - Multiple Indicator Cluster Survey.
MMR - Maternal Mortality Rate. MOE - Ministry of Education. MOHA - Ministry of Home Affairs.
MOHSW - Ministry of Health and Social Welfare. MTCT - Mother to Child Transmission.
NEPAD - New Partnership for African Development. NER - Net Enrolment Rate.
NERCHA - National Emergency Response Committee on HIV/AIDS. NDS - National Development Strategy.
NHDR - National Human Development Report. NGOs - Non Governmental Organizations. ODA - Overseas Development Assistance. OVCs - Orphans and Vulnerable Children. PLWHA - People Living with HIV/AIDS.
PMTCT - Prevention of Mother to child Transmission. PPCU - Public Policy Coordinating Unit.
PRS - Poverty Reduction Strategy.
PRSAP - Poverty Reduction Strategy and Action Plan. RBM - Roll Back Malaria.
RSA - Republic of South Africa.
SADC - Southern Africa Development Community. SACU - Southern African Custom Union.
SCOGWA - Swaziland Committee of Gender and Women’s Affairs SEA - Swaziland Environmental Authority.
SEAP - Swaziland Environmental Action Plan.
SHIES - Swaziland Household Income and Expenditure Survey. SIPA - Swaziland Investment Promotion Authority.
SNAP - Swaziland National AIDS Programme. SME - Small and Medium Scale Enterprises. SNC - Swazi National Council.
SNL - Swazi Nation Land.
SPS - Sanitary and Phyto-sanitary measures SRH - Sexual and Reproductive Health. TASC - The AIDS Information Support Care. TB - Tuberculosis.
TBT - Technical barriers to trade
TDCA - Trade, Development and Cooperation Agreement (TDCA) TVET - Technical Vocational Education and Training
UN - United Nations.
UNAIDS - Joint United Nations Programme on HIV/AIDS. UNCCD - UN Convention to Combat Desertification. UNCBD - UN Convention on Biodiversity.
U5 - Under five years (children below 5 years).
UNDGO - United Nations Development Group Office. UNDP - United Nations Development Programme.
UNESCO - United Nations Educational Scientific and Cultural Organisation. UNFPA - United Nations Fund for Population Activities.
UNGASS - United Nations General Assembly’s Special Session. UNICEF - United Nations Children Fund.
UNCCC - UN Convention on Climate Change. VCT - Voluntary Counselling and Testing. WB - World Bank.
I
EXECUTIVE SUMMARY
The adoption of the new Constitution marks the preliminary end of a ten year drafting and consultation process and a significant change of Swaziland’s political framework. On 8 February 2006 the Constitution of the Kingdom of Swaziland entered into force and with it a new era has started where effort will be made to reconcile requirements of modern law with traditional Swazi law and customs.
Swaziland’s economic performance remains weak. Poverty has escalated in the face of high and rising unemployment, food shortages, and the world’s highest HIV/AIDS infection rate. In 2006, Growth slowed to around 1.8 %, down from 2.7 % in 2004; inflation is rising; and the current account surplus is narrowing. Growth is hampered by substantial real appreciation of the lilangeni during 2002-04, and recurrent droughts. Over that same period, rising government expenditures, especially on the wage bill, undermined fiscal sustainability and reduced foreign reserves to critically low levels. The forecast decline in SACU tariff revenues as import demand slows in South Africa, and Swaziland’s limited diversification are likely to contribute to slowing growth to about 1 % in the medium term.
Swaziland has one of the highest income inequality rates among low-middle-income countries. Poverty has escalated in the face of high and rising unemployment, food shortages, and the world’s highest HIV/AIDS infection rate. The World Food Program estimates that about 20 % of the population required food aid during 2006. The high prevalence of HIV/AIDS seriously undermines human development prospects. The combined effect of the above developments has led to a deterioration of public service delivery to such an extent that the country might become dysfunctional in the respective areas unless appropriate remedial measures are taken
Government and donors’ action in the fight against HIV/AIDS appears to start curbing the epidemic, the 2006 sero-prevalence surveillance survey results released in December 2006 found a 39.2% HIV/AIDS prevalence level, a decline of 3.4% from the 42.6% reported in 2004. Nevertheless the country still reports the highest HIV/AIDS prevalence in the world and the dramatic effects of the present level of sero-positivity cannot be overestimated. Many traditional social safeguards are being eroded while the demands made on health services are putting additional stress on the government budget and public services.
The low revenue base, weak public expenditure management, and wage pressures inhibit the effective execution of the government’s Poverty Reduction Strategy and Action Plan and the mobilization of much-needed development assistance.
Against this background the Country Strategy Paper and National Indicative Programme for 2001-2007 singled out Human Resource Development as the focal sector which attracts 65% of the resources of Envelope A. The Financing Agreement for the 9th EDF programme for the Support of Education and Training with an allocation of € 20 million was signed in April 2005. Outside the focal sector, the EU action under the 9th EDF is undertaken under four programmes: Capacity Building for Development Planning Project (€ 2.7 million), Micro-projects Programme (€ 4.7 million), Cooperation Facility (€ 2 million) and the second phase of HIV/AIDS Prevention and Care Programme (€ 2 million). A number of projects from the 8th EDF, namely the major multi-donor small-holder irrigation project (LUSIP, € 11.45 million from EDF), the first HIV/AIDS Prevention and Care Programme (€ 1.96 million), the Private Sector Support Programme (€ 5.9 million), the Fiscal Restructuring Programme (€ 5.6 million) are still ongoing. Implementation of Sugar Accompanying Measures to assist the country to better respond to the EU sugar regime reforms has also started, and a National Adaptation Strategy (NAS) adopted in 2006. The NAS focuses on several aspects, mainly: (i) Competitiveness of the Sugar Industry, (ii) Trade Policy, (iii) Promoting Smallholder Cane Growing, (iv) Diversification, (v) Social Services and Welfare, (vi) Enhancing a sustainable socio-economic environment, and (vii) Institutional support (see annex XX for further details on the NAS).
to the design, implementation and/or monitoring of the interventions. The overall indicative allocation for programmable aid under the 10th EDF amounts to € 63 million.
II. UPDATE ON POLITICAL, ECONOMIC AND SOCIAL SITUATION II.1 Update on the Political Situation
The entry into force of the Constitution of the Kingdom of Swaziland, on 8 February 2006, marks undoubtedly the most remarkable political development of the year. Signed by the King on 26th July 2005 the adoption of the new Constitution marks the preliminary end of a ten year drafting and consultation process and a significant change of Swaziland’s political framework. The Constitution tries to reconcile requirements of modern law with traditional Swazi law and customs. It contains a bill of rights with all essential rights and freedom including equal rights for women and men; it further strengthens the role of the Parliament and ends the possibility to rule by decree; it clearly cut sets the Independence of the Judiciary while reserving an important role for Swazi Law and Customs and traditional institutions.
The constitution dispensation has been received with mixed feelings both from the conservative circles and the progressives respectively. The progressives feel that the process was not fully exclusionary and participatory and thus not all views of society informed the document whilst the conservatives view the constitution as bringing new elements which interfere with cultural practices and the role of the Monarchy. The Government is currently implementing its Constitution rollout programme to allow full absorption of the implications by the respective line ministries as well as the necessary alignment of the pieces of legislation and policy reform. Initial Consultations between the Constitution Drafting Committee (CDC) and key government and traditional bodies (such as the Swazi National Council, Cabinet, Principal Secretaries and Heads of Departments, Heads of the security forces, Parliamentarians and Chiefs) were completed in June 2006. A nation-wide civic education on the constitution followed the initial consultation; by April 2007, the CDC had been able to cover a total of 47 Tinkhundla centers.
One key area which is still outstanding is the issue of reviewing the existing laws to be in conformity with the constitution. (Section 268). A number of legalisations are either outdated or no longer relevant to the challenges faced by the country today. Some law reform initiatives have been undertaken in reviewing the marriage act, deeds registry act and the administration on estates act. This, however, has been done with a focus on addressing the gender imbalances in them and there is need to undertake a holistic audit and review of all laws to be compatible with constitution.
The year 2006 saw the establishment of the new Ministry of Regional Development and Youth, which is tasked with implementing the Decentralisation Policy approved in late 2005 in line with the Constitution provisions on the introduction of local government structures (Tinkhundla) 1. The main goal of the policy is to provide an enabling environment for promoting sustainable and participatory local and national development within a decentralised governance framework. It will involve the establishment of distinct local Government levels with clearly defined operating structures, systems and procedures, and financial independence. In line with the Constitution, the Poverty Reduction Strategy and the Action Plan also call for decentralization and strengthening of the Tinkhundla centers in order to allow communities to participate in the identification of their priorities.
Non State Actors (NSAs) participation in the country’s policy making has improved following the adoption, in 2006, of a NGOs policy that aims at creating an environment conductive to NSA’s involvement. Progress in the implementation is still partial and concrete action to reduce bureaucracy, improve service delivery and provide finance training and guidance still very much in the need. NSAs say to be pleased with the NGOs Policy and the government increasing effort to enhance cooperation, but advocate for the adoption for legal instruments that will reinforce the policy provisions and for greater access to funding.
1 Art. 218, Constitution of the kingdom of Swaziland: “Parliament shall within five years of the commencement of
Political parties were banned in Swaziland in accordance with the resolution of the House of Assembly proclamation number 7 of 12 April 1973 issued by King Sobhuza ll .The newly adopted constitution makes no mention of political parties, but does include a clause guaranteeing freedom of association. As result, it is not clear whether or not Swaziland has moved from non party state to multi-party democracy. Presently there is no legislation in Swaziland governing aspects of political party life such as registration, regulation, funding and financial control. Political parties like the Ngwane National Liberation Congress (NNLC) and the African United Democratic Party AUDP) have taken Government to court seeking registration. The case is still being contested in court. . In light of the uncertainty, some political parties with the belief that they are free to operate, have positioned themselves for power while others holding a different view have intensified the pressure for recognition of political party activity in line with modern democracy.
II.2 Update on the Economic situation
(The following analysis is based on core economic data provided in Annex 12)
II.2.1 Macro-economic changes and structural reforms:
Economic performance:
Swaziland continues to experience weakening economic performance, with estimated growth rate of 1.8% for 2006 (down from 2.7 % in 2004 and an average of approximately 9 % in the 1980s) which is far below the SADC average of 5.4%. The main drivers of the weakening growth performance are low investment, deteriorating terms of trade and competitiveness, coupled with poor governance ratings. Growth is hampered also by institutional factors. Poor labour productivity, the high cost of doing business, and low governance and transparency indicators deter new investment. The high prevalence of HIV/AIDS seriously undermines human development prospects. The low revenue base, weak public expenditure management, and wage pressures inhibit the effective execution of the government’s Poverty Reduction Strategy and Action Plan and the mobilization of much-needed development assistance. In addition fiscal imbalance has widened in the last two years. Policy choices and external shocks such as prolonged droughts, high oil prices, the loss of textile quota in 2005 and an appreciating currency explain this poor growth and poverty records.
In the medium term, the country’s economy is susceptible to a range of potentially permanent shocks. According to a 2007 assessment by IMF, trade liberalization, especially, the possible removal in 2007 of the AGOA provision allowing the use of third-country fabrics, the forecast decline in SACU tariff revenues as import demand slows in South Africa, and Swaziland’s limited diversification are likely to contribute to slowing growth to about 1% in the medium term1. Furthermore the HIV/AIDS epidemic is also causing high mortality rates, a loss of productivity and real income, and mounting fiscal pressures.
Public finance
The Government last enjoyed consistent yearly budget surpluses during the 1980’s. However, the situation changed drastically as in the early 1990’s as Government fiscal position came under severe pressure due to a slowdown in revenue growth compared to expenditures. Fiscal policy’s expansionary trend has worsened dramatically since 2000, the fiscal deficit deteriorating from 1.4 % of GDP in the 2000/01 financial year, to 4.6 % in 2004/05, to 5.2 % of GDP in the year 2005/062. Large SACU receipts will lead to a surplus for the 2007/08 budget. SACU receipts are estimated to be about 56% of Government revenue. These revenues are expected to remain high until tariff reductions take effect (not before 2010) or the SACU revenue sharing formula is changed. South Africa currently believes that the SACU members are relying too heavily on South Africa for their revenues and want the formula to be reviewed. However, this has so far been a verbal indication and no formal discussions have taken. However, this change in regime will cause a drop in the SACU receipts enjoyed by Swaziland.
expenditure is in the area of general payments, which include personnel, the purchase of goods and services by the Government and transfer payments. The civil service wage bill of Swaziland is the highest in SACU, both as a percentage of GDP (15% of GDP in 2005/06) and as a share of the (recurrent) budget. Personnel costs which had accounted for over 50% in the past decade of the Government’s recurrent budget, increased to about 61% of the budget in 2005 due to the upward civil service salary adjustments and rescaling granted in 2004. This massive increase of the wage bill was the main driver of the loss of expenditure control. The debt service increased as well and went from 1.2% of GDP in 2003/04 to 1.6% of GDP in 2005/06.
In 2006, additional SACU revenue reduced the 2005/06 fiscal deficit, despite few policy measures. For 2006/07 the slight restraint in consumption expenditures and control in releasing funds for capital projects, applied to improve cash-flow problems, is expected to contribute positively to the improvement in Government budgetary position for the current financial year. But it is affecting heavily the implementation of capital programmes, as cost overruns will be realised. Also it is causing a serious contraction of growth because of the crowding out of the private sector as Government expenditures are concentrated more on consumption than on investment for capital formation.
Public debt
Over the period 2000/01-2006/07, there are signals of significant increases in total public and publicly guaranteed external debt, as challenges continue to intensify. According to current figures, total public and publicly guaranteed debt stock has increased from E1.6 billion in 1999, to E2.42 billion by June 2006. Public debt is still relatively at levels of around 20% of GDP.
Prices
Inflation has been rising throughout 2006 mainly due to substantial raise in the food price indices, with an upward trend increasing from 3.2% in January to 6.3% in December, against a typically moderated inflation maintained below the mid-point of the 3-6 % for the period 2000-2004. The low inflation environment of the past was a result of the sound macroeconomic policies, prudent monetary policy, and disciplined fiscal policy, the significant recovery in the external value of the Rand/Lilangeni and the moderation in food price increases.
Social macro-economic factors: Employment and unemployment and HIV/AIDS
Employment projections in 2006 indicate a contraction in formal employment due to the erosion in AGOA preference, the restructuring in the sugar industry together with shedding of workers by companies (mainly private textile companies). The situation was exacerbated by the strength of the lilangeni/rand exchange rate2, which continued to exert pressure on competitiveness of export commodities. The formal sector absorbs approximately 30 % of the labour force. Currently unemployment in Swaziland is estimated at more than 30 % of the economically active population, but if the definition included discouraged job seekers, the rate would be over 40 %. The situation is likely to get worse with company closures, and it is projected that private sector employment will decline at -0.2 percent per annum over the foreseeable future, and that the overall standard of living will worsen as the subsistence livelihoods are also being affected. It is expected that beginning 2006/07 government will start implementing the recommendations of the Labour market survey undertaken by the African Development Bank in 2005 with the guidance of the Ministry of Enterprise and Employment. This is aimed at addressing issues of unemployment, particularly among the youth, development of SMEs, strengthening and improvement in quality and production of statistics.
In addition to its humanitarian and social consequences, HIV/AIDS costs the country severely in economic terms, as it constrains output growth, eliminates work skills and knowledge, shrinks the tax base, raises health-related costs, reduces disposable incomes, and increases financial imbalance in the public pension funds. Life expectancy declined from 54.4 years in 1990 to 29.6 years in 2005, with the consequence of
15% of households headed by children. HIV/AIDS has impacted negatively on government capacity to deliver services, because of the death rate of its workforce.
Structural reforms
Fiscal performance during 2003/04 and 2005/06 was not good with both the aggregate and primary deficits deteriorating during the period. Personnel costs still continue to crowd out public investment and thus limit Government’s ability to fund pro-growth public investments. Against this background reforms to strengthen fiscal sustainability have been limited since the 2005 Article IV consultation. In 2006/07, progress towards reorienting expenditure and rightsizing the civil service by a partial freeze on filling vacancies has been offset by the creation of an additional ministry and new positions. A public expenditure management reform project became operational in 2006 but has yet to be extended to all line ministries. Parliament has, however, approved an anti-corruption act and a strategy for privatizing public enterprises that are a burden on the budget
.
Public authorities agree that current fiscal policies cannot be sustained and jeopardizes the credibility of the exchange rate peg. Baseline estimates for 2006/07 show too small a surplus to be consistent with the build-up of international reserves targeted by the authorities. Moreover, the authorities’ medium-term budgetary framework allows for a spending increase of 3% of GDP in 2007/08, and is based on overly optimistic domestic revenue forecasts. Staff indicated that this expenditure level was not sustainable in the face of the expected SACU revenue decline. Financing for the implied large fiscal deficits would erode international reserves under the current exchange rate arrangement given Swaziland’s lack of access to concessional external resources and limited scope for domestic financing without incurring arrears.
The Ministry of Finance has stated in 2006 Medium Term Budget Policy Statement that it intends to aim to cut down the fiscal deficit to 2% of GDP in the next two years and achieve a balanced budget in 2008/09. This will require implementation of measures aimed at controlling expenditures and strengthening revenue mobilisation – through tax administration reforms. Moreover, Cabinet has approved the Revenue Authority Bill which seeks to establish the unified Revenue Authority through combining the Departments of Customs and Excise and that of Income Tax. The Bill has been sent to parliament for enactment. In addition, Government is undertaking preparatory work for the introduction of a broad based Value Added Tax (VAT).
Government has had some success in creating an environment that actively supports private sector investment. Efforts are underway to implement the Small and Medium Enterprise Development Policy, approved in 2005. Progress has been achieved in the provision of necessary infrastructure including the building of factory shells and upgrading of major transport routes. However labour costs in Swaziland are higher than in many competing African and Asian countries. Swaziland’s competitiveness has also been weakened by low investor confidence, cumbersome business regulations especially concerning trade licensing and entry permits, unreliable power supply and expensive telecommunications. Efforts therefore will have to be made to boost labour productivity, reduce domestic costs, and improve the investment climate.
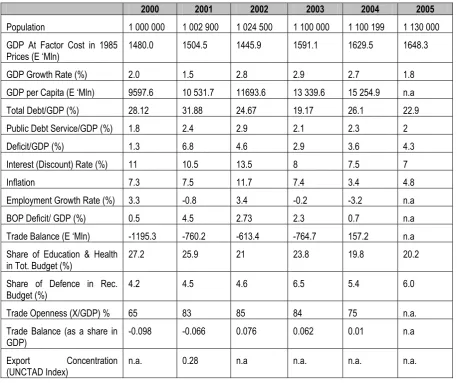
Table 1: Key Economic Indicators
32000 2001 2002 2003 2004 2005 Population 1 000 000 1 002 900 1 024 500 1 100 000 1 100 199 1 130 000 GDP At Factor Cost in 1985
Prices (E ‘Mln) 1480.0 1504.5 1445.9 1591.1 1629.5 1648.3
GDP Growth Rate (%) 2.0 1.5 2.8 2.9 2.7 1.8
GDP per Capita (E ‘Mln) 9597.6 10 531.7 11693.6 13 339.6 15 254.9 n.a
Total Debt/GDP (%) 28.12 31.88 24.67 19.17 26.1 22.9
Public Debt Service/GDP (%) 1.8 2.4 2.9 2.1 2.3 2
Deficit/GDP (%) 1.3 6.8 4.6 2.9 3.6 4.3
Interest (Discount) Rate (%) 11 10.5 13.5 8 7.5 7
Inflation 7.3 7.5 11.7 7.4 3.4 4.8
Employment Growth Rate (%) 3.3 -0.8 3.4 -0.2 -3.2 n.a
BOP Deficit/ GDP (%) 0.5 4.5 2.73 2.3 0.7 n.a
Trade Balance (E ‘Mln) -1195.3 -760.2 -613.4 -764.7 157.2 n.a Share of Education & Health
in Tot. Budget (%)
27.2 25.9 21 23.8 19.8 20.2
Share of Defence in Rec.
Budget (%) 4.2 4.5 4.6 6.5 5.4 6.0
Trade Openness (X/GDP) % 65 83 85 84 75 n.a.
Trade Balance (as a share in
GDP) -0.098 -0.066 0.076 0.062 0.01 n.a
Export Concentration
(UNCTAD Index) n.a. 0.28 n.a n.a. n.a. n.a.
Source: Central Bank of Swaziland and Ministry of Economic Planning and Development, 2006
II.2.2 Quality of management in public finances and budgetary expenditure
In December 2006, an EU funded preliminary evaluation of the Public Finance Management (PFM) in the Kingdom of Swaziland has been carried out by an international consultant in view to assess the eligibility of Swaziland for EC Budgetary support. The report measured the performance of the country public management on the basis of the recently adopted Performance Measurement Framework of the PEFA (Public Expenditure and Financial Accountability) that has been developed by the World Bank, the IMF, the European Commission and other donors4. The key outcomes of the report - which are spelled out in annex 13 - indicate that PFM in Swaziland does not support the achievement and maintenance of aggregate fiscal discipline and the strategic allocations of resources in a satisfactory fashion. In fact the exercise in the Kingdom of Swaziland indicates a limited capacity for budget preparation and forecasting and shows that the budget is only partially credible, not comprehensive and transparent enough and policy-based to some extent only. Moreover internal control, public procurement, internal and external audit systems and data accuracy remain a matter of serious concern5. These systems are found to be far from
3 Date provided in Table 1 is total budget (recurrent and capital)
4 The PEFA method measures progress against 6 key indicators: 1) Credibility of the budget 2) Comprehensiveness and transparency; 3) Policy-based budgeting; 4) Predictability and control in budget execution; 5) Accounting, recording and reporting; 6) External scrutiny and audit.
meeting international standards and are currently under-performing. As a result, serious doubts remain on the ability of these systems to ensure efficiency in service delivery.
Reports by the IMF and the World Bank have also, repeatedly, underlined the need for public finance management reform in order to create the fiscal space to support poverty reduction. The latest assessments reveal that the current fiscal stance will be soon unsustainable as SACU revenues begin to fall. Deficit financing has relied on draw downs of government financial assets closely connected with international reserves, a practice which risks undermining the exchange rate parity in the Common Monetary Area (CMA). Recommended reform measures include among others a more pro poor composition of public expenditure, improve budget management, right sizing of the public service, reduction of unproductive expenditure, introduction of a revenue authority and a broad based VAT as well as improved audits of public entities. Over the medium term, this would permit a build-up of international reserves and create fiscal space to fight poverty.
Government expenditure is heavily skewed towards consumption with 78% allocated for recurrent expenditure, whilst only 22% is allocated towards capital investment. Unless more expenditure is targeted towards public investment, economic growth will continue to decline in the medium term.
Prospects of PFM reform: The most important PFM reforms (past and on-going) were financed externally (mainly through the EC-financed Fiscal Restructuring Project). In this context, the sustainability of the reforms will depend upon the ability of the Government to politically support the needed PFM reforms (and/or to show ownership during the reform process). It is evident that curbing personnel costs through implementation of the civil service reforms and privatisation will be crucial to controlling recurrent expenditure and restoring fiscal sustainability. Weak expenditure controls, especially of expenditure commitments on the level of line ministries, have resulted in budget overruns and accumulation of domestic arrears. An Integrated Financial Information System, expected to become operational by the beginning of 2007, would provide the information base for improving expenditure management. The deepening process of implementing the medium term expenditure framework (MTEF) will result in enhanced fiscal transparency and quality of the budgeting process for ministries and departments would help prioritize expenditure, increase accountability and strengthen fiscal discipline. It is envisaged that by beginning 2007/08 financial year, the process of implementing a computerised commitment system and the review of Government procurement procedures, will be finalised. Moreover, strengthening of the audit system will further enhance transparency and accountability.
Swaziland performs badly and clearly below the Southern African region average, in terms of fight against fraud and corruption. The corruption perception index published by Transparency International for 2006 gives the country a value of 2.5 out of 10 (deteriorating from 2.7 in 2005), which ranks 121 out of 163 countries. The Ministry of Finance, in its most recent budget speech (March 2007) has reported that an estimate of 40 to 60 million Emelangeni (approx. 4,5 – 6,5 million €) is being lost to corruption every month. However important progress has been made in 2006 to curb the negative trends: a first adequate legislative framework was finally put in place with the adoption in June of the Prevention of Corruption Act. Furthermore an anti-corruption summit in August 2006 to mark the high commitment by the Government and give momentum to the fight against corruption in government, the private sector and civil society. There is now a need to ensure that the Anti-Corruption Unit, created in 2003, is allocated adequate resources to enable it to function effectively.
II.2.3 Integration into the world economy and negotiation positions with regard to EPA
An important development in 2006 was the decision, by the SADC Extraordinary Summit of Heads of State and Government, to fully implement a SADC Free Trade Area by 2008 and to establish a SADC Customs Union by 2010. The road map and model of the SADC Customs Union are currently being elaborated by a Ministerial Task Force, expressly created at the Summit. The outcome of the SADC Extraordinary Summit has very important implications for Swaziland and the region. Swaziland needs to have a serious rethink about the future of SACU post 2010 and the role that can be played by SACU to assist the SADC integration process. At the 9th SACU Council of Ministers, SACU reaffirmed its commitment to speed up its internal consolidation process in order to offer SACU as an attractive model for the SADC Customs Union. It was agreed that SACU should have its own strategy to contribute its experience to the SADC debate. A task team of senior government officials has been established to assist SACU in developing its position towards the proposed SADC Customs Union.
With regards to the bilateral trade negotiations agenda, SACU Member States signed, in August 2006, a Free Trade Agreement with the EFTA countries, namely Norway, Switzerland, Liechtenstein and Iceland. The Agreement is currently being ratified.
In line with the provisions of the Cotonou Agreement, Swaziland is negotiating, together with six other SADC members, an Economic Partnership Agreement (EPA) with the European Union to replace the current trade regime of WTO waiver, which is set to end in December 2007. Developments in this area were slow due to the Republic of South Africa-EU TDCA. The TDCA was cited as a central impediment to any trade regime that Swaziland can negotiate with the EU and along with the other SACU members agreed that the SA-EU TDCA be used a baseline/pre-condition for the resumption of region’s negotiations. At the moment, SADC countries have agreed on SPS and TBT issues as first issues for negotiation. Swaziland’s status with regard to COMESA is still under derogation (which is expected not to be renewed in 2007). 6 Alternative markets for the products presently traded with COMESA countries need to be sought.
The 2007 work programme for regional negotiations was finalised during the 5th meeting of the Regional Preparatory Task Force (RPTF) held on the 14th of November 2006 in Gaborone, Botswana. Swaziland decided to negotiate within the SADC framework7. South Africa was eventually roped into these negotiations, using the TDCA as a basis for the SADC position. The GoS is currently discussing the conclusions of the draft final report on “Impact and Sustainability of the EPA with the EU”. The political debate has centred on the need to fast track the creation of the SADC Customs Union for the SADC EPA configuration. This is envisaged to solve the issue of overlapping membership and determine how future resources under the SADC-EU cooperation w i l l be allocated.
Under consideration for 2007, are negotiations with China and India for a preferential trade area. Also, studies commissioned by SACU are undergoing to identify the African country/group of countries that can be strategic for a Free Trade Agreement with SACU. Upon the outcomes of these assessments negotiations might begin in 2007.
On a broader basis, a more active participation in the world economy through closer regional integration and full exploitation of relevant trade agreements, are essential elements in Swaziland’s economic policies. Unfortunately weak trade analysis and negotiating capacities and lack of effective policy coordination, limit the country’s capacity to adopt a coherent trade negotiating agenda, to implement an effective trade policy, and to affirm its rights and obligations in international and regional trade. The country lacks of a clear overall trade and investment strategy, and of the necessary coherence between the trade policy agenda and the overall macroeconomic strategy. Against this background, the development of medium and long-term policy planning and implementation capacity becomes essential.
2006 External trade and the balance of payments
The current account has been in surplus since 2000 mainly thanks to improvements in the income account and net current transfers8. Nevertheless its stability is at stake as both trade in goods and services and
6 Information included in this section date May 2006 and is subject to change due to the ongoing negotiations. 7 The SADC framework comprises of four SACU members (Botswana, Lesotho, Namibia and Swaziland) plus Angola, Mozambique and Tanzania.
transfers may not be sustained into the future. Trade liberalisation is most likely to come with reduced competitiveness of Swaziland’s exports and a reduction in SACU receipts. Sugar exports are the first to be affected by the trade liberalization if additional exports will not compensate for lower prices. Industry restructuring has started, primarily in response to the reforms introduced in July 2006 in the European market (which accounts for over 50% of export revenues in this industry). An industry action plan to respond to the developments in the EU markets was developed in June 2005 and the national adaptation strategy completed in 2006. (For more background info about the strategy and how this will confront the challenges ahead please see annex XX).
II.3 Update on the Social Situation
The achievement of the MDGs is central to Government’s poverty reduction programme. The Ministry of Economic Planning and Development (MEPD) elaborated in October 2004 a Poverty Reduction Strategy and Action Plan, which aims at improving good governance, economic growth social and human development with the overall objective of halving the poverty rate by 50% from its 1995 level by 2015. However, despites the encouraging policy pronouncements, and the fact that a policy framework is indeed in place in all focal sector, the accompanying measures to implement the policies are not evident and the distribution of national resources does not reflect the dramatic social challenges faced by the country. The share of budget allocation to social sectors, even though increasing, remains low, and inadequate, most notably in the health sector. The share of GDP invested in the education and health sectors continue to be lower than the regional average while allocations to public order and safety increased to 4% of the GDP (against an international convention recommending a maximum threshold of 3% and the fact that Swaziland is a peaceful and stable country with relatively low crime rates).
ACTUAL BUDGETARY ALLOCATIONS BY FUNCTIONS & ECONOMIC CATEGORIES (2003/04 - 2005/06)
(% total budget expenditure)
I. MAIN SECTORS (MINISTRIES) 2003-2004 2004-2005 2005-2006
Agriculture, Forestry & Fisheries 4,78% 4,80% 5,82%
Education & Training 23,01% 23,89% 21,06%
General Public Service 28,49% 27,71% 24,14%
Health 5,8% 5,8% 7,8%
Public Order Safety an Defense 17,82% 16,89% 19,26%
Transports & Communication 6,66% 6,99% 10,42%
TOTAL ALL SECTORS 100% 100% 100%
II. MAIN ECONOMIC CATEGORIES 2003-2004 2004-2005 2005-2006
Wages and salaries 38,6% 35,4% 44,45%
Debt service payments 4,13% 2,97% 4,27%
Capital expenditures 19,0% 22,66% 23,25%
TOTAL ALL CATEGORIES 100% 100% 100%
Source: THE PUBLIC FINANCE MANAGEMENT PERFORMANCE REPORT (PEFA), January 2007.
Progress towards the achievement of the MDGs has been only partial and projections are not promising. Based on available statistics and on the latest MDGs progress assessment9, Swaziland will not meet the MDGs. HIV/AIDS, wide-spread poverty, low economic growth; low rates of Government revenue and high unemployment rate are the main causes behind the discouraging assessment of MDGs. At the contrary the current deterioration of Swaziland’s HDI and the increasing number of job losses in the formal sector, will result in an increasing number of households facing conditions of extreme poverty.
2005. Other factors contributing to the decline in the current account surplus was the appreciation of the exchange rate which weakened export trade and rise in imports. However, in the second half of 2006, the exchange fell to R7/US$1
The table below provides key indicators to measure progress towards the MDGs and poverty reduction objectives. The MDG’s Reporting (MDGR) exercise for Swaziland highlighted a number of important achievements in the country, e.g. the implementation of the National Development Strategy (NDS), the completion of the national poverty reduction strategy and the establishment of a poverty-monitoring unit. It is to be noted that the MDGR process in Swaziland also highlights serious data paucity. Data gathering capacities, quality of recent survey information, statistical tracking and analysis capacities, capacity to incorporate statistical analysis into policy, planning and resource allocation mechanism, monitoring and evaluation mechanism are extremely weak. The effective tracking of progress towards the achievement of the MDGs requires the availability of statistics that are reliable, valid and up to date. At the time being, persistent unavailability of data and critical underperformance of monitoring and evaluation mechanisms constitute a major obstacle in the in monitoring the achievement of the MDGs as well of the EU action.
Indicators related to the Millennium Declaration
MDGs INDICATORS 2000 2001 2002 2003 2004 2005 2006 TARGET
1. Proportion of population below $0.8 per day 66 66 65 66 69 69 69 35 2. Prevalence of underweight children (under 5 years of age) 10 10 10 10 20 n.a n.a 5 3. Under-five mortality rate n.a 142 149 153 156 n.a n.a 30 4. Net enrolment ratio in primary education 78 78 75 75 85 85 82 100 6. Ratio of girls to boys in primary education 1:08 1:08 1:09 1:01 1:01 1:01 1:01 1:01 Ratio of girls to boys in secondary education 1:08 1:09 1:09 1:09 1:08 1:01 1:01 1:01 7. Proportion of births attended by skilled health personnel 70 70 72 74 86 n.a n.a
8. Proportion of 1 year old children immunized against measles 72 n.a n.a n.a 70 n.a n.a
9. HIV prevalence among 15-24 year old pregnant women 35,4 n.a 39,4 n.a 39,4 n.a 34,6 < 35.4 HIV prevalence among 25-29 year old pregnant women 40,7 n.a 47,7 n.a 56,3 n.a 48.9 < 40,7 10. Proportion of population with sustainable access to an
improved water source 50 n.a 51 n.a 48 n.a n.a 79
Sources:
1 CSO Household Income and Expenditure Data
2 Southern Africa Regional Poverty Network (SADC) statistics, 3 UNICEF Social Indicators, state of the world’s children 2004 4,5,6 Education Statistics, CSO
7 Ministry of Health and Social Welfare 2002 8 Health Statistics, CSO
9 7th, 8th, 9th and 10th HIV Sentinel Sero Surveillance Survey in women attending antenatal care, STI and TB patients.
10 UNICEF Social Indicators, state of the world’s children 2004
MDG 1 – Eradicate Extreme Poverty
Target: Halve the proportion of people living in extreme poverty by 2015
Indicator: the proportion of the population living below the national poverty line of E 69/month
GoS’s Poverty Reduction Strategy (PRS) aims at reducing the incidence of poverty from the 2000 rate of 66% of the population to 30 % by the year 2015, and to eliminate extreme poverty by 2022. Deteriorating trends indicate that these goals are unlikely to be met. In 2006, 69% of the population of Swaziland was living below the poverty line (which is set at E129 per month or US$ 0.8 per day) and 37% of the Swazi population has income below the extreme poverty line (E 69 per month or US$ 0.44 per day). The problems of hunger and homelessness persist, and the living standards of a number of Swazis, particularly in rural and peri-urban areas, continue to deteriorate.
with per capita GNI at US$ 2.280 in 2005, performing better than most members of SADC. However, as confirmed by the 2007 IMF Country report, Swaziland has one of the highest income inequality among low-middle-income countries and is characterised by significant regional disparities. The Gini coefficient10 which had improved from 0.61 in 1994 to 0.51 in 20045, declined again to 0.61 in 20066. The latest census11 revealed that the richest 10 % of the population control almost 50.2%7 of total earned income, in contrast, with the poorest 40 % of the population benefiting of only 14 % of total earned income. Economic inequality is found to be high in both the rural and urban areas of Swaziland.
With a population of about 1.2 million people growing at a rate of about 2.2%, the country’s per capita GNP has been in growing by only about 0.9% in 2006 - very marginal if contrasted to the social problems facing the country and the targets of the Millennium Development Goals. It is estimated that Swaziland’s economy needs to grow by 9% to reach the 50% poverty reduction target by 20158. Despite the unpromising scenario, Government remains committed to the fight to halve poverty by 2015.
Major Challenges:
Gender Inequality: Gender inequality is at the centre of Swaziland’s poverty problem, as suggested by the fact that the majority of poor households are those headed by women.
Strengthening NGOs: NGOs must be strengthened through government support. The government must also effectively utilize the NGOs close proximity to the poor and their relative efficiency in service delivery. An NGO policy has been developed but enacting legislative framework needed. Agricultural Productivity: Challenges include: lack of credit facilities for rural households in the
communal Swazi Nation Land (SNL); poor infrastructure; limited opportunities for product marketing; out-of-date technology; inadequate extension services, reoccurring drought and the absence of a policy on Agriculture.
Domestic resource mobilization: The success of the PRS depends in large part on its ability to mobilize mass support and participation of the poor, as these people understand the nature, causes and possible solutions to socio-economic challenges that their communities face.
Policy Coordination and Implementation: Limited institutional arrangements, poor capacity building, and weak information dissemination and monitoring inhibit effective policy coordination in Swaziland. There is a need to strengthen the Public Policy Coordinating Unit.
Supportive Environment:
The New Constitution entered into force in February 2006 addresses issues relating to the first MDG, including resource allocation and adoption of pro-poor government expenditure patterns. The National Development Strategy (NDS) places poverty reduction at the centre of the country’s
development effort. The government also acknowledges that meaningful improvement in the lives of rural Swazi people lies in their ability to access and make optimum use of land as their major productive resource. There is a draft land policy that was approved by cabinet and is awaiting approval from other government structures.
Part of government’s broad policy objective has been to increase efforts to attract FDI, which has been declining in the past decade. Tangible efforts in this area were seen in the establishment of Swaziland Investment Promotion Authority.
The government’s efforts at reducing poverty have revolved around the creation of micro-projects in the form of credit schemes, that are geared towards entrepreneurship, and income generation for the poor and the establishment of an SME unit within the Ministry of Enterprise and Employment.
MDG 1 – Eradicate Hunger
Target: Halve the proportion of people who suffer from hunger by 2005
Status and Trends: A survey undertaken by the MOHSW & WHO in 2004, indicates that 20% of children under the age of five are severely stunted and 5.1% severely underweight, indicating a worsening of the
10 The Gini coefficient is a measure of inequality of a distribution. It is often used as an income inequality metric. A Gini index of 0 represents perfect economic equality, and 100 perfect inequality.
situation compared to the respectively 10% and 2% rates reported by the 2000 CSO national survey. The interactions between nutrition and HIV/AIDS are complex, and malnutrition among adults is a growing concern.
Maize is the dominant crop and the staple food grown by the majority of SNL farmers and it accounts for about 86% of the area planted. Although national sources12 report that, during 2006/07 the National Maize Corporation (NMC) has been able to purchase more than 14 thousand metric tonnes of locally grown maize compared to 8,354 metric tonnes bought the previous year, thanks to an improved access to irrigation facilities by the small-scale maize producers, per capita maize consumption is falling without being substituted with other foods. Global crop production is on a downward trend, due to the series of consecutive years of adverse climatic conditions that are hitting the Country. Also the impact of HIV/AIDS on the agricultural workforce is beginning to show its adverse effect on production. As a result access to adequate food supplies remains a serious issue for poor and, particularly, HIV/AIDS affected rural households.
According to World Food Programme figures, about 20% of the population (200.000 direct beneficiaries) required food aid during 2006, and 40% of the population is set to directly benefit from food security and food aid in 200713. FAO and WFP estimated a decline of up to 60% in the agricultural 2006 harvest in the entire country, which negatively affected the maize prices and the income of Communal farmers, who represent 80% of the population. Due to the delayed rainfall, heavy winds and hailstorms suffered by the country during the 2006 rainy season which was followed by severe dry spells with large maize crops failing, the situation is expected to critically worsen in 2007, with a decline in the harvest up to 75-80%. Major Challenges
The main challenge is for government to find innovative ways to change rigid inhibiting attitudes towards alternative drought-resistant food-crops. GoS, FAO and other donors have recently started to encourage farmers in planting crops adapted to the local weather conditions; unfortunately, the surface covered is still minimal. In the present circumstances, the continuation of drought conditions may mean that humanitarian and emergency aid may have a higher priority in development planning for the near future.
Change the land tenure system which currently prevents individuals from using SNL as collateral for securing loans.
Provide access to irrigation water for SNL smallholders.
Disaster preparedness - improve the functioning of the national disaster task force.
Inaffordability of agricultural inputs, lack of savings, unemployment, limited capacity building for SNL farmers leading to a vicious circle of food insecurity.
Supportive Environment
The NDS recognizes the need for making the attainment of food security a central objective of government policy. The government’s policy on food production/agriculture aims to achieve food security in the rural sector through a combination of home grown food, proper food storage and cash generated from other activities.
Government is encouraging improved cropping methods like rotation of crops such as legumes, with cereals and growing high value crops to address food shortages in the country. However, maize remains the staple food for Swaziland, accounting for around 73 % of apparent total cereal consumption and 63 % per capita calorie intake. Until recent years, the Government’s policy objective was to improve self-sufficiency in the production of maize. The policy involved intervention to control the marketing, milling and importation of maize, and a guaranteed minimum territorial, seasonal price for producers designed to maintain the producer price around the import parity level.
In 2006 government has taken a major stride by completing a National Programme for Food Security, which is an integral part of the Comprehensive Agriculture Sector Policy and the National Food Security Policy. The policy has introduced the status and framework of food security that is in line with the internationally accepted definition and components of food security. The
12 Ministry of Finance, budget speech 2007/2008, March 2007.
programme is aimed at supporting related initiatives on poverty reduction, improving agricultural production and marketing, enhancing environmental management, strengthening disaster preparedness and broadening access to water and sanitation. Implementation of the programme will ensure that development is guided and facilitated within a structured and balanced framework that respects physical limits, equity concerns, and institutional capacities. This national programme for food security is planned to be implemented through a consultative and participatory process with all stakeholders, maximizing the linkages between food security and other relevant policies, strategies and action plans. The programme’s specific purpose is to provide clear guidance regarding the strategies and measures that must be adopted in order to improve the country’s food security status. A Disaster Management Bill will establish a permanent inter-governmental structure at national
and regional levels, linking government ministries with the administrations of the four regions. It will ensure an integrated, coordinated and common approach to disaster management, and it will also streamline the process for declaring a national disaster. This in turn will make it easier for international donors to provide needed aid in a timely manner. There is a need for Government to further strengthen the capacity of the National Disaster Management Task Force Secretariat particularly in relation to human resources.
Priorities for Development Assistance
Food Aid agencies are encouraged to source their maize supplies through the local structures (such as the National Maize Corporation in charge of import and marketing of maize) in order to avoid destabilising the Swazi maize industry. It is encouraging to note that the National Disaster Task Force, responsible for food aid distribution in the drought affected area sources virtually all its maize supplies from NMC. Accurate targeting of food aid beneficiaries is also crucial so as to avoid the food aid dependency syndrome. Food aid maize should only be accessible to people who are destitute and surplus producing areas within the Kingdom should be given the opportunity to trade with the deficit producing areas. Locally produced maize should not be displaced by imports. More financial assistance is required to address the multi-faceted nature of the problem of poverty
and food security.
In view of the drought–prone situation, the government needs up-scaled financial and technical support towards intensifying the campaign for diversification to drought–resistant food crops and seed multiplication.
Research and training institutions must be strengthened and deepened.
Promotion of high value crops for exports like organic cotton, vegetables, Soya beans, beans, alfalfa, etc. It must be noted anyway that many of these crops present some drawbacks, mainly linked to global market prices (cotton), considerable production in nearby South Africa (vegetable), non habit to grow them (soya), and they will be considered also as one of the measures for diversification foreseen in the NAS
Support for diversification into animal farming for small-scale farmers, such as rearing fish, chickens, pigs, goats, etc, for income generation. Investigate and implement other innovative approaches to agriculture.
MDG 2 - Achieve Universal Primary Education Target: Achieve universal access to primary by 2015
Indicator: net primary enrolment rate; proportion of children starting grade 1 who reach grade 5; literacy rate of 15-24
Trends:
PRIMARY ENROLMENT INDICATORS
Primary 1990/91 1998/99 2000/01 2002/03 2004/05 2005/06* Regional 2002/03 average
MF 98 104 102 98 98 110 91
M 99 107 106 102 102 114 98
GER (%)
F 97 101 99 94 94 106 84
MF 77 77 78 75 85 82 63
M 76 76 77 75 85 82 67
NER (%)
F 79 78 78 75 85 82 60
Source: UNESCO Institute of Statistics 2005 * Source: Ministry of Education
Enrolment rates in Swaziland are clearly above the Sub-Saharan average (which is of 58.2% for net enrolment and 81.5% for gross enrolment). The country net enrolment rates has increased from 75% in 2002/03 to 85% in 2004/05, although information received from the MOE suggests that the net enrolment rate (NER) for 2005/06 stands at 82% which might indicate a slight drop from the previous year. Gross enrolment rate stabilised at 98% between 2002/03 and 2004/05. Nevertheless primary completion rates are very low and declining: from 25.8 % in 1997 to 21.6 % in 2001 and repetition rates are also very high, around 15 % for the past 7 years, with no signs of improvement. Although this ranks far behind international standards (the FTI benchmark is 10 % or less), it is better than the Sub-Saharan average of 18% for the year 2000. Drop-out rates at primary level have stagnated around an average of 7-9 %, while increased into double digits as pupils enter their teens, i.e. 10.8 % in grade 6, increasing to 15.2 % in grade 7. The average student takes 13 years to complete the 7-year primary education cycle. The exam-driven focus of teaching and the fact that pupils are tested every year contributes to an increase in repetition and/or drop-out. These figures reflect both the lack of quality and relevance of primary education and the inefficiency of the system.
The pupil teacher ratio in primary school stayed at around 33:1 throughout the 1990s and on to 2001. This is well within the international standards (FTI benchmark is 40:1). However, the ratio varies considerably (high ratios of 1:45/70) depending on the school’s location. However, as HIV/AIDS incidence is critically high within the teachers’ age profile (40.3 for age group 20-24; 48.9 % for age group 25-29; and 45.6 % for age group 30-34)14 Swaziland is likely to face acute shortages in meeting the future demand for teachers. As for gender parity, Swaziland stands out as the only country in SADC to have achieved gender parity in both primary and secondary education when reviewed in 2005.
Over the past decade, government spending on education has increased substantially suggesting a firm national commitment to education. Education receives the largest sectoral share of the budget after General Public Service. In 2005/6 budget allocation for the MOE accounted for 21% of the total budget expenditure and for 7.3% of GDP. However, the Ministry of Education claims that in real terms, the recurrent budget is declining over time given increases in the cost of supplies, utilities and salaries. The Education budget is unevenly distributed across sub-sectors with financing clearly more in favour of tertiary education needs. System equity in the education sector needs to be strengthened and more financial resources should be channelled into primary education. Despite the consistent budgetary allocations there are in fact great disparities in terms of quality and access, between rural and urban areas, and between the rich and poor.
A major policy measure to be taken by Government to ensure a successful implementation of the response strategy in the education sector is to increase the share of education budget resources going to non-salary related expenditure. The following table is based on budget information available from the MOE.
Although the Constitution has set the objective of “free primary” education from grade 1 to grade 7 by 2009, the Ministry of Education has selected to promote the concept of affordable education instead and
avoids any reference to ‘free.’ Primary education fees do still apply and constitute a serious obstacle to equal access. The government of Swaziland has acknowledged the above challenges and is addressing them now in its policies. As a start, textbooks and workbooks for primary schools are supplied by the Government while orphans and vulnerable children are exempt from paying fees and a feeding scheme is presently operational in all primary schools.
Primary Education (E millions)15
2005/6 Actual 2006/7 Actual 2007/8 Estimate 2008/9 Estimate Salaries & emoluments (personnel costs) 370.7 353.7 455.3 491.8 Non-salary costs (eg. .travel, professional
services, consumable materials & supplies), 24.3 33.7 43.4 41.3
Total 395.0 387.4 498.7 533.1
Non-salary as % of total 6.2 8.7 8.7 7.7
Source: Table excludes elements of Ministry Administration, Curriculum Development and Career Guidance & Psychological Services which benefit the primary sub-sector as these may not be clearly disaggregated from the published Ministry estimates.
To improve the standards and reverse the negative trends of declining enrolments, high repetition and dropout rates, the GoS is in the process of developing strategies to reverse the trend. , since 2006, a EU funded capitation grant scheme which allows all schools to receive a fixed grant for the education of children in exchange for improved quality and equity indicators such as increases in enrolment of orphans and vulnerable children (OVCs), retention of girls and children with special needs while simultaneously cutting down on repetition and drop out rates.
The government needs to accelerate the pace of implementation of the reforms and identify plans for the introduction of informal education at primary level.
The HIV/AIDS pandemic poses serious concerns for the education sector: (1) the growing number of orphans and vulnerable children (OVCs) (presently estimated at 90,000, i.e. 30 % of children, and forecasted to grow up to 120.000/140.000 in 2010) 9, who need to be provided with full primary education; (2) the very high HIV/AIDS prevalence rate in the adult population will further reduce the number of qualified teachers and education personnel; (3) growing poverty rate will result in an increasing number of household unable to pay fees.
Supportive Environment
The country subscribes to the Universal Declaration on Human Rights, which stipulates that everyone has a right to education;
Swaziland is a signatory to the Dakar 2000 Declaration on Education for All;
The Constitution sets the objective of “free primary” education from grade 1 to grade 7 by 2009; Since 1999 National Education Policy formalizes the government’s position as firmly supporting
the importance of consolidating past achievements as well as addressing crucial issues of quality, relevance and affordability of education. It also underlines the importance of vocational education and special education;
Swaziland signed the convention on the rights of the child in 1990 (ratified in 1995) and in 1992 produced the National Programme of Action for the Children of Swaziland (1993-2000). In doing so, the country renewed its commitment to ensuring the improved standards for the education and welfare of children;
The PRS aims to provide free primary education and reduce subsidies on post secondary expenditure.
MDG 3 – Promote gender equality and empower woman
Target: Eliminate gender inequality in primary and secondary education by 2005 and in all level of education by 2015
Indicator: Ratio of girls to boys’ primary education.
Status: Mid-term goal met. In 2005 gender parity was achieved in both primary and secondary education. The adoption Constitution of the Kingdom of Swaziland marks a great achievement on gender issues. The new provisions abolish the traditional legal system which saw women as legal minors, and their rights (e.g. the right to inherit, to have the right to own property) severely undermined. The new legal status is a considerable achievement which comes after the country ratified, in March 2004, the UN Convention on the Elimination of all forms of Discrimination against Women (CEDAW). The Government has ratified the CEDAW and established a Law Reform Commission to examine discriminatory legislation but steps have to be taken to revise and adapt the legislation in order to fully endorse the new regime of equal rights. Many Swazi women participate in business life or are working in the public sector. Ironically, despite the adverse implication of customary practices and tradition on women productive capacities, women in Swaziland are the major income providers for their family accounting for the bulk of agricultural product. Swaziland stands out as the only country in SADC to have achieved gender parity in both primary and secondary education when reviewed in 2005. The Ministry of Education provides support to the Forum for African Women Educationalist (FAWE) which ensures that school books developed and produced locally are gender sensitive and promote gender equality while eliminating all known gender stereo types. The Guidance and Counselling Unit of the Ministry produced Life Skills training manuals in 2005 to empower girls in choosing subjects and making occupational, health and lifestyle choices. FAWE saw the placement of numerous girls in professions that ‘traditionally’ are viewed as for men both in manufacturing, industry and business.
Certain customary practices which pose serious threats to women capacity to assert their sexual rights have a dramatic impact on women safety and health, particularly in the light of AIDS/HIV pandemic. Feminisation of HIV/AIDS is an emerging issue of deep concern; gender inequality has been identified as one of the drivers of the epidemic in the country and measures are being taken to mainstream gender issues in all EU action in the field of health to counter the escalating culture of violence against women and the stigmatisation of women living with AIDS. For this purpose the HAPAC programme has a gender component and AIDS is a cross-cutting theme in all facets of the EU-UN Gender Programme that was launched in March 2007. The Gender Programme in Swaziland will also aim to 1) develop and implement a Plan of Action based on shared international, regional and national commitments aimed at providing a framework for common action to fight discrimination against women and strengthen their full and equal participation in political, social, economical, educational and cultural spheres; 2) enable key State and Non State actors to implement and monitor the implementation of the UN Convention for the Elimination of All forms of Discrimination against Women (CEDAW) through a multi-sectoral and integrated approach (see infra section III.3).
MDG 4 – Reduce child mortality
Target: Reduce under-five mortality ration by 75% by 2015
LIFE EXPECTANCY AT BIRTH AND INFANT MORTALITY RATES (1990-2010)
INDICATORS 1990 1995 2000 2005
Life expectancy at birth 54.4 49.6 35.5 29.6 Infant mortality rate (per 1000 live births) 94.4 95.3 97.3 108 Child mortality (under five) (per 1000 live births) 110 n.a 124 156 Crude death rate (per 1000 live births) 13 n.a n.a 26.2
Source: Vulnerability Assessment Committee, in World Bank, 2006
and the continued prevalence of childhood and waterborne diseases and other infections. Increasing trends have also been observed in the country’s Infant Mortality (IMR) per 1.000 live births, which raised from 94.4 per 1,000 in 1990 to 108 in 2005 and in the Crude death rate per 1,000 population, which increased from 13 in 1990 to 26.2 in 200511.
MDG 5 – Improve maternal health
Target: Reduce maternal mortality ratio by 75% by 2015
Deteriorating trends indicate that the goal is unlikely to be met. Maternal mortality has increased from 110 per 100,000 live births in 1990 to 218 in 2000 to 370 in 200312. The high maternal death rate is attributable mainly to diseases such as hemorrhage, hypertensive diseases, unsafe abortion and lack of clinical skills in handling obstetric and HIV/AIDS13.
MDG 6 – Combat HIV/AIDS, malaria and other diseases Target: Halt and reverse the spread of HIV/AIDS by 2015
Swaziland is among the countries most severely hit by the HIV epidemic. The HIV/AIDS prevalence has dramatically and steadily escalated in intensity over the past 20 years, with HIV prevalence rates raising from 3.9% in 1992 to 16.1% in 1994, 26% in 1996, 31,6 in 1998 to 42.8%, the highest in the world, in 2004. Fortunately the last HIV Serial Sentinel Surveillance carried in the period August to October 2006 among pregnant women, STI and TB patients, aged 15-49, indicated for the first time a positive trend. HIV prevalence rate has decreased from a rate of 42.8% in 2004 to 39.2%14.The spread of HIV/AIDS appears to have halted and reversed in all four regions, among urban and rural areas, and across all age groups.
Analysis per age group shows signs of hope among young women aged 20-24 and teenagers, where a significant decline of the infection rate is recorded. Women aged 25 to 29 are still the most affected by the infection (48.9% compared to 56.3 in 2004) followed by those aged 30 to 34 (40.3% compared to 46.3% in 2004) 15. The indicated shift may be attributable to old infections and/or a cohort effect, as well, as reduction in new infections, especially among the youth.
According to the 2006-2008 National HIV/AIDS Strategic Plan, the main drive of the e epidemic are: a) inadequate public awareness; b) denial of existence of the epidemic by many infected people who hide their status; c) the acceptance of multiple concurrent partners; d) low condom usage, especially among teenagers d) a continued high incidence of sexually transmitted infections (STI) across the country; e) cultural beliefs and practices with negative implications; f) high mobility of the population; g) abuse of gender power relationships by men. Unfortunately the existing system of governance and weak Public Finance Management performance with limited accountability andtransparency has hampered effective response to HIV/AIDS, economic decline slow implementation of policies, including PFM policies. Most of the initiatives launched have not been brought to an end due to corruption and lack of accountability.
Socio-economic impact of the epidemic
Several studies have shown the impact of the epidemic to be dramatic. Previous gains on the health status are being eroded by the advent of HIV/AIDS. Life at birth increased from 44 years in 1966 to 54.4 in 1990 but as result of the HIV/AIDS epidemic fell to 29.6 years in 2005. Worsening trends have been observed in Crude Death Rate (CDR), Infant Mortality Rate (IMR), Under Five Mortality rate (U5MR) and Maternal Mortality Rate (MMR). The total population of Swaziland is projected to increase to 1.58 million by 2015, 41% below the expected number in the absence of AIDS.
The health sector which was already facing a certain number of challenges before the hit of HIV/AIDS, has been further weakened. The burden affects all services in hospital including laboratories, allied medical staff and catering. The demand for hospital beds has increased dramatically with patients suffering from HIV/AIDS related syndromes taking up more than 50% of the total beds in 2005.