FORM.
PHARMACEUTICAL ANALYSIS
26116628
INTRODUCTION
Analytical chemistry has played a major role in the changes facing the
pharmaceutical Industry today. Traditionally viewed as a service organization, the
analytical department has become a significant parameter in the drug development
process. Indeed, the demand for analytical data has become a critical path activity
for selection of molecule for full development. The pharmaceutical analysis plays a
major role in assuring, identity, safety, efficacy, purity and quality of drug product
the need for pharmaceutical analysis is driven largely by regulatory requirements.
(Satinder Ahuja, 2005; Takeru Higuchi, 2002)
The discipline of analytical chemistry consists of,
Qualitatitive analysis: - Which reveals the identity of element and compound in a sample. (Alexeyev, 1994)
Quantitative analysis: - Indicate the amount of individual element or compound present in sample.
Method of Quantitative Analysis (Devaraj Rao, 2004)
Under the Quantitative Analysis, the Procedures of quantitative analytical chemistry
are applied to the analysis of material used in pharmaceuticals.
There are various methods for quantitative analysis of pharmaceuticals. In
general the components are related characteristically to some physical property and
on the basis of that, the quantity is estimated. They are classified into the following
types:
Chemical Methods
Volumetric or Titrimetric
∗
Precipitation Titration∗
Complex metric Titrations∗
Non-aqueous Titrations∗
Gravimetric∗
GeometricInstrumental or Physio-chemical methods
Instrumental methods are based on the relation between the content and
corresponding physical or physio-chemical Properties of the system being analyzed.
Chromatographic Methods
∗
Thin Layer Chromatography (TLC)∗
Paper Chromatography∗
Column Chromatography∗
Gas Chromatography∗
High Performance Liquid Chromatography (HPLC) Hyphenated TechniquesGC-MS (Gas Chromatography – Mass Spectrometry) LC-MS (Liquid Chromatography – Infrared Spectroscopy) ICP-MS (Inductive Coupled Plasma – Mass Spectrometry)
Microbiological Methods Biological MethodsFactors effecting the choice of analytical methods (Mendham, 2002) The type of analysis required.
Problem arising from the nature of the material
Possible interference from components of the material other than those of Interest.
The Concentration range which needs to be investigated. The accuracy required
The facilities available
The time required for complete analysis Similar type of analysis performed
Chromatography is family of Analytical chemistry techniques for the
separation of mixtures. It involves passing the sample, mixture which contains the
analyte, in the “mobile phase” often in a steam of solvent, through “stationary
phase”. The stationary phase retards the passage of the components of the sample.
When components pass through the system at different rates they become separated
in time, like runners in a marathon. Ideally, each component has characteristic time
of passage through the system. This is called its “retention time”. (Clark’s 2004).
Physical separation method in which the components of a mixture are
separated by differences in their distribution between two phases, one of which is
stationary (stationary phase) while the other (mobile phase) moves through it in a
definite direction. The substances must interact with the stationary phase to be
retained and separated by it.
A chromatograph takes a chemical mixture carried by liquid gas and
separates it into its component parts as a result of differential distributions of the
solute as they flow around or over a stationary liquid or solid phase. Various
techniques for separation of complex mixtures relay on the differential affinities of
substances for a gas or liquid mobile medium and for a stationary absorbing medium
through which they pass; such as paper, gelatin, or magnesium silicate gel.
Analytical chromatography is used to determine the identity and
concentration of the molecules in mixture. Preparative chromatography is used to
purify large quantities of a molecular species.
Chromatography is a physical method of separation in which the compound to
be separated or distributed between two phase. One of which is stationary
(stationary phase) while the other mobile (Mobile phase) moves in definite direction
(IUPAC, 1993).
THE DIFFERENT TYPES OF CHROMATOGRAHY
Adsorption chromatography
Adsorption chromatography probably one of the oldest types of the
chromatography around. It utilizes a mobile liquid or a gaseous phase that is
adsorbed on to the surface of a stationary solid phase. The equilibration between
mobile and stationary phase accounts for the separation of different solutes.
Partition chromatography
This form of chromatography is based on a thin film formed on the surface
of the solid support by a liquid stationary phase. Solute equilibrates between the
mobile phase and the stationary liquid.
Ion Exchange chromatography
In this type of chromatography the use of resin ( the stationary solid phase) is
used to a covalently attach anions or a cations on to it. Solute ions of the opposite
charge in the mobile liquid phase are attracted to the resin by electro static forces.
Molecular Exclusion Chromatography
Also known as Gel Permeation or Gel Filtration, this type of chromatography
lacks an attractive interaction between the stationary phase and solute. The liquid or
to its size. The pores or normally small and exclude the larger solute molecules, but
allows smaller molecules to enter the gel, causing them to flow through a larger
volume. This causes the larger molecules to pass through the column at faster than
the smaller once.
Affinity Chromatography
This is the most selective type of chromatography employed. It utilizes the
specific interaction between one kind of solute molecule and a second molecule.
That is immobilized on a stationary phase. For example, the immobilized molecule
may be an antibody to some specific protein. When solute containing a mixture of
proteins is passed by this molecule, only the specific protein is reacted to this
antibody, binding it to the stationary phase.
This protein is later extracted by changing the ionic strength or PH.
Working principle
In all chromatography there is an mobile phase and stationary phase. The
stationary phase is a phase that doesn’t move and the mobile phase is the phase does
moves. The mobile phase moves through the stationary phase picking up the
compounds to tested. As the mobile phase continuous to travel through the
stationary phase it takes the compounds with it. At different points in the stationary
phase the different components of the compound are going to be absorbed and are
going to stop moving within the mobile phase. This is how the results the
chromatography are gotten, from the point at which the different components of the
In paper and thin-layer chromatography the mobile phase is the solvent. The
stationary phase in paper chromatography is strip or piece of the paper that is placed
in the solvent. In thin-layer chromatography the stationary phase is the thin-layer
cell. Both these kinds of chromatography use capillary action to move the solvent
through the stationary phase.
Retention Factor (Rf)
The retention factor, Rf , is the quantitative indication of how far a particular compound travels in a particular solvent. The Rf value is a good indicator of whether and unknown compound and a known compound are similar, if not
identical. If the Rf Value for the unknown compound is close or the same as the Rf Value for the known compound then the two compounds are most likely similar or
identical. The retention factor, Rf, is defined as Rf = Distance the solute (D1) moves divided by the distance traveled by the solvent front (D2).
RF = D1/D2
Where,
D1 = distance that spot travelled, measured from centre of the band of spot to the point where Food color was applied.
HIGH PERFORMANCE LIQUID CHROMATOGRAHY
HPLC is able to separate macro molecules and ionic species. Labile, natural
products polymeric materials and a wide variety of other high-molecular weight
polyfunctional groups.
High performance liquid chromatography is a separation technique utilizing
differences in distribution of compounds to two phases; called stationary phase and
mobile phase.
Basic Principle of HPLC
High performance liquid chromatography is separation technique utilizing
differences in distribution of compounds to two phase; called stationary phase and
mobile phase. The stationary phase designates a thin layer created on the surface of
fine particles and the mobile phase designates the liquid flowing over the particles.
Under a certain dynamic condition each component in a sample has different
distribution equilibrium depending on the solubility in the phases and or molecular
and are there by separated from each other the column is stainless steel (or resin)
tube which is packed with spherical solid particles. Mobiles phase is constantly fed
in to the column inlet at a constant rate by a liquid pump. A sample is injected from
sample injector located near the column inlet. The injected sample enters the
columns with the mobile phase and the components in the sample migrate through it
passing between stationary and mobile phases. Compound move in the column only
when it is in the mobile phase. Compounds that tend to be distributed in the mobile
phase therefore migrate faster through the column while the compounds that tend to
distributed in the stationary phase migrates slower. In this way each component is
separated on the column and sequentially elutes from the outlets. Each compound
eluting from the column is detected by a detector connected to the outlet of the
column.
TYPES OF HIGH PERFORMANCE LIQUID CHROMATOGRAHY
Based on modes of chromatography Normal phase chromatography Reverse phase chromatography Based on Principles of separation
Adsorption chromatography Ion exchange chromatography Ion pair chromatography Size exclusion chromatography Affinity chromatography Chiral phase chromatography Based on elusion technique
Isocratic separation Gradient separation Based on the scale of operation
Analytical HPLC Preparative HPLC
In Isocratic elution a sample is injected onto a given column and the mobile
phase is unchanged through the time required for the sample components to elute
from the column. The isocratic separation of samples widely varying with k’
(partition ratio) values long elution times. To adequately handle samples that have
both weakly retained and strongly retained and strongly retained substances, the
rates of individual band migrations must be changed.
Gradient Elution
Steady changes of the mobile phase composition during the chromatographic
run are called gradient elution. The main purpose of gradient elution is to move
strongly retained components of the mixture faster, but having the least retained
component well resolved.
Starting with the low content of the organic component in the eluent we
allow the least retained components to be separated. Strongly retained components
will sit on the adsorbent surface on the top of the column, or will move very slowly.
When we start to increase an amount of organic component in the eluent
(Acetonitrile) then strongly retained components will move faster and faster,
because of the steady increase of the competition for the adsorption sites.
Gradient elution also increases quasi-efficiency of the column. In the
isocratic elution, the longer a component is retained the wider its peak. In gradient
elution especially with the smooth gradient shape without flat regions the tail of the
peak is always under the influence of the stronger mobile phase when compared to
the peak front. Thus molecules on the tail of the chromatographic zone (peak) will
The optimum gradient for a particular separation is selected by trial and
error.
Normal Phase High Performance Liquid Chromatography (NP-HPLC)
Normal – phase Liquid – liquid chromatography uses a polar stationary
phase and less polar mobile phase. To select an optimum mobile phase, it is best to
start with a pure hydrocarbon mobile phase such as heptane. If the sample is
strongly retained the polarity of the mobile phase should be increased, perhaps by
adding small amounts of methanol or dioxane.
Reverse Phase High Performance Liquid Chromatography (RP-HPLC)
In the normal phase mode, separations of oil-soluble vitamins, essential oils,
nitro phenols, or more polar homologous series has been performed using
alcohol/heptane as the mobile phase. Column used in the normal phase
chromatography for chiral separation
Reverse phase chromatography uses hydrophobic bonded packing, usually
with an octadecyl or octyl functional group and a polar mobile phase, often a
partially or fully aqueous mobile phase. Polar substances prefer the mobile phase
and elute first. As the hydrophobic character of the solutes increases, retention
increases. Generally, the lower the polarity of the mobile phase, the higher is its
eluting strength. The elution order of the classes of the compounds in table is
reversed (Thus, the name reverse-phase chromatography). Hydrocarbons are
retained more strongly than alcohols. Also, the elute strength of the various solvents
table. Thus water is weakest elute. Methanol and Acetonitrile are popular solvents
Table-1
COMPARISION OF NP-HPLC AND RP-HPLC
Proprietors Normal Phase Reverse Phase
Polarity of Stationary
Phase
High Low
Polarity of Mobile Phase Low to Medium Low to High
Sample elution order Leader polar first Most polar first
Retention will be
increased by
Increasing surface of
stationary phase
Increasing of n-alkyl
chain length of stationary
phase
Decreasing polarity of
mobile phase
Increasing polarity of
sample
Increasing surface of
Stationary phase
Increasing polarity of
mobile phase
Decreasing polarity of
sample molecules
Ion exchange chromatography
Ion exchange chromatography uses a stationary phase support which has
been derivatized to as to permanently bind charged groups to the surface the mobile
phase is typically as aqueous buffer. This technique is used primarily for the
analysis of ions such as strong acids or basis or for separation of large molecules
Ion-pair chromatography
Ion-pair chromatography is a “hybrid” technique in which charges groups are
temporarily bound to the surface of a (Reverse-phase) type of column packing. This
technique is often used for the analysis of small, weak-acid or weak-base
compounds.
Size-exclusion chromatography
This separates molecules according to their molecular mass. Larger
molecules are eluted first and the smallest molecules elute last. This method is
generally used when a mixture contains compounds with a molecular mass
difference of at least 10%. This mode can be further subdivided into gel permeation
chromatography (with organic solvents) and gel filtration chromatography (with
aqueous solvents).
Affinity Chromatography
Affinity chromatography operates using immobilized biochemical’s that have
a specific affinity to the compound of interest. Separation occurs as the mobile
phase and sample pass over the stationary phase. The sample compound or
compounds of interest are retained as the rest of the impurities and mobile phase
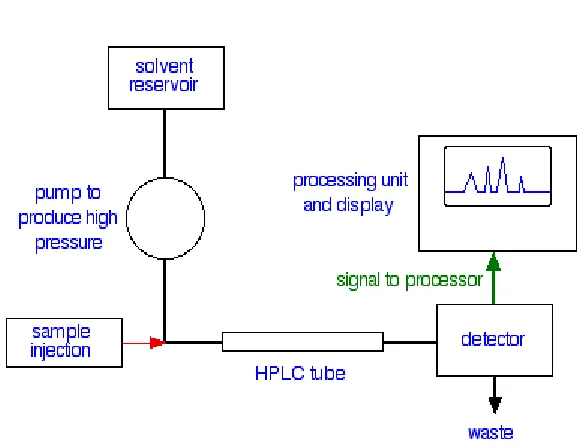
HPLC INSTURMENTATION
The general instrumentation for HPLC incorporates the following components:
There is a solvent reservoir for the mobile phase.
Sampling valves or loops are used to inject the sample in the flowing mobile phase just at the head of the separation column. Samples should be dissolved
in a portion of the mobile phase to eliminate unnecessary peak.
Ahead of the separation column there may be a guard column or an in-line filter to prevent contamination of the main column by small particulate. To measure column inlet pressure a pressure gauge is inserted in front of the
separation column.
The separation column contains the packing needed to accomplish the desired HPLC Separation. These may be silica’s for adsorption
chromatography, bonded phases for liquid-liquid chromatography, exchange
functional groups bonded to stationary support for exchange
chromatography, gels of specific porosity for exclusion chromatography, or
Figure 1: A flow Scheme for HPLC
Mobile-phase delivery system
The mobile phase must be delivered to the column over a wide range of flow
rates and pressure. A de-gasser is needed to remove dissolved air and other gases
from the solvent. Another desirable feature in the solvent-delivery system is the
capability for generating a solvent gradient.
Pump
A pump should able to be operate to at least 1500 psi, a pressure suited to
less expensive chromatographs. However, 6000 psi is a more desirable pressure
limit. For many analytical columns only moderate flow rates of 0.5 – 2.0 ml / min
need to be generated.
Separation Columns
Column is the important part of a HPLC instrument columns are constructed
of heavy-wall, glass-lined metal tubing or stainless steel tubing to with stand high
lengths range from 10 – 30 cms; short, fast columns are 3 to 8 cms long. For
exclusion chromatography, columns are 50 to 100 cms long.
Standard Columns
Many HPLC separations are done on columns with an internal diameter of 4
to 5 mm. Such columns provide a good compromise between efficiency sample
capacity, and the amount of packing and solvent required. Column packing feature
particles that is uniformly sized and mechanically stable. Particle diameters lie in
the range 3 – 5 ml, occasionally up to 10 ml or higher for preparative
chromatography. The columns are classified into various categories depending on
their carbon loading.
Detectors
The sensitivity of universal detector for HPLC as not been devised yet. Thus
it is necessary to select a detector on the basis of the problem.
UV Visible Photometers and Spectrometers
Optical detectors based on UV-Visible absorption are the workhorses of
HPLC, constituting over 70% of all detections system of all in us. Basically three
types of absorbance detectors are available: a fixed wavelength detector, a variable
detector, and a scanning wavelength.
Fixed wave length detectors
A fixed wavelength detector uses a light source that emits maximum light
intensity at one or several discrete wavelengths that are isolated by appropriate
Variable Wavelength detector
A variable wave length detector is a relatively wide-band pass it offers a
wide selection of UV and Visible wavelength, but at increased cost.
Photo Diode Array (PDA) Detector
To obtain a real time spectrum for each solute at it elutes, solid-state diode
arrays are required. The diode arrays work in parallel simultaneously monitoring all
wavelengths.
Digital electronic integrators
Were, widely used today in HPLC for measuring Peak areas. These devices
automatically sense peaks and print out the areas in numerical forms. Computing
integrators are even more sophisticated and offer a number of features in addition to
basic digital integration because these devices have both memory and computing
capabilities to upgrade integrating parameters to maintain accuracy as the separation
progress and eluting peaks become broader. Many of these devices print out a
complete report including names of the compounds, retention times, peak areas and
area correction factors. With the help of peak area and height values, the peak width
can be calculated (considering the peak as a triangle) and it can also be used for the
calculation of number of theoretical plates.
BUFFERS IN REVERSED-PHASE LIQUID CHROMOTOGRAPHY
Selection of a buffered aqueous mobile phase for reversed-phase liquid
fundamental effect of pH on retention of ionic analytes and checking some C.
Properties of the buffer options, a logical and reasonable choice can be derived.
This selection may need to be revised by consideration of certain factors,
such as solubility or limitations of compatibility with the means of detection.
Practical aspects of buffer preparation should also be observed for reproducible and
trouble-free operation.
The pH of the mobile phase will dramatically effect the retention of ionic
analytes within 1.5 pH units of their pKa. Thus, it can be understood why control of
mobile phase pH has great utility in method development and is critical for
reproducible separations of ionic analytes. Obviously, if the analyte is not ionic,
Table-2
Buffer
pKa(25°C) Maximum buffer
range UV Cutoff (nm)
TFA 0.3 _ 210 (0.1%)
Phosphate,H2PO4 pK1 2.1 1.1-3.1 <200
Phosphate,pK2HPO4
2-7.2 6.2-8.2 <200
Phosphate, pK3 PO4
3-12.3 11.3-13.3 <200
Citrate,pKC3H5O (CO2H)2 (CO2-)1
3.1 2.1-4.1 230
Citrate, pK2 C3H5O (CO2H)1 (CO2-)2
4.7 3.7-5.7 230
Citrate, pK3 C3H5O (CO2-)3
6.4 4.4-6.4 230
Carbonate,pK1HCO3
2-6.1 5.1-7.1 <200
Carbonate, pK2 CO3
2-10.3 9.3-11.3 >200
Formate 3.8 2.8-4.8 210 (10 NM)
Acetate 4.8 3.8-5.8 210 (10 NM)
Ammonia 9.3 8.3-10.3 200 (10 NM)
Borate 9.2 8.2-10.2 N/A
SELECTIVITY OF HPLC – METHOD DEVELOPMENT
Most of the drugs can be analyzed by HPLC method because of several
advantages like rapidity, specificity, accuracy, precision, case of automation and
eliminates tedious extraction and isolation procedures. Some of the advantages are:
∗
Speed (analysis can be accomplished in 20 or Less)∗
Greater sensitivity (Various detectors can be employed))∗
Improved Resolution (Wide variety of stationary phases)∗
Reliable columns (Wide variety of stationary phases)∗
Ideal for substances of low volatility∗
Easy sample recovery, handling and maintenance∗
Easy programming of the numerous functions in each module∗
Time programmable operation sequence, such as initiating operation ofdetector lamp and pump to obtain a stable baseline and equilibrated column before
the work day begins.
∗
Excellent reproducibility of retention times.∗
An injection volume variable from 0.1 to 100 micro liters without anyhardware modification.
∗
The flexibility of data analysis.∗
Suitable to avoid any interference from impurity.METHOD DEVELOPMENT BY RP-HPLC
HPLC method development is not very difficult when a literature reference
for the same or similar compounds to be analyzed can be found.
The first consideration when developing an HPLC method is to determine
the solubility of the sample components. Knowing the nature of the analytes will
allow the most appropriate mode of the HPLC to be selected. Summarizes
appropriate separation modes and mobile phases to consider for method
development. (Complex sample may require an initial clean – up step to remove
possible interferences) there is a temptation to quickly take an appropriate column,
prepare a sample and suitable mobile phase, and run it on the HPLC system. This
may with some trial and error, but the key to efficient method development
planning.
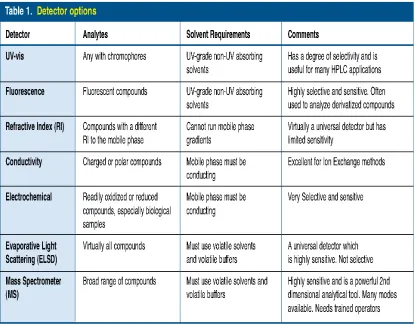
THE BEST DETECTORS
The next consideration should be choice of detector. There is a little use in
running a separation if the detector one uses cannot “see” all the components of
interest, or conversely, if it “see” too much. UV – Vis detectors are the most popular
as they can detect a broad range of compounds and have a fair degree of selectivity
for some analytes. Unfortunately UV – Vis detectors are not universal detectors so it
is worthwhile to look at the chemical structure of the analyte to see if it has suitable
Table.3 summarizes some of the available options.
THE BEST COLUMN LENGTH
Many chromatograms make the mistake of simply using what is available.
Often this a 250 x 4.6 mm c18 column. These columns are able to resolve a wide
variety of compounds (due to their selectivity and plate counts) and more common
to most laboratories. While many reverse phase separations can be carried out on
such a column, its high resolving capabilities are often unnecessary, as illustrated
fig. 2. Method development can be streamlined by starting with shorter column;
150, 100, or even 50 mm long. This simply because they have proportionally
THE BEST STATIONARY PHASE
Selecting an appropriate stationary phase can also help to improve the
efficiency of method development. For example, a C8 phase (reverse phase) can
provide a further time saving over a C18, as it does not retain analytes as strongly as
the C18 phase. For normal phase applications, cyano (nitrile) phase are the most
versatile.
THE BEST MOBILE PHASE
Since the mobile phase governs solute-stationary phase interactions, it choice
is critical. Practical considerations dictate that it should not degrade the equipment
or the column packing. For this reason, strong acids, bases and halide solutions
should be avoided. Chemical purity of solvents are pumped through the column,
to the results. AR and HPLC grade solvents are recommended. Volatility should be
considered if sample recovery is required.
Viscosity should be less than 0.5 centipoises, otherwise higher pump
pressure are required and mass transfer between solvent and stationary phase will be
reduced LC/MS – only volatile buffers.
THE BEST INTERNAL DIAMETER
By selecting a shorter column with an appropriate phase, run times can be
minimized so that an elution order and an optimum mobile phase can be quickly
determined. It can also be advantageous to consider the column internal diameter.
Many laboratories use 4.6 mm ID Columns as a standard, but it is worth considering
the use of 4 mm ID Columns as an alternative. These require only 75% of solvent
flow that a 4.6 mm column uses. This translates to a 25% solvent saving over the
life of the column and can be even more significant if a routine method is developed
POLARITY OF COMMON ORGANIC FUNCTIONAL GROUPS AND
SOLVENT
Functional Groups Non-polar Solvent
Aliphatic hydrocarbons Hexane
Olefins Carbon
tetrachloride
Aromatic hydrocarbons Ether
Halides Benzene
Sulphides Methylchloride
Ethers THF
Nitro components Isopropanol
Esters, aldehydes, ketones Chloroform
Alcohols, amines Ethyl acetate
Sulphones Acetonitrile
Sulphoxides Polar Methanol
ANALYTICAL METHOD VALIDATION
Method validation can be defined as (ICH) “Establishing documented evidence, which provides a high degree of assurance that a specific activity will
consistently produce a desired result or product meeting its predetermined
specifications and quality characteristics”.
Method validation is an integral part of the method development; it is the
process by which a method is tested by the developer or user for reliability, accuracy
and preciseness of its intended purpose and demonstrating that analytical procedures
are suitable for their intended use that they support the identity, quality, purity, and
potency of the drug substances and drug products Data thus generated become part
of the methods validation package submitted to Center for Drug Evaluation and
Research (CDER). Simply, method validation is the process of proving that an
analytical method is acceptable for its intended purpose.
Methods should be reproducible when used by other analysts, on other
equivalent equipment, on other days or locations, and throughout the life of the drug
product. Data that are generated for acceptance, release, stability, or
pharmacokinetic will only be trustworthy if the methods used to generate the data
are reliable. The process of validation and method design also should be clearly in
the development cycle before important data are generated. Validation should be on
going in the form of re-validation with method changes. (United states of
Pharmacopeia XX11)
Though many types of HPLC techniques are available, the most commonly
used method, the reversed-phase HPLC with UV detection, is selected to illustrate
extrapolated to other detection methods and chromatographic techniques. For
acceptance, release or stability testing, accuracy should be optimized since the need
to show deviation from the actual or true value is of the greatest concern.
All the variables of the method should be considered, including sampling
procedure, sample preparation, chromatographic separation, and detection and data
evaluation. For chromatographic methods used in analytical applications there is
more consistency in validation practice with key analytical parameters includes
namely System suitability Specificity Accuracy Precision Linearity
Limit of Detection
Limit of Quantitation Ruggedness Robustness System Suitability
According to the USP, system suitability tests are an integral part of
chromatographic methods. These tests are used to verify that the resolution and
reproducibility of the system are adequate for the analysis to be performed. System
suitability tests are based on the concept that the equipment, electronics, analytical
operations, and samples constitute an integral system that can be evaluated as a
testing system (including instrument, reagents, columns, analysts) is suitable for the
intended application.
Similar to the analytical method development, the system suitability test
Strategy should be revised as the analysts develop more experience with the assay.
In general, consistency of system performance. (Eg: Replicate injections of the
standard) and chromatographic suitability. (Eg: Tailing factor, column efficiency and
resolution of the critical pair) are the main components of system suitability.
During the early stage of the method development process some of the more
sophisticated system suitability tests may not be practical due to the lack of
experience with the method. In this stage, usually a more "generic" approach is used.
For example, evaluation of the tailing factor to check chromatographic suitability,
and replicate injections of the system suitability solution to check injection precision
may be sufficient for an HPLC impurities assay. As the method matures more
experience is acquired for this method, a more sophisticated system suitability test
may be necessary.
System suitability is the checking of a system to ensure system performance
before or during the analysis of unknowns. Parameters such as plate count, tailing
factors; resolution and reproducibility (%RSD retention time and area for six
repetitions) are determined and compared against the specifications set for the
method. These parameters are measured during the analysis of system suitability
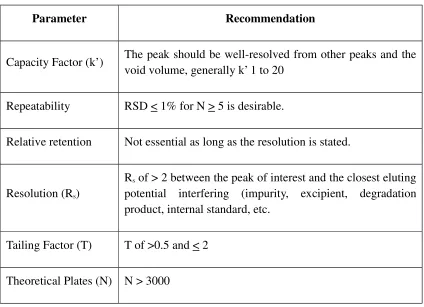
Table 4: System suitability parameters and recommendations
Parameter Recommendation
Capacity Factor (k’) The peak should be well-resolved from other peaks and the void volume, generally k’ 1 to 20
Repeatability RSD < 1% for N > 5 is desirable.
Relative retention Not essential as long as the resolution is stated.
Resolution (Rs)
Rs of > 2 between the peak of interest and the closest eluting potential interfering (impurity, excipient, degradation
product, internal standard, etc.
Tailing Factor (T) T of >0.5 and < 2
Theoretical Plates (N) N > 3000
Specificity/Selectivity
The terms selectivity and specificity are often used interchangeably.
According to ICH, the term specific generally refers to a method that produces a
response for a single analyte only while the term selectivity refers to a method that
provides responses for a number of chemical entities that may or may not be
distinguished from each other. If the response is distinguished from all other
responses, the method is said to be selective. Since there are very few methods that
respond to only one analyte, the term selectivity is usually more appropriate.
Specificity is the ability of a method to discriminate between the analyte(s)
to evaluate the degree of interference, if any, which can be attributed to other
analytes, impurities, degradation products, reagent "blanks" and excipients. This
provides the analyst with a degree of certainty that the response observed is due to
the single analyte of interest. The degree of specificity testing varies depending on
the method type and the stage of validation. Specificity should be evaluated
continually through the drug development process. Specificity is sometimes used
interchangeably with the term "selectivity". The argument over which term is more
correct is one of semantics. Although there is some dissention, the term "specificity"
has been adopted by the regulatory guidance documents and should be used to
prevent further confusion.
Non-Interference of Placebo
This portion of specificity evaluation applies to the finished drug product
only. Excipients present in the formulation should be evaluated and must not
interfere with the detection of the analyte. Individual solutions of each excipient
prepared at several times the normal concentration of the component in the drug
product ensure that any detector response from the excipient will be readily visible.
Injecting individual solutions of each excipient into the HPLC system in comparison
with a standard solution of the analyte is one means of performing this experiment.
The absence of a peak eluting at the retention time of the active ingredient is
sufficient to demonstrate specificity for excipients.
Injecting solutions of known process impurities, degradation products,
intermediates, homologues, dimers etc. further challenges the specificity of a
method. Identification of these compounds may require an extensive search in order
to identify all possible species that may be present in the sample. For new chemical
entities (NCE), this information may not be readily available. Probable suspects
should be identified by careful review of the synthetic route and manufacturing
process to identify any likely species that may be present in the sample.
Degradation Studies
Degradation studies involve exposing the sample to a variety of stressed
conditions to further evaluate the specificity of degradation products. In this study,
the drug substance, drug product, and the combined recipients (or placebos) are each
exposed to the stressed conditions. These may include, but are not limited to, heat,
light, acidic media, alkaline media, and oxidative environments. Other conditions
may be used depending on the nature and chemistry of the test subject. Forced
degradation is usually evaluated with not more than 20% degradation of the drug
substance, although more may be acceptable depending on the particular properties
of the drug. A reasonable effort should be made to degrade samples in order to
identify possible degradation products. If the planned experiments do not show any
appreciable degradation, the strength and/or exposure time of the stress condition
may be increased, but degradation is not required for every condition studied. There
is a point beyond which the stress condition becomes extreme and unrealistic. Sound
scientific judgment should be used to determine the extent and degree of degradation
studies.
Accuracy is the measure of how close the experimental value is to the true
value. Accuracy should be established across the specified range of the analytical
procedure.
Assay
(Drug Substance)
Several methods of determining accuracy are available:
a) Application of an analytical procedure to an analyte of known purity (e.g.
reference material);
b) Comparison of the results of the proposed analytical procedure with those of
a second well-characterized procedure, the accuracy of which is stated and/or
defined.
c) Accuracy may be inferred once precision, linearity and specificity have been
established.
Drug Product
Several methods for determining accuracy are available:
a. Application of the analytical procedure to synthetic mixtures of the drug
product components to which known quantities of the drug substance to be analyzed
have been added.
b. In cases where it is impossible to obtain samples of all drug product
components, it may be acceptable either to add known quantities of the analyte to
the drug product or to compare the results obtained from a second, well
c. Accuracy may be inferred once precision, linearity and specificity have been
established.
Impurities (Quantitation)
Accuracy should be assessed on samples (drug substance/drug product)
spiked with known amounts of impurities. In cases where it is impossible to obtain
samples of certain impurities and/or degradation products, it is considered
acceptable to compare results obtained by an independent procedure. The response
factor of the drug substance can be used. It should be clear how the individual or
total impurities are to be determined e.g., weight/weight or area percent, in all cases
with respect to the major analyte.
Recommendations
Accuracy should be assessed using a minimum of 9 determinations over a
minimum of 3 concentration levels covering the specified range (e.g. 3
concentrations / 3 replicates each of the total analytical procedure). Accuracy should
be reported as percent recovery by the assay of known added amount of analyte in
the sample or as the difference between the mean and the accepted true value
together with the confidence intervals.
Precision
Precision is the measure of how close the data values are to each other for a
number of measurements under the same analytical conditions. ICH has defined
precision to contain three components: repeatability, intermediate precision and
reproducibility. Ruggedness as defined in 1990 incorporates the concepts described
under the terms "intermediate precision", "reproducibility" and "robustness" of this
Repeatability
Injection Repeatability
Sensitivity is the ability to detect small changes in the concentration of the
analyte in the sample. Sensitivity can be partially controlled by monitoring the
specification for injection reproducibility (system suitability testing).
The sensitivity or precision as measured by multiple injections of a
homogeneous sample (prepared solution) indicates the performance of the HPLC
instrument under the chromatographic conditions and day tested.
The information is provided as part of the validation data and as a system
suitability test. The specification, as the coefficient of variation in % or relative
standard deviation (RSD), set here will determine the variation limit of the analysis.
The tighter the value, the more precise or sensitive to variation one can expect the
results. This assumes that the chromatograph does not malfunction after the system
suitability testing has been performed. Keep in mind, however, that it does not
consider variations due to the drug product manufacturing and laboratory sample
preparation procedures. The set of four duplicate samples were injected sequentially.
Variations in peak area and drift of retention times are noted.
Precision refers to the reproducibility of measurement within a set, that is, to
the scatter of dispersion of a set about its central value. The term ‘set’ is defined as
referring to a number (N) of independent replicate measurements of some property.
One of the most common statistical terms employed is the standard deviation of a
squares of deviations of individual results for the mean, divided by one less than the
number of results in the set. The standard deviation S, is given by
Standard deviation has the same units as the property being measured.
The square of standard deviation is called variance (S2
). Relative standard
deviation is the standard deviation expressed as a fraction of the mean, i.e., S/x. It is
sometimes multiplied by 100 and expressed as a percent relative standard deviation.
It becomes a more reliable expression of precision.
% Relative standard deviation = S x 100 / x
Recommendations
As part of methods validation, a minimum of 10 injections with an RSD of
2% is recommended. With the methods for release and stability studies, an RSD of
2% for precision of the system suitability tests for at least five injections (n=5) for
the active drug either in drug substance or drug product is desirable. For low-level
impurities, higher variations may be acceptable.
Analysis Repeatability
Determination, expressed as the RSD, consists of multiple measurements of
a sample by the same analyst under the same analytical conditions.
For practical purpose, it is often combined with accuracy and carried out as a single
Intermediate Precision
Intermediate precision was previously known as part of ruggedness. The
attribute evaluates the reliability of the method in a different environment other than
that used during development of the method. The objective is to ensure that the
method will provide the same results when similar samples are analyzed once the
method development phase is over. Depending on time and resources, the method
can be tested on multiple days, analysts, instruments, etc.
Intermediate precision in the test method can be partly assured by good
system suitability specifications. Thus, it is important to set tight, but realistic,
system suitability specifications.
Linearity
The linearity of a method is its ability to obtain test results that are directly
proportional to the analyte concentration over a given range. For HPLC methods, the
relationship between analyte concentration and detector response (peak area or
height) is used to make this determination.
Concentration Ranges
The concentration range used for linearity should be large enough to
encompass the desired range of the method. A minimum of five concentration ranges
should be investigated and a plot of the detector response vs. the sample
concentration should be generated. It is important that the concentration ranges
selected for the linearity study are relatively equally spaced throughout the range of
the method (e.g., 50%, 75%, 100%, 125% and 150%), and not clustered, as this will
Acceptance Criteria
Acceptance criteria should be evaluated to ensure that they are meaningful
when compared with the performance of the method. Table 6 gives a list of
suggested acceptance criteria for use in evaluating method linearity. The ranges in
Table 6 are suggestions only and should be adjusted to ensure that all specification
limits are within the validated linear range for any given method. Under most
circumstances, regression coefficient (r) is 0.999. Intercept and slope should be
indicated.
Statistical Analysis
Linearity data should be evaluated using appropriate statistical methods. A
simple regression line of the detector response vs the analyte concentration is the most common means of evaluation. Regulatory agencies require the submission of
the correlation coefficient, y-intercept, slope of the regression line, and the residual
sum of squares for linearity evaluation. A graphical representation of the linearity
data should also be generated. Additional analysis of the deviation of the actual
values from the regression line is suggested, especially when the method uses a
single-point calibration standard. The percent y-intercept is calculated by dividing
the y-intercept by the detector response at the nominal concentration expressed as a
percentage. For single-point calibration, this value should be less than 1-2% to
Table 5
Limit of Detection
These limits are normally applied to related substances in the drug substance
or drug product. Specifications on these limits are submitted with the regulatory
impurities method relating to release and stability of both drug substance and drug
product.
Limit of detection is the lowest concentration of analyte in a sample that can
be detected, but not necessarily quantitated, under the stated experimental
conditions. With UV detectors, it is difficult to assure the detection precision of
low-level compounds due to potential gradual loss of sensitivity of detector lamps with
age, or noise level variation by detector manufacturer. At low levels, assurance is
needed that the detection and quantitation limits are achievable with the test method
each time. With no reference standard for a given impurity or means to assure
detectability, extraneous peak(s) could "disappear/appear." A crude method to
evaluate the feasibility of the extraneous peak detection is to use the percentage
claimed for detection limit from the area counts of the analyte. Several approaches
for determining the detection limit are possible, depending on whether the procedure
is a non-instrumental or instrumental.
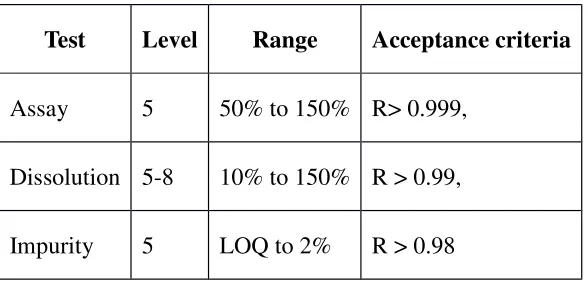
Test Level Range Acceptance criteria
Assay 5 50% to 150% R> 0.999,
Dissolution 5-8 10% to 150% R > 0.99,
Based on Visual Evaluation
Visual evaluation may be used for non-instrumental methods but may also be
used with instrumental methods. The detection limit is determined by the analysis of
samples with known concentrations of analyte and by establishing the minimum
level at which the analyte can be reliably detected.
Based on Signal-to-Noise
This approach can only be applied to analytical procedures which exhibit
baseline noise. Determination of the signal-to-noise ratio is performed by comparing
measured signals from samples with known low concentrations of analyte with those
of blank samples and establishing the minimum concentration at which the analyte
can be reliably detected. A signal-to-noise ratio between 3 or 2:1 is generally
considered acceptable for estimating the detection limit.
Based on the Standard Deviation of the Response and the Slope
The detection limit (DL) may be expressed as:
Where,σ = the standard deviation of the response
S = the slope of the calibration curve
The slope S may be estimated from the calibration curve of the analyte. The
Based on the Standard Deviation of the Blank
Analyzing an appropriate number of blank samples and calculating the
standard deviation of these responses perform measurement of the magnitude of
analytical background response.
Based on the Calibration Curve
A specific calibration curve should be studied using samples containing an
analyte in the range of DL. The residual standard deviation of a regression line or
the standard deviation of y-intercepts of regression lines may be used as the standard
deviation.
Recommendations
The detection limit and the method used for determining the detection limit
should be presented. If DL is determined based on visual evaluation or based on
signal to noise ratio, the presentation of the relevant chromatograms is considered
acceptable for justification.
In cases where an estimated value for the detection limit is obtained by
calculation or extrapolation, this estimate may subsequently be validated by the
independent analysis of a suitable number of samples known to be near or prepared
at the detection limit.
Limit of Quantification
Limit of quantitation is the lowest concentration of analyte in a sample that
can be determined with acceptable precision and accuracy under the stated
are possible, depending on whether the procedure is a non-instrumental or
instrumental.
Based on Visual Evaluation
Visual evaluation may be used for non-instrumental methods but may also be
used with instrumental methods. The quantitation limit is generally determined by
the analysis of samples with known concentrations of analyte and by establishing the
minimum level at which the analyte can be quantified with acceptable accuracy and
precision.
Based on Signal-to-Noise Approach
This approach can only be applied to analytical procedures that exhibit
baseline noise. Determination of the signal-to-noise ratio is performed by comparing
measured signals from samples with known low concentrations of analyte with those
of blank samples and by establishing the minimum concentration at which the
analyte can be reliably quantified. A typical signal-to-noise ratio is 10:1.
Based on the Standard Deviation of the Response and the Slope
The quantitation limit (QL) may be expressed as:
Where,
σ = the standard deviation of the response
The slope S may be estimated from the calibration curve of the analyte. The
estimate of s may be carried out in a variety of ways.
Based on Standard Deviation of the Blank
Measurement of the magnitude of analytical background response is
performed by analyzing an appropriate number of blank samples and calculating the
standard deviation of these responses.
Based on the Calibration Curve
A specific calibration curve should be studied using samples, containing an
analyte in the range of QL. The residual standard deviation of a regression line or
the standard deviation of y-intercepts of regression lines may be used as the standard
deviation.
Recommendations
The quantitation limit and the method used for determining the quantitation
limit should be presented. The limit should be subsequently validated by the analysis
of a suitable number of samples known to be near or prepared at the quantitation
limit. Otherwise the information that is expressed as % area or height of the drug
substance peak from the same HPLC chromatogram will be biased. It should also be
noted that the extraneous peak using area count does not consider the detection
response that depends on the UV extinction coefficient or absorptivity of the
Ruggedness
The ruggedness of an analytical method is the degree of reproducibility of
test results obtained by the analysis of the same samples under a variety of
conditions, such as different laboratories, analysts, instruments, reagents, elapsed
assay times, assay temperatures, or days. It is normally expressed as the lack of
influence on test results of operational and environmental variables of the analytical
method. Method Ruggedness is defined as the reproducibility of results when the
method is performed under actual use conditions. Method ruggedness may not be
known when a method is first developed, but insight is obtained during subsequent
use of that method.
Recommendations
The ruggedness of an analytical method is determined by analysis of aliquots
from homogeneous lots in different laboratories, by different analysts, using
operational and environmental conditions that may differ but are still within the
specified parameters of the assay. The degree of reproducibility of test results is then
determined as a function of the assay variables. This reproducibility may be
compared to the precision of the assay under normal conditions to obtain a measure
of the ruggedness of the method.
Robustness
ICH defines robustness as a measure of the method's capability to remain
unaffected by small, but deliberate variations in method parameters. Robustness can
be partly assured by good system suitability specifications. The evaluation of
type of procedure under study. It should show the reliability of an analysis with
respect to deliberate variations in method parameters. If measurements are
susceptible to variations in analytical conditions, the analytical conditions should be
suitably controlled or a precautionary statement should be included in the procedure.
One consequence of the evaluation of robustness should be that a series of system
suitability parameters (e.g., resolution test) is established to ensure that the validity
of the analytical procedure is maintained whenever used.
Examples of typical variations are:
Stability of analytical solutions Extraction time
In the case of liquid chromatography, examples of typical variations are
Influence of variations of pH in a mobile phase Influence of variations in mobile phase composition Different columns (different lots and/or suppliers) Temperature
Flow rate.
In the case of gas chromatography, examples of typical variations are
Different columns (different lots and/or suppliers) Temperature
Flow rate.
Recommendations
Data obtained from studies for robustness, though not usually submitted, are
General Recommendation:
System suitability testing is essential for the assurance of the quality
performance of the chromatographic system. The amount of testing required will
depend on the purpose of the test method. For dissolution or release profile test
methods using an external standard method, k', T and RSD are minimum
recommended system suitability tests. For acceptance, release, stability, or
impurities/degradation methods using external or internal standards, k', T, RS and RSD are recommended as minimum system suitability testing parameters. In
practice, each method submitted for validation should include an appropriate
number of system suitability tests defining the necessary characteristics of that
system. Additional tests may be selected at the discretion of the applicant or the
reviewer.
HPLC methods for drug substance and drug product, methods should not be
validated as a one-time situation, but methods should be validated and designed by
the developer or user to ensure ruggedness or robustness throughout the life of the
method. The variations due to the drug product manufacturing process, the
laboratory sample preparation procedure and the instrument performance contribute
to the accuracy of the data obtained from the analysis. With proper validation and
tight chromatographic performance (system suitability) criteria, an improvement in
the reliability of the data can be obtained. Variations except from the drug
product-manufacturing process will be minimized only with good reliable validated methods
LITERATURE REVIEW
RP-HPLC estimation of ramipril and telmisartan in tablets, Kurade .V.P
et at., (2009),
A rapid high performance liquid chromatographic method has been
developed and validated for the estimation of ramipril and telmisartan
simultaneously in combined dosage form. A Genesis C18 column having dimensions
of 4.6×250 mm and particle size of 5 µ m in isocratic mode, with mobile phase
containing a mixture of 0.01 M potassium dihydrogen phosphate buffer (adjusted to
pH 3.4 using orthophosphoric acid): methanol:acetonitrile (15:15:70 v/v/v) was
used. The mobile phase was pumped at a flow rate of 1.0 ml/min and the eluents
were monitored at 210 nm. The selected chromatographic conditions were found to
effectively separate ramipril (R t : 3.68 min) and telmisartan (R t : 4.98 min) having a resolution of 3.84. The method was validated in terms of linearity, accuracy,
precision, specificity, limit of detection and limit of quantitation. Linearity for
ramipril and telmisartan were found in the range of 3.5-6.5 µ g/ml and 28.0-52.0
µ g/ml, respectively. The percentage recoveries for ramipril and telmisartan ranged
from 99.09-101.64% and 99.45-100.99%, respectively. The limit of detection and
the limit of quantitation for ramipril was found to be 0.5 µ g/ml and 1.5 µ g/ml
respectively and for telmisartan was found to be 1.5 µ g/ml and 3.0 µ g/ml,
respectively. The method was found to be robust and can be successfully used to
determine the drug content of marketed formulations.
Development and Validation of RP-HPLC Method for Simultaneous
Estimation of Ramipril, Telmisartan and Hydrochlorothiazide in
A new simple, accurate, rapid and precise isocratic High performance liquid
chromatographic (HPLC) method was developed and validated for the determination
of Hydrochlorothiazide (HCTZ), Ramipril (RAM) and Telmisartan (TEL) in tablet
formulation. The Method employs Waters HPLC system on XTerra RP8 Column
(4.6 x 150 mm and 3.5 µ m) and flow rate of 0.8 ml/min with a load of 20µ l.
Acetonitrile and Phosphate buffer was used as mobile phase in the composition of
45:55. The Detection was carried out at 215 nm. Linearity ranges for
Hydrochlorothiazide, Ramipril and Telmisartan were 12.5-22.5 µ g/ml, 5-9µ g/ml
and 40-72µ g/ml respectively. Retention Time of Hydrochlorothiazide, Ramipril
and Telmisartan were found to be 2.83 min, 3.65 min and 5.03 min respectively.
Percent Recovery study values of HCTZ, RMP and TEL were found to be within
98-102 %.This newly developed method was successfully utilized for the Quantitative
estimation of Hydrochlorothiazide, Ramipril and Telmisartan in pharmaceutical
dosage forms. This method was validated for accuracy, precision, linearity and
Robustness as per ICH guidelines.
RP-HPLC Method for Simultaneous Estimation of Telmisartan and
Ramipril in Tablet Dosage Form, Harikridhnan .N et al .,(2011)
A simple, selective, rapid, precise and economical reverse phase HPLC
method has been developed for the simultaneous estimation of telmisartan and
Rampiril in tablet formulation. Chromatography was performed on a ODS Hypersil
C18 (25cm x 4.6 mm i.d., 5µ) column from thermo in isocratic mode with a mobile
phase consisting of acetonitrile: 10mM KH2PO4 PH 3.0 (40:60). The flow rate was
1.0 ml/min and eluent was monitored at 245 nm; the selected chromatographic
ramipril (RT-10.30 min). Linearity for telmisartan and ramipril were found in the
range of 16-24 µg/ml and 2-3 µg/ml, repectively. The proposed method can be used
forthe simultaneous estimation of these drugs in tablet formulation.
D.Isocratic Rp-Hplc Method Development And Validation For The
Simultaneous Estmation Of Ramipril And Telmisartan In Tablet Dosage Form
Manju Latha et al.,(2012)
An RP-HPLC method has been developed for the simultaneous estimation of
ramipril and telmisartan in tablet dosage forms. The developed method was
validated as per ICH guidelines and specificity, linearity & range, accuracy,
precision and robustness was performed. Specificity was determined by comparing
the results obtained by running the placebo solution with that of standard and
method was found to be specific due to no interference between placebo peaks and
drugs peaks. Linearity range was found to be 4 to16 µ g/ml and 32 to 128 µ g/ml of
ramipril and telmisartan respectively. The method was found to be linear in the
range of4 to 16µ g/ml and 32 to128 µ g/ml for ramipril and telmisartan respectively.
In the linearity study, regression equation and coefficient of correlation for ramipril
and telmisartan were found to be (y = 924480x - 151831, r =0.9997) and (y =
2901878.3558x + 3803877, r = 0.9996) respectively. This newly developed method
was successfully utilized for the simultaneous estimation of ramipril and telmisartan
in pharmaceutical tablet dosage forms.
Simultaneous Estimation of Ramipril and Telmisartan in Tablet Dosage
Two simple, accurate, sensitive and specific methods are described for the
simultaneousdetermination of Ramipril and Telmisartan in binary mixture. The
method based on UVspectrophotometricdetermination of two drugs, Method A is by
using multicomponant method. Itinvolves absorbance measurement at 205.0
nm(λmax of Ramipril) and 291.0 nm (λmax ofTelmisartan) in 0.2M H2SO4;. Beer’s
law is obeyed in the concentration range of 5-40 µg mL-1 forRamipril and 2-20 µg
mL-1 for Telmisartan. Method B is graphical absorbance method which isbased on
measurement of absorbance of Ramipril and Telmisartan at 222.0nm
(iso-absorptivepoint of Ramipril and Telmisartan) and 291.0 nm (λmax of Telmisartan)
Both these methods havebeen successively applied to pharmaceutical formulation
and were validated according to ICHguidelines.
Simultaneous Determination of Ramipril, Hydrochlorothizide and
Telmisartan by Spectrophotometry, Tapadiya.G.Get. al., (2009).
A simple, fast and precise multicomponent mode analysis method has been
developed for simultaneous determination of Ramipril (RMP), Hydrochlorothiazide
(HCT) and Telmisartan (TEL) in tablet formulation. The wavelengths selected for
these drugs were 218nm, 271nm and 296nm respectively using methanol as solvent.
The linearity for these drugs at all the selected wavelengths lies between 0.5-3.5
_gml-1for RP, 1.25-8.75 _gml-1for HCT and 4-28 _gml-1for TEL.
Theconcentrations of these drugs were evaluated in laboratory mixture and marketed
formulation. Accuracy was determined byrecovery studies from tablet dosages forms
and ranges from 99.09-99.52%. Precision of method was find out as
repeatability,day to day and analyst to analyst variation and shows the values within