***
*
*
*
* *
*
***
Theme 2
ISSN 1024-4239
Economy and finance
Series B
Short-term statistics
~
ECU-EMS Information
eurostat
&
Central Bank Interest Rates
6
D
1997
Monthly
Bilateral fluctuations of ERM currencies
Graph 1 on page 4 shows the trends in the bilateral fluctuation of ERM currencies between 1 April 1997 and 30 May 1997 calculated on a daily basis.
This graph shows that during the whole period under consideration, there were no serious tensions in the bilateral fluctuation of all but one ERM currency. Specifically, the I EP, in spite of the reversal of its upward trend at the end of April, continued to be the strongest currency in the ERM grid for the eighth month in succession. As the IEP lost ground against the OEM and the other ERM currencies, the width of the band within which all ERM currencies moved decreased from 7.57% on 30 April 1997 to 6.97% on 30 May 1997. The graph also shows that during the whole period considered, the ITL and the FRF were the weakest currencies in the ERM grid.
By the end of May, all ERM currencies but the IEP moved within a band of 1.99% which is narrower than at the end of the previous month (2.57%, if the IEP is excluded).
Central bank interest rates
In May the official interest rates were cut in Greece, Spain and Portugal but raised in Ireland and the United Kingdom.
The Bank of Greece cut 100 base points off the discount rate (to 14.50%), the Lombard rate (19.0%) and the deficit coverage rate (24.0%). The last time rates had been cut was in February, when the Bank of Greece had taken 100 base points off the first two rates, bringing the discount rate to 15.5% and the Lombard rate to 20.0%. Inflation in Greece continued to ease, with a year-on-year figure of 5.7% at the end of April compared with 8.5% a year earlier. This was the lowest inflation rate recorded in Greece since October 1972.
In Spain, in conjunction with the tendering operation of 16 May, 25 base points were shaved off the ten-day repo rate, bringing it down to 5.25%. The previous reduction had been on 15 April. The rate has come down by 100 base points ' ~ since the start of the year and by 375 points from its position at the beginning of 1996. Inflation at the end of April was running at an annual rate of 1.6%, compared with 3.4% a year earlier.
In Portugal the official rates were cut on Monday 12 May, the first day of the period for constituting banks' statutory reserves. The repo rate was down by 30 base points to 6.0%,
by 1 O base points to 5. 7%. The emergency lending rate was also cut by 10 base points and now stands at 7.7%.
While the reference rates were reduced in Greece, Spain and Portugal, the opposite occurred in the United Kingdom, where the base rate edged up 25 base points to 6.25%. The last time the rate was raised in the United Kingdom was in October 1996.
In Ireland, too, there was a rise in rates, with the short-term facilities (STF) rate increasing at the start of the month by 50 base points to 6. 75%. It was the first time since March 1995 that the central bank had been prompted to raise the cost of borrowing. Prior to this decision, the Irish punt had dipped sharply against the German mark and the pound sterling. The growth of borrowing in the private sector reached 18.6% in March compared with 15.8% in February.
In the other countries the reference rates stayed at the same levels as at the end of April.
In the Netherlands the central bank introduced a new official rate: the 24-hour repo rate. This new rate will serve as a ceiling rate similar to the Lombard rate in Germany.
Real effective exchange rates
The European Commission, Directorate-General for Economic and Financial Affairs (DG 11-0-4), provides a periodic assessment of the price and cost competitiveness of the European Union (EUR 15), the group of countries participating in the ERM, the 15 EU countries individually, as well as 5 other industrial countries. Five real effective exchange rates (each based on a different deflater ) have been calculated in order to provide a comprehensive assessment of a country's price and cost competitiveness.
These deflators are:
a) the Consumer Price Index,
b) the GDP deflater,
c) the price deflater of exports of goods and services
d) Unit Labour costs in Economy as a whole and
e) Unit Labour costs in Manufacturing.
[3!Lj
eurostat
STATISTICAL OFFICE OF THE EUROPEAN COMMUNITIES
L-2920 Luxembourg -Tel. 4301-1 -Telex COMEUR LU 3423 B-1049 Bruxelles, rue de la Loi 200 - Tel. 299 11 11
Note
For any information on the statistics in this bulletin contact Luxembourg:
TEL: +352 423113-486
+352 423113-494 OU 489
FAX: +352 424607
EUROSTAT
Monetary and Financial Statistics
Jean Monnet Building
APC C4/04
L-2920 Luxembourg
©
European Communities, 1997F. GARCIA-VALERO I R. SCHMITZ S. WARTON-WOODS I 0. DELOBBE (Central Bank Interest Rates)
TABLE OF CONTENTS
Comments ---
1
European Monetary System
Table I. Graph 1. Graph 2. Central rates and intervention limit rates ---4Bilateral Fluctuations of the ERM currencies---5
Divergence indicator of the ERM currencies ---5
ECU exchange rates
Table II. ECU exchange rates ---6Consumer price indices
Table Ill. Table IV. Consumer price indices in national currency---8Consumer price indices in ECU --- 1
O
ECU bond market
Table V. Table VI. Table VII. Table VIII. EC U bond issues--- --- --- --- --- -- 12Last month's ECU bond issues--- 12
Outstanding amount of ECU bonds--- 13
Total of the secondary market turnover and% of market taken by ECU securities ---13
ECU interest rates
Table IX. Graph 3. Graph 4. Operation rates of the EMI and interest rates and yields of ECU investments--- 14E CU yield curve --- 15
Evolution of ECU yields--- 15
Central bank interest rates
Table X. Graph~ Central Bank interest rates --- 16Evolution of central bank interest rates over the last 12 months ---
19
TABLE I
CENTRAL RATES AND INTERVENTION LIMIT RATES, IN FORCE SINCE 25TH NOVEMBER 1996, FOR THE CURRENCIES OF COUNTRIES PARTICIPATING IN THE EMS EXCHANGE RATE MECHANISM.
[3?L)
1 ECU = 100 BEF =100 LUF = 100 DKK = 100 OEM= 100 ESP= 100 FRF = 1 IEP = 1000 ITL = 100 NLG = 100 ATS = 100 PTE = eurostat
BEF + 627.880 2395.20 28.1525 714.030 57.7445 24.1920 2125.60 340.420 23.3645 LUF 39.7191 = 540.723 2062.55 24.2447 614.977 49.7289 20.8337 1830.54 293.163 20.1214
-
-
465.665 1776.20 20.8795 529.660 42.8260 17.9417 1576.45 252.470 17.3285 + 21.4747-
442.968 5.20640 132.066 10.6792 4.47400 393.105 62.9561 4.32100 DKK 7.34555 = 18.4938 381.443 4.48376 113.732 9.19676 3.85294 338.537 54.2170 3.72119 15.9266 328.461 3.86140 97.9430 7.92014 3.31810 291.544 46.6910 3.20460 + 5.63000 30.4450 1.36500 34.6250 2.80000 1.17290 (103.058)* 16.5050 1.13280 OEM 1.92573 = 4.84837 26.2162 1.17548 29.8164 2.41105 1.01010 88.7526 14.2136 0.975561-
4.17500 22.5750 1.01230 25.6750 2.07600 0.869900 (76.4326)* 12.2410 0.840100 + 478.944 2589.80 9878.50 2945.40 238.175 99.7800 8767.30 1404.10 96.3670 ESP 163.826 = 412.461 2230.27 8507.18 - 2536.54 205.113 85.9311 7550.30 1209.18 82.9927 - 355.206 1920.70 7326.00 2184.40 176.641 74.0000 6502.20 1041.30 71.4690 + 18.8800 102.100 389.480 4.57780 9.38950 3.93379 345.650 55.3545 3.79920 FRF 6.45863 = 16.2608 87.9257 335.386 3.94237 8.08631 3.38773 297.661 47.6706 3.27188 14.0050 75.7200 288.810 3.39510 6.96400 2.91750 256.350 41.0533 2.81770 + 2.33503 12.6261 48.1696 0.566120 14.3599 0.486472 42.7439 6.84544 0.469841 IEP 0.798709 = 2.01090 10.8734 41.4757 0.487537 12.3666 0.418944 36.8105 5.89521 0.404620 1.73176 9.36403 35.7143 0.419859 10.6500 0.360789 31.7007 5.07688 0.348453 + 5573.60 30138.0 114956 1351.30 34276.0 2771.70 - 102027 16339.0 1121.50 ITL 1906.48 = 4799.91 25954.2 99000.4 1163.72 29518.3 2386.95 87864.7 14071.5 965.805 4133.60 22351.0 85259.0 1002.20 25421.0 2055.61 75668.0 12118.8 831.700 + 6.34340 34.3002 (130.834)* 1.53793 39.0091 3.15450 1.32156 - 18.5963 1.27637 NLG 2.16979 = 5.46286 29.5389 112.673 1.32445 33.5953 2.71662 1.13811 16.0149 1.09920 - 4.70454 25.4385 (97.0325)* 1.14060 28.9381 2.33952 0.980132 13.7918 0.946611 + 39.6089 214.174 816.927 9.60338 243.586 19.6971 8.25219 725.065 7.97000 ATS 13.5485 = 34.1107 184.444 703.550 8.27008 209.773 16.9629 7.10655 624.417 6.86356- 29.3757 158.841 605.877 7.12200 180.654 14.6082 6.12032 537.740 5.91086 + 577.090 3120.50 11903.3 139.920 3549.00 286.983 120.240 10564.0 1691.80
PTE 197.398 = 496.984 2687.31 10250.5 120.493 3056.35 247.145 103.541 9097.55 1456.97 -428.000 2314.30 8827.70 103.770 2632.10 212.838 89.1700 7834.70 1254.70
-+ 17.1148 92.5438 353.008 4.14938 105.253 8.51107 3.56570 313.295 50.1744 3.44376 FIM 5.85424 = 14.7391 79.6976 304.000 3.57345 90.6422 7.32960 3.07071 269.806 43.2094 2.96570 12.6931 68.6347 261.801 3.07740 78.0597 6.31217 2.64438 232.353 37.2114 2.55402 GRD 295.269 Table prepared by the EMI following notification by the central banks concerned.(notional) * These buying and selling rates are not operational. Reflecting a bilateral agreement between GBP 0.793103 the German and Dutch monetary authorities, the following rates continue to apply:
(notional) selling rate HFL 100 in Frankfurt: OM 90.7700; buying rate HFL 100 in Frankfurt: OM 86.7800; selling rate OM 100 in Amsterdam: HFL 115.2350; buying rate OM 100 in Amsterdam: HFL 110.1675.
WEIGHTS OF COMPONENT CURRENCIES IN THE ECU, CALCULATED ON THE BASIS OF CENTRAL RATES IN FORCE
SINCE 25.11.1996 COMPOSITION OF THE ECU BASKET
[3!Lj
eurostatDEM
0.33% BEF 8.31%
10.13%
Since 21/09/1989
0.6242 OEM 1.332 FRF 0.2198 NLG 3.301 BEF 0.13 LUF 151.8 ITL 0.1976 DKK 0.008552 IEP
0.08784 GBP 1.44 GRO 6.885 ESP 1.393 PTE
= 1 ECU
100 FIM =
787.830 678.468 584.290 145.699 125.474 108.057 . 38.1970 32.8948 28.3280 3249.50 2798.41 2410.00 128.107 110.324 95.0096 15.8424 13.6433 11.7494 37816.0 32565.8 28045.0 43.0378 37.0636 31.9187 268.735 231.431 199.305 3915.40 3371.88 2903.80
[image:4.616.38.587.382.987.2]-GRAPH 1:
BILATERAL FLUCTUATIONS OF THE ERM CURRENCIES
7o/o - - - --- - - - --- - - - --- - - --- - - - -- - -- - - --- - - - --- - -- -- - -- - - -- --- - - --- 70/0
6%
I
=v/1
6%eurostat
5% 5%
4% 4%
3% 3%
2% 2%
1% 1%
O%+-t-+-+--+--+--+--+---+-+--+--+--+--+---+-+--+--+--+--t-+-+--+--+-+-t-+-+--+--+-+-f--+-+--+--+--+-f--+-+--+-~o%
NLG
-1% -1%
-2% -2%
-3% -3%
-4% -4%
-5% -5%
-6% -6%
DKK
-7°/o • • • • • • • • • • • • • • • • • • • • • • • • • • • • • • • • • • • • • • · • --- - - --- --- - --- - - - -- --- -- -- --- - -7o/o
1-4-97 15-4-97 29-4-97 15-5-97 30-5-97
GRAPH 2:
DIVERGENCE INDICATOR
75 - - - --- - - -- - ---- -- -- --- - - --- - - --- - - - --- - - -. 75
I
=vi1
60 eurostat 60
45 45
30 30
ESP
FIN15 15
DKK
-60 -60
-75 ., .. .,.,, .. ,. ..•...•.. ., .. ., ..•...•.. ., .. ., . ., .. ., ..•...•.. ., .. ., . ., .. ., ..•...•.. ., .. ., ..•...•.. ., .. ,,.,. .. ., .. ., ..•.. ., .. .,.,. ...•..•... ., . ., .. ., ..•...•.. ., .. ., .. , ...•..•...•.. ., .. ., .. , ... , .. ,, .. ., . ., .. ., ..•...•.. ., .. .,.,. ...•..•...•.. ., .. ., .. , ... ., .. ., ..•...•.. ., .. .,.,... -75
TABLE II
ECU EXCHANGE RATES
[3!l)
eurostat 1986 1987 1988 1989 1990 1991 1992 1993 1994 1995 1996 96/05 96/06 96/07 96/08 96/09 96/10 96/11 96/12 97/01 97/02 97/03 97/04 97/05 02/05 05/05 06/05 07/05 09/05 12/05 13/05 14/05 15/05 16/05 20/05 21/05 22/05 23/05 26/05 27/05 28/05 29/05 30/05 BEF/LUF 43.7979 43.0410 43.4285 43.3806 42.4257 42.2233 41.5932 40.4713 39.6565 38.5519 39.2986 39.2952 39.3649 39.3623 39.1954 39.3520 39.6079 39.7803 39.9852 40.1916 40.2865 40.2446 40.4130 40.397840.3834 40.4147 40.4668 40.4494 40.3298 40.3013 40.3598 40.4416 40.4011 40.4360 40.4446 40.4372 40.4180 40.3901 40.3813 40.3749 40.3761 40.3795 40.3723 DKK
7.93565 7.88472 7.95152 8.04929 7.85652 7.90859 7.80925 7.59359 7.54328 7.32804 7.35934
7.37931 7.37905 7.36763 7.35381 7.36091 7.37211 7.41390 7.42533 7.43573 7.44647 7.44074 7.46133 7.45370 7.45011 7.46030 7.47157 7.46205 7.43999 7.43611 7.44525 7.45925 7.45541 7.46067 7.46269 7.46006 7.45564 7.45134 7.44979 7.45082 7.45030 7.45190 7.44707 OEM 2.12819 2.07153 2.07440 2.07015 2.05209 2.05076 2.02031 1.93639 1.92452 1.87375 1.90954
1.91165 1.91356 1.91083 1.90229 1.91115 1.92291 1.93039 1.94008 1.94959 1.95240 1.95065 1.95870 1.95723 1.95700 1.95855 1.96091 1.95989 1.95426 1.95253 1.95546 1.95940 1.95746 1.95912 1.95946 1.95909 1.95799 1.95672 1.95616 1.95598 1.95585 1.95591 1.95559
GRD
137.425 156.268 167.576 178.840 201.412 225.216 247.026 268.568 288.026 302.989 305.546
303.239 302.636 302.052 303.998 303.798 301.784 304.419 306.810 305.515 305.971 306.940 309.698 312.134
311.353 311.216 311.355 311.324 311.084 312.071 311.897 312.558 312.716 312.145 311.655 311.693 312.196 312.366 312.733 313.245 313.098 313.337 312.499
ESP FRF IEP ITL NLG ATS
Yearly averages 137.456 142.165 137.601 130.406 129.411 128.469 132.526 149.124 158.918 163.000 160.748
6.79976 0.733526 1461.88 2.40090 14.9643 6.92910 0.775448 1494.91 2.33418 14.5710 7.03644 0.775672 1537.33 2.33479 14.5861 7.02387 0.776818 1510.47 2.33526 14.5695 6.91412 0.767768 1521.98 2.31212 14.4399 6.97332 0.767809 1533.24 2.31098 14.4309 6.84839 0.760718 1595.51 2.27482 14.2169 6.63368 0.799952 1841.23 2.17521 13.6238 6.58261 0.793618 1915.06 2.15827 13.5395 6.52506 0.815525 2130.14 2.09891 13.1824 6.49300 0.793448 1958.96 2.13973 13.4345
Monthly averages
159.558 161.414 161.392 161.319 161.095 161.865 162.498 163.358 163.687 165.370 165.472 165.347 165.229
6.46945 0.797219 1942.36 2.13730 13.4513 6.48599 0.791060 1932.36 2.14355 13.4668 6.47101 0.792324 1939.80 2.14448 13.4475 6.49518 0.796395 1946.30 2.13381 13.3864 6.50787 0.788059 1929.22 2.14253 13.4475 6.50223 0.782308 1918.52 2.15714 13.5283 6.53269 0.767118 1932.35 2.16519 13.5839 6.55398 0.753196 1910.75 2.17691 13.6517 6.57973 0.744611 1904.88 2.18931 13.7169 6.59149 0.734539 1929.35 2.19305 13.7399 6.58039 0. 735243 1948.10 2.19515 13. 7286 6.59734 0.738064 1939.02 2.20278 13.7860 6.60037 0.759171 1933.46 2.20127 13.7760
Daily rates: 05-97
165.086 165.137 165.517 165.470 165.101 165.228 165.177 165.382 165.206 165.099 164.964 164.906 164.968 165.003 165.207 165.070 165.586 165.713 165.534
TABLE II
ECU EXCHANGE RATES
PTE FIM SEK GBP ISK NOK CHF USO VEN
[3!L]
eurostat
Yearly averages
147.088 4.97974 6.99567 0.671543 40.3813 7.27750 1.76086 0.98417 164.997 1986
162.616 5.06517 7.31001 0.704571 44.5548 7.76498 1.71780 1.15444 166.598 1987
170.059 4.94362 7.24192 0.664434 50.7794 7.70054 1.72822 1.18248 151.459 1988
173.413 4.72301 7.09939 0.673302 62.8909 7.60381 1.80010 1.10175 151.938 1989
181.109 4.85496 7.52051 0.713851 74.0013 7.94851 1.76218 1.27343 183.660 1990
178.614 5.00211 7.47926 0.701012 73.0052 8.01701 1.77245 1.23916 166.493 1991
174.714 5.80703 7.53295 0.737650 74.6584 8.04177 1.81776 1.29810 164.223 1992
188.370 6.69628 9.12151 0.779988 79.2528 8.30954 1.73019 1.17100 130.147 1993
196.896 6.19077 9.16307 0.775902 83.1063 8.37420 1.62128 1.18952 121.322 1994
196.105 5.70855 9.33192 0.828789 84.6853 8.28575 1.54574 1.30801 123.012 1995
195.761 5.82817 8.51472 0.813798 84.6558 8.19659 1.56790 1.26975 138.084 1996
Monthly averages
196.450 5.93167 8.47882 0.822658 83.9541 8.20054 1.56415 1.24668 132.567 96/05
197.066 5.85009 8.37071 0.812532 84.1862 8.18508 1.57450 1.25292 136.393 96/06
196.501 5.82689 8.43833 0.817683 84.8056 8.19491 1.56644 1.27064 138.793 96/07
195.336 5.74750 8.49551 0.827934 85.0551 8.22904 1.54317 1.28325 138.418 96/08
195.200 5.75969 8.42542 0.813841 84.7580 8.19539 1.56306 1.26907 139.428 96/09
194.313 5.75156 8.30499 0.793727 84.3810 8.15901 1.58325 1.25841 141.397 96/10
195.164 5.81198 8.46235 0.768046 84.5893 8.11739 1.62727 1.27690 143.347 96/11
195.689 5.79696 8.53149 0.751642 83.8167 8.08792 1.65914 1.25025 142.369 96/12
194.906 5.80111 8.57942 0.732336 82.9998 7.84290 1.69061 1.21621 143.256 97/01
196.137 5.80357 8.63090 0.717022 82.0945 7.73421 1.69440 1.16576 143.305 97/02
196.038 5.82909 8.80670 0.716049 81.7817 7.83178 1.68433 1.14976 140.932 97/03
196.523 5.87300 8.79398 0.702754 81.4965 7.98969 1.67348 1.14501 143.749 97/04
197.210 5.90352 8.81908 0.703563 80.9024 8.12416 1.64348 1.14934 136.296 97/05
Daily rates:
05-97
196.369 5.90129 8.88656 0.703491 81.1243 8.03922 1.66857 1.13508 143.781 02/05
196.637 5.90796 8.94352 0.699312 81.0389 8.08463 1.66780 1.13309 143.268 05/05
197.145 5.90890 8.92372 0.693250 80.9959 8.08372 1.66810 1.13360 142.664 06/05
196.947 5.90304 8.81920 0.696254 81.2124 8.10527 1.66154 1.14046 142.489 07/05
196.587 5.89785 8.82867 0.709259 81.1364 8.11824 1.65135 1.14957 140.270 09/05
196.706 5.90025 8.82905 0.712680 81.0751 8.14093 1.64790 1.15262 136.965 12/05
196.547 5.89859 8.84759 0.708218 81.0014 8.12716 1.65050 1.14993 137.130 13/05
196.973 5.90266 8.78626 0.701326 80.8946 8.10094 1.66083 1.14793 136.259 14/05
197.483 5.92437 8.76119 0.705226 80.9874 8.13233 1.65171 1.15812 133.937 15/05
197.537 5.91736 8.76998 0.702604 80.9008 8.14426 1.64637 1.15276 132.821 16/05
196.985 5.89685 8.73822 0.702912 80.6525 8.12123 1.62425 1.15432 131.396 20/05
197.140 5.92092 8.73048 0.702625 80.7989 8.15940 1.63234 1.16074 131.918 21/05
197.267 5.89894 8.74393 0.705368 80.8475 8.11655 1.63117 1.15645 133.882 22/05
197.382 5.89708 8.78382 0.707514 80.8610 8.16061 1.62970 1.15516 133.744 23/05
197.723 5.90738 8.82025 0.705993 80.8147 8.14226 1.62289 1.15797 134.521 26/05
197.648 5.89524 8.79876 0.705418 80.7613 8.14753 1.63169 1.15159 134.126 27/05
197.908 5.89884 8.82951 0.703258 80.6833 8.13732 1.63045 1.14983 133.104 28/05
198.039 5.89992 8.86367 0.701450 80.7533 8.14371 1.62610 1.14919 133.524 29/05
TABLE Ill
CONSUMER PRICE INDICES IN NATIONAL CURRENCY
1985=100
@!LI
EUR151
ERM
8DK
D
EL
eurostat
1991 129.7 121.6 114.6 124.1 110.9 265.9 1992 135.1 126.4 117.3 126.7 115.3 308.1 1993 139.7 130.5 120.6 128.3 119.5 352.6
1994 144.0 134.0 123.4 130.8 122.7 391.1 1995 148.5 137.1 125.3 133.6 125.0 427.4 1996 152.2p 139.9p 127.8 136.4 126.8 463.7
1996 01 150.3p 138.4p 126.9 134.3 125.7 444.7 02 150.8p 139.0p 127.2 135.0 126.4 443.3 03 151.4p 139.5p 127.3 135.8 126.5 458.4 04 152.0p 139.7p 127.5 136.1 126.6 464.2 05 152.3p 140.0p 127.3 136.6 126.8 467.2 06 152.4p 139.9p 127.3 136.5 126.9 469.9
07 152.3p 140.2p 128.1 136.3 127.4 458.2 08 152.4p 140.2p 128.4 136.5 127.2 458.0 09 152.9p 140.4p 128.1 137.2 127.1 471.7
10 153.0p 140.5p 128.5 137.4 127.1 476.1 11 153.0p 140.5p 128.7 137.7 127.0 474.5 12 153.3p 140.7p 128.9 137.6 127.4 478.7
1997 01 n.a. n.a. n.a. n.a. n.a. n.a.
02 n.a. n.a. n.a. n.a. n.a. n.a.
03 n.a. n.a. n.a. n.a. n.a. n.a.
04 n.a. n.a. n.a. n.a. n.a. n.a.
Annual rate of increase(%)
@!LI
EUR15
ERM
eurostat 8
DK
D
EL
1991 5.1 4.4 3.2 2.4 3.6 19.5
1992 4.2 3.9 2.4 2.1 4.0 15.9
1993 3.4 3.2 2.8 1.3 3.6 14.5
1994 3.1 2.7 2.4 2.0 2.7 10.9
1995 3.1 2.3 1.5 2.1 1.8 9.3
1996 2.5p 2.0p 2.1 2.1 1.5 8.5
1996 01 2.8p 2.0p 2.0 1.7 1.5 8.4
02 2.7p 2.0p 1.9 1.8 1.6 8.5
03 2.7p 2.2p 2.0 2.1 1.7 9.1
04 2.7p 2.1p 2.0 2.0 1.5 9.2
05 2.7p 2.2p 1.9 1.9 1.7 9.1
06 2.5p 2.1p 1.8 2.0 1.4 8.8
07 2.5p 2.2p 1.9 2.3 1.6 8.6
08 2.3p 1.9p 1.9 2.4 1.4 8.5
09 2.3p 1.9p 2.0 2.3 1.4 8.5
10 2.4p 2.0p 2.5 2.4 1.5 8.3
11 2.2p 1.9p 2.4 2.4 1.4 7.7
12 2.2p 2.0p 2.5 2.3 1.4 7.5
1997 01 n.a. n.a. n.a. n.a. n.a. n.a.
02 n.a. n.a. n.a. n.a. n.a. n.a.
03 n.a. n.a. n.a. n.a. n.a. n.a.
04 n.a. n.a. n.a. n.a. n.a. n.a.
. .
p=prov1s1onal
n.a. = not available
E
FI
IRL
I
IL
I
NL
145.0 120.2 121.3 140.0 112.4 108.3 153.5 123.0 125.1 147.3 115.9 111.7 160.6 125.6 126.9 153.8 120.1 114.6 168.1 127.8 129.8 160.0 122.7 117.8
176.0 129.9 133.2 168.3 125.1 120.1 182.3 132.6 135.4 174.8 126.8 122.6
179.6 131.2 172.3p 125.9 121.1
180.1 131.7 134.4 172.8p 126.0 121.5
180.7 132.5 173.3p 126.3 122.5
181.8 132.8 174.2p 126.6 122.6
182.4 133.0 135.0 174.9p 126.7 122.4
182.2 132.9 175.3p 126.7 121.9
182.4 132.6 175.0p 126.8 122.4
183.0 132.3 135.7 175.2p 126.9 122.3
183.5 132.8 175.7p 127.0 123.4
183.6 133.1 175.8p 127.4 123.8
183.6 133.0 136.4 176.3p 128.0 123.7
184.2 133.2 176.5p 127.8 123.6p
n.a. n.a. n.a. n.a. n.a. n.a.
n.a. n.a. n.a. n.a. n.a. n.a.
n.a. n.a. n.a. n.a. n.a. n.a.
n.a. n.a. n.a. n.a. n.a. n.a.
E
FIRL
IL
I
NL
6.0 3.2 3.1 6.3 3.1 3.9
5.9 2.4 3.1 5.2 3.2 3.2
4.6 2.1 1.4 4.5 3.6 2.6
4.7 1.7 2.3 4.0 2.2 2.8
4.7 1.8 2.6 5.2 1.9 1.9
3.6 2.0 1.7 3.9 1.4 2.1
3.9 2.0 5.4p 1.1 1.9
3.7 2.0 2.0 4.9p 1.0 1.8
3.4 2.3 4.5p 1.2 2.1
3.5 2.4 4.6p 1.5 2.0
3.8 2.4 1.4 4.4p 1.4 2.0
3.6 2.3 3.9p 1.2 1.8
3.7 2.3 3.6p 1.3 2.2
3.7 1.6 1.4 3.3p 1.4 1.9
3.5 1.6 3.4p 1.3 2.0
3.5 1.8 3.1p 1.5 2.4
3.2 1.6 1.9 2.8p 1.9 2.3
3.2 1.7 2.7p 1.8 2.5p
n.a. n.a. n.a. n.a. n.a. n.a.
n.a. n.a. n.a. n.a. n.a. n.a.
n.a. n.a. n.a. n.a. n.a. n.a.
TABLE Ill
CONSUMER PRICE INDICES IN NATIONAL CURRENCY
1985=100
A
pFIN
115.1 189.6 132.8
119.7 206.7 136.7
124.0 220.0 139.7
127.7 231.5 141.2
130.5 241.1 142.6
133.0 248.6 143.5
131.2 243.4 142.6
131.8 245.1 143.1
132.4 246.1 143.3
132.3 248.3 143.5
132.1 249.5 143.8
132.8 249.2 143.8
134.0 249.7 143.7
134.8 250.4 143.4
133.7 250.4 143.7
133.4 250.2 143.9
133.5 250.6 143.5
133.5p 250.8 143.5
n.a. n.a. n.a.
n.a. n.a. n.a.
n.a. n.a. n.a.
n.a. n.a. n.a.
Annual rate of increase(%)
A
p3.3 10.9
4.0 9.0
3.6 6.4
3.0 5.2
2.2 4.1
1.9 3.1
1.7 2.5
1.6 2.5
1.8 2.4
1.6 2.9
1.5 3.5
1.6 3.6
1.9 3.9
1.8 3.6
2.0 3.4
2.1 3.0
2.3· 3.0
2.3p 3.3
n.a. n.a.
n.a. n.a.
n.a. n.a.
n.a. n.a.
p=provisional
n.a. = not available
r=revised
F
I
N
4.3 2.9 2.2 1.1 1.0 0.6 0.5 0.5 0.6 0.7 0.8 0.4 0.5 0.4 0.5
0.7 0.7 0.8
n.a. n.a. n.a. n.a.
s
UK
IS
147.8 141.1 267.5
151.1 146.4 278.1
158.2 148.7 289.5
161.6 152.4 294.0
165.7 157.6 298.8
166.5 161.4 305.6
166.2 158.8 302.1
166.4 159.5 302.6
167.2 160.1 303.1
167.5 161.3 303.6
167.3 161.6 305.5
166.7 161.7 305.2
166.3 161.1 305.5
165.5 161.8 307.4
166.5 162.6 308.1
166.4 162.6 308.3
166.0 162.7 308.4
165.8 163.2 307.1
n.a. n.a. n.a.
n.a. n.a. n.a.
n.a. n.a. n.a.
n.a. n.a. n.a.
s
UK
IS
9.6 5.9 6.8
2.6 3.7 4.0
4.7 1.6 4.1
2.3 2.5 1.6
2.9 3.4 1.7
0.7 2.4 2.3
2.0 2.9 1.6
1.7 2.7 1.7
1.7 2.7 2.0
1.3 2.4 2.3
1.0 2.2 2.8
0.8 2.1 2.6
0.6 2.2 2.4
0.3 2.1 2.6
0.2 2.1 2.5
-0.1 2.7 2.1
-0.3 2.7 2.5
-0.2 2.5 2. 1
n.a. n.a. n.a.
n.a. n.a. n.a.
n.a. n.a. n.a.
n.a. n.a. n.a.
N
CH
USA
JAP
CAN
[3?LJ
eurostat
140.0 119.8 126.6 110.4 131.4 1991
143.3 124.6 130.5 112.3 133.4 1992
146.5 128.7 134.3 113.8 135.8 1993
148.6 129.8 137.8 114.6 136.1 1994
152.2 132.2 141.7 114.4 139.0 1995
154.1 133.2 145.9 114.7 141.2 1996
152.2 132.8 143.6 114.2 139.7 1996 01
152.3 133.1 144.0 114.0 140.0 02
153.0 133.3 144.8 114.2 140.5 03
153.5 133.4 145.3 115.0 140.9 04
153.7 132.9 145.6 115.2 141.3 05
153.9 133.2 145.7 114.8 141.2 06
154.5 133.0 146.0 114.7 141.2 07
154.4 133.3 146.3 114.4 141.3 08
155.1 133.4 146.7 114.9 141.5 09
155.7 133.6 147.2 115.1 141.8 10
155.7 133.3 147.5 114.8r 142.5 11
155.6 133.4 147.5 114.5p 142.5 12
n.a. n.a. n.a. n.a. n.a. 1997 01
n.a. n.a. n.a. n.a. n.a. 02
n.a. n.a. n.a. n.a. n.a. 03
n.a. n.a. n.a. n.a. n.a. 04
N
I
CH
I
USA
I
JAP
CAN
[3?LJ
eurostat
3.4 5.8 4.2 3.3 5.6 1991
2.3 4.0 3.0 1.7 1.5 1992
2.3 3.3 3.0 1.3 1.8 1993
1.4 0.9 2.6 0.7 0.2 1994
2.5 1.8 2.8 -0.1 2.2 1995
1.3 0.8 2.9 0.2 1.6 1996
1.2 1.5 2.7 -0.4 1.6 1996 01
0.9 0.8 2.7 -0.2 1.3 02
0.7 0.9 2.8 0.1 1.4 03
1.0 0.9 2.9 0.4 1.4 04
1.0 0.7 2.9 0.3 1.5 05
0.9 0.7 2.8 0.0 1.4 06
1.3 0.7 3.0 0.6 1.2 07
1.5 0.6 2.9 0.2 1.4 08
1.3 0.6 3.0 -0.1 1.5 09
1.7 0.8 3.0 0.6 1.8 10
1.8 0.7 3.3 0.5r 2.0 11
1.8 0.8 3.3 0.2p 2.2 12
n.a. n.a. n.a. n.a. n.a. 1997 01
n.a. n.a. n.a. n.a. n.a. 02
n.a. n.a. n.a. n.a. n.a. 03
[image:9.614.78.554.442.764.2]TABLE IV
CONSUMER PRICE INDICES IN ECU
1985=100
[3?ZI
eurostat EUR15 ERM ECU
1991 124.7 123.4 122.2
1992 128.2 128.1 126.8 1993 128.2 132.5 131.0 1994 131.1 135.6 134.6
1995 132.8 140.7 138.0 1996 138.0p 142.6p 141.1p
1996 01 135.1 p 142.3p 139.5p 02 135.7p 142.6p 140.0p 03 136.5p 143.0p 140.5p 04 137.4p 143.1p 140.9p 05 138.1 p 142.8p 141.1p 06 138.4p 142.4p 141.1p 07 138.2p 142.8p 141.3p
08 138.1 p 143.0p 141.3p 09 138.9p 142.8p 141.6p 10 139.5p 142.5p 141.8p 11 139.6p 141.9p 141.8p 12 140.3p 142.0p 142.1 p
1997 01 n.a. n.a. n.a.
02 n.a. n.a. n.a.
03 n.a. n.a. n.a.
04 n.a. n.a. n.a.
Annual rate of increase(%)
[3?ZI
EUR15 ERM ECU eurostat1991 5.0 4.0 4.4 1992 2.9 3.8 3.8
1993 0.0 3.4 3.3 1994 2.3 2.3 2.8 1995 1.2 3.8 2.5
1996 4.0p 1.4p 2.2p 1996 01 2.4p 3.4p 2.4p 02 2.7p 2.9p 2.4p 03 4.4p 2.2p 2.4p 04 5.0p 1.5p 2.3p 05 4.6p 1.5p 2.3p 06 4.5p 0.9p 2.1p 07 4.4p 1.0p 2.2p 08 3.3p 1.3p 2.0p 09 3.5p 1.2p 2.0p
10 4.3p 0.7p 2.2p 11 4.2p a.op 2.1p
12 4.2p O.Op 2.1p
1997 01 n.a. n.a. n.a.
02 n.a. n.a. n.a.
03 n.a. n.a. n.a.
04 n.a. n.a. n.a.
p=provisional
n.a. = not available
B DK
121.9 125.8 126.7 130.1 133.8 135.5 139.8 139.1 146.0 146.2 146.1 148.6
146.9 147.5 147.1 148.2 146.9 148.9 146.4 148.6
145.4 148.4
145.2 148.3 146.2 148.3 147.1 148.9 146.3 149.5 145.7 149.5 145.3 148.9 144.8 148.6
n.a. n.a. n.a. n.a. n.a. n.a. n.a. n.a.
B DK
3.7 1.7
4.0 3.4 5.7 4.2 4.5 2.7 4.4 5.1 0.1 1.7 2.9 4.3 2.1 4.0 0.3 3.5 -0.6 1.3
-0.7 0.6 -1.0 0.6 -0.6 1.0 0.7 1.7 0.4 1.5 -0.5 0.9 -0.8 0.4
-0.9 0.4
n.a. n.a. n.a. n.a. n.a. n.a. n.a. n.a.
D EL E F IRL I L
120.4 122.9 145.5 117.1 113.0 132.1 119.6 127.1 129.9 149.6 122.1 117.6 133.9 125.2 137.3 136.7 139.3 128.7 113.6 121.0 133.3 142.0 141.3 136.4 131.8 117.0 120.9 139.0 148.5 146.8 139.3 135.4 116.8 114.3 145.8 147.9 158.0 146.2 138.8 122.1 129.2 145.0 148.3 149.0 145.6 137.9 117.8 121.8p 145.7 149.0 147.8 145.9 137.8 118.0 123.4p 145.7 148.7 154.1 146.2 138.9 118.0 125.2p 145.7
148.1 157.9 147.7 139.7 119.6 127.4p 145.5 147.7 160.3 147.4 139.7 121.1 130.2p 144.9
147.7 161.6 145.6 139.2 122.0 131.2p 144.5 148.4 157.9 145.7 139.3 122.5 130.5p 144.7 148.9 156.8 146.3 138.4 121.9 130.2p 145.4
148.1 161.6 146.9 138.6 123.1 131.7p 144.9 147.2 164.2 146.3 139.1 124.7 132.6p 144.4
146.5 162.2 145.7 138.3 127.2 132.0p 144.5 146.1 162.4 145.4 138.1 129.5 133.6p 143.6
n.a. n.a. n.a. n.a. n.a. n.a. n.a.
n.a. n.a. n.a. n.a. n.a. n.a. n.a. n.a. n.a. n.a. n.a. n.a. n.a. n.a.
n.a. n.a. n.a. n.a. n.a. n.a. n.a.
D EL E
I
F IRL I L3.7 6.9 6.7 2.3 3.1 5.5 3.6 5.6 5.8 2.9 4.2 4.1 1.4 4.7 8.1 5.3 -6.9 5.4 -3.4 -9.5 6.5 3.4 3.4 -1.9 2.4 3.1 0.0 4.3 4.6 3.9 2.1 2.7 -0.2 -5.4 4.9
-0.4 7.6 5.0 2.5 4.6 13.1 -0.5 2.2 3.2 7.4 3.7 -0.4 3.0p 2.1
1.6 3.3 7.0 3.2 0.8 5.4p 1.2
-0.5 6.3 9.8 3.6 3.1 16.1 p -0.5
-1.2 7.7 8.6 3.1 3.4 21.4p -1.1
-1.1 8.5 5.9 4.2 3.8 17.3p -1.2
-1.2 8.3 3.9 3.3 4.7 17.4p -1.5 -0.7 9.0 3.4 2.8 4.9 15.6p -1.2
0.4 8.0 3.4 1.4 3.5 11.2p 0.2 0.0 8.6 4.0 1.5 4.3 11.6p -0.2
-1.3 10.3 3.5 2.3 6.7 14.1 p -1.4
-1.5 9.5 2.3 0.6 9.4 12.2p -1.2 -1.8 8.8 1.0 0.5 10.9 11.8p -1.7
[image:10.620.37.583.431.990.2]TABLE IV
CONSUMER PRICE INDICES IN ECU
1985:100
NL A p
117.7 124.7 137.9 123.3 131.7 153.8 132.3 142.4 152.1 137.1 147.5 152.8 143.7 154.9 159.7 143.9 154.8 165.1 143.8 154.6 161.5 144.2 155.2 162.2 145.2 155.6 163.2 144.7 154.6 165.1 143.8 153.6 165.0 142.8 154.3 164.3 143.3 155.9 165.2 143.9 157.5 166.6 144.6 155.6 166.7 144.1 154.3 167.3 143.4 153.8 166.9 142.5p 153.0p 166.5
n.a. n.a. n.a.
n.a. n.a. n.a.
n.a. n.a. n.a.
n.a. n.a. n.a.
Annual rate of increase(%)
NL A
3.9 3.4 4.8 5.6 7.3 8.1 3.6 3.6 4.8 5.0 0.1 -0.1 2.8 2.4 1.9 1.8 0.1 -0.3 -0.6 -1.0 -0.6 -1.3 -0.9 -1.0 -0.3 -0.5 0.8 0.8 0.5 0.5 -0.5 -0.7 -0.7 -0.6 -0.9p -0.9p
n.a. n.a.
n.a. n.a.
n.a. n.a.
n.a. n.a.
p=provisional n.a. = not available r=revised p 12.5 11.5 -1.0 0.6 4.6 3.3 2.6 2.0 1.8 3.1 3.2 3.3 3.8 3.6 4.0 4.3 3.9 4.1 n.a. n.a. n.a. n.a.
FIN
s
124.8 128.8 110.9 131.0 98.0 113.2 107.2 115.1 117.3 116.0 115.5 127.5 116.7 124.7 114.6 122.4 114.0 126.3 112.6 128.6 113.8 128.7 115.4 129.8 115.7 128.5 117.1 127.0 117.1 128.8 117.4 130.6 115.9 127.9 116.2 126.7
n.a. n.a.
n.a. n.a.
n.a. n.a.
n.a. n.a.
FIN
s
1.3 9.9 -11.1 1.8 -11.4 -13.5 9.4 1.7 9.5 0.8 -1.5 10.2 3.0 8.5 0.1 6.4 -1.6 12.6 -3.5 17.2 -3.0 14.6
-1.8 16.0 -1.6 14.8 -2.0 11.0 -1.7 9.1 -1.2 8.3 -2.7 2.6
-1.7 0.9
n.a. n.a.
n.a. n.a.
n.a. n.a.
n.a. n.a.
UK IS
118.5 n.a. 117.2 n.a.
112.2 n.a.
115.6 n.a.
111.9 n.a.
116.9 n.a.
110.7 n.a. 111.9 n.a. 112.3 n.a. 113.8 n.a.
115.6 n.a. 117.1 n.a.
115.9 n.a. 115.0 n.a.
117.5 n.a.
120.5 n.a. 124.6 n.a. 127.8 n.a.
n.a. n.a.
n.a. n.a.
n.a. n.a.
n.a. n.a.
UK IS
7.9 n.a.
-1.0 n.a.
-3.9 n.a. 3.1 n.a.
-3.2 n.a.
4.6 n.a.
-3.9 n.a.
-1.9 n.a. 0.7 n.a. 2.4 n.a. 3.4 n.a. 4.9 n.a. 5.4 n.a. 2.6 n.a. 3.8 n.a. 8.4 n.a.
13.3 n.a. 15.5 n.a.
n.a. n.a.
n.a. n.a.
n.a. n.a.
n.a. n.a.
N CH USA JAP CAN
[3?L)
eurostat
113.7 125.4 77.7 119.9 96.0 1991 116.0 127.2 76.4 123.6 88.2 1992 114.8 138.1 86.9 158.3 92.9 1993 115.5 148.6 87.9 170.4 86.8 1994 119.6 158.7 82.1 168.7 80.1 1995 122.4 157.7 87.0 149.9 84.3 1996 119.6 161.7 84.2 151.0 81.8 1996 01 120.2 160.3 84.7 151.1 81.6 02 120.9 161.3 85.6 151.9 83.0 03 121.7 160.5 87.1 153.1 84.8 04 122.0 157.6 88.5 156.8 85.5 05 122.4 156.9 88.1 151.8 85.3 06 122.7 157.5 87.0 149.0 83.9 07 122.1 160.3 86.3 149.2 82.9 08 123.2 158.4 87.6 148.7 84.1 09 124.2 156.6 88.6 146.9 86.2 10 124.8 152.0 87.5 144.5r 86.1 11 125.3 149.2 89.3 145.2p 86.5 12
n.a. n.a. n.a. n.a. n.a. 1997 01
n.a. n.a. n.a. n.a. n.a. 02
n.a. n.a. n.a. n.a. n.a. 03
n.a. n.a. n.a. n.a. n.a. 04
N CH USA JAP CAN
[3?L)
eurostat
2.5 5.3 7.4 14.2 10.9 1991 2.0 1.5 -1.2 3.4 -7.6 1992 -1.0 8.6 14.0 28.3 5.6 1993 0.6 7.7 1.4 8.3 -6.5 1994 3.5 6.9 -6.6 -1.0 -7.5 1995 2.4 -0.6 6.1 -10.9 5.3 1996 1.5 6.5 -1.3 -9.6 0.9 1996 01 1.5 4.7 0.3 -9.3 0.7 02 1.1 1.6 5.7 -12.0 7.4 03 2.3 -0.1 9.2 -16.7 9.1 04 2.4 -0.7 9.0 -15.1 6.9 05 2.3 -1.4 9.2 -17.5 8.7 06 2.7 -0.1 9.0 -15.0 6.5 07 1.9 1.7 4.5 -10.7 1.7 08 2.0 -1.4 4.6 -7.3 1.6 09 2.8 -3.5 8.2 -5.2 6.5 10 3.8 -6.4 7.0 -5.5r 6.9 11 4.3 -7.8 7.8 -6.6p 7.1 12
n.a. n.a. n.a. n.a. n.a. 1997 01
n.a. n.a. n.a. n.a. n.a. 02
n.a. n.a. n.a. n.a. n.a. 03
TABLE V
ECU BOND ISSUES (Mio ECU) *
[3?ll
TOTAL EURO European Union Non-European Union Domestic** EURO+Total
I
BusinessI
Govern- , lnstitu- TotalI
BusinessI
Govern-1 Organi- DOMESTICeurostat sector ments tions sector ments sations
1990 15 040 10 525 3 990 5 OOO 1 535 4 515 3 565 550 400 2 857 17 897
1991 27163 19 266 6 581 7 900 4 785 7 897 3 932 3 790 175 3134 30 297
1992 19 242 11 675 4 870 2475 4330 7 567 3 902 2 850 815 4 151 23 393
1993 6 870 5 020 1 565 250 3205 1 850 250 1 600 0 6 508 13 378
1994 6 485 5 010 1 825 1 300 1 885 1 475 1 075 400 0 7 311 13 796
1995 5 596 5 046 956 3 075 1 015 550 550 0 0 6 784 12 380
1996 3 180 3180 2 215 115 850 0 0 0 0 8 216 11 396
1995 IV 565 565 350 0 215 0 0 0 0 720 1 285
1996 I 605 605 605 0 0 0 0 0 0 2 073 2 678
II 870 870 315 55 500 0 0 0 0 2 247 3 117
Ill 1 330 1 330 1 030 0 300 0 0 0 0 1 905 3 235
IV 375 375 265 60 50 0 0 0 0 I 991 2 366
1997 I 3 295 3 295 1 745 0 1 550 0 0 0 0 2 574 5 869
1997 2 1 450 1 450 450 0 1 OOO 0 0 0 0 738 2 188
3 1 275 1 275 725 0 550 0 0 0 0 426 1 701
4 1 350 1 350 350 1 OOO 0 0 0 0 0 1 040 2 390
5 120 120 120 0 0 0 0 0 0 566 691
[image:12.616.33.582.409.990.2](*) Recording based on the payment date (**) Only domestic issues which can be assimilated with Eurobonds
TABLE VI
LAST MONTH'S ECU BOND ISSUES
I
eurostat=v/1
Issue Amount
Issued Issue Term Lead
Payment Borrower & country
(Mio Price Coupon (years) Maturity Yield% Manager Listing Notice
Date
Ecu)
07 .05.1997
France OAT 566 95.28 5.50 9+11m 25.04.2007 6.15 Auct PA FG
21.05.1997
12.05.1997
GECC (US) 150 101.495 5. 125 5.00 10.06.2002 4.78 Paribas LU
10.06.1997
12.05.1997
BGL (LU) 100 102.00 5.50 6.00 27 .06.2003 5.10 BGL LU
27 .06.1997
BIL 21.05.1997
Credit Local de France 125 101.30 5.375 6.00 02.07.2003 5.12 Credit LU
02.07.1997 Communal
Beige
28.05.1997
CEA INVEST NV (BE) 60 101.65 5.50 5.00 03.12.2002 5.14 Cerabank
TABLE VII
OUTSTANDING AMOUNT OF ECU BONDS (IN MILLIONS OF ECU)
l=Va
Issuers Residual maturity in years Totaleurostat < 1 1-3 3-5 5-7 7-10 >10
GOV 8 808 29 164 14 897 6 292 9 675 4 OOO 72 835
31/05/97 SUPRA 2 655 4 550 6 600 2 550 100 600 17 055
Others - 3 682 7 529 6 971 3 289 2 380 225 24076
Total 15145 41 243 28 468 12 131 12155 4 825 113 967
GOV 9 749 29 564 15 397 6 292 9 109 4 OOO 74110
30/04/97 SUPRA 2 505 4 950 6 600 2 250 400 600 17 305
Others 3 932 7 494 6 856 3 364 2 380 225 24 251
Total 16186 42 008 28 853 11 906 11 889 4 825 115 667
GOV 10 099 25 394 15 272 5 590 9 992 6 074 72 420 31/03/97 SUPRA 2 800 4 950 6150 1 OOO 2 100 600 17 600
Others 3 832 8 044 6 951 3106 2 180 425 24 538
Total 16 731 38388 28 373 9 696 14 272 7 099 114 559
GOV 9 254 30 681 13 927 6 929 9 992 4 750 75 533
31/12/96 SUPRA 3 512 4 950 6 620 1 500 700 600 17 882
Others 5 437 8 864 6 474 1 632 2 436 625 25 468
Total 18 203 44 495 27 021 10 061 13128 5 975 118 883
GOV 12 526 25 589 19 483 10 746 7 468 4 750 80 562
31/12/95 SUPRA 3 047 5 732 5 150 4 900 700 600 20129
Others 6 963 9 954 6 099 4 337 1 438 1 325 30116
Total 22 536 41 275 30 732 19 983 9606 6675 130 807
GOV 11 288 20 359 21 093 10 021 10 235 5 750 78 746 31/12/94 SUPRA 2 610 6 359 4 900 5 170 2 200 600 21 839
Others 9 315 12 235 7 654 5 134 2177 1 325 37 840
Total 23 213 38 953 33 647 20 325 14 612 7 675 138 425
GOV = Central governments SUPRA= Supranational institutions
TABLE VIII
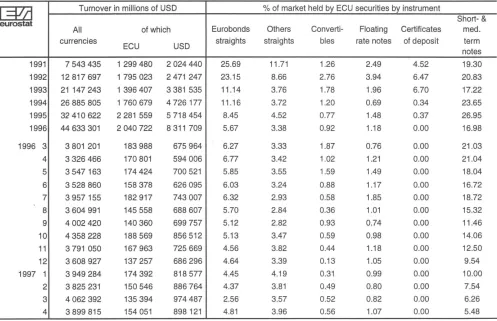
TOTAL SECONDARY MARKET TURNOVER AND% OF MARKET TAKEN BY ECU SECURITIES
l=Va
Turnover in millions of USO % of market held by ECU securities by instrumentShort-&
eurostat
All of which Eurobonds Others Converti- Floating Certificates med. currencies
ECU USO straights straights bles rate notes of deposit term notes 1991 7 543 435 1 299 480 2 024 440 25.69 11.71 1.26 2.49 4.52 19.30 1992 12 817 697 1795023 2 471 247 23.15 8.66 2.76 3.94 6.47 20.83 1993 21 147 243 1 396 407 3 381 535 11.14 3.76 1.78 1.96 6.70 17.22 1994 26 885 805 1760679 4 726 177 11.16 3.72 1.20 0.69 0.34 23.65 1995 32 410 622 2 281 559 5 718 454 8.45 4.52 0.77 1.48 0.37 26.95 1996 44 633 301 2 040 722 8 311 709 5.67 3.38 0.92 1.18 0.00 16.98
1996 3 3 801 201 183 988 675 964 6.27 3.33 1.87 0.76 0.00 21.03 4 3 326 466 170 801 594 006 6.77 3.42 1.02 1.21 0.00 21.04 5 3 547 163 174 424 700 521 5.85 3.55 1.59 1.49 0.00 18.04
6 3 528 860 158 378 626 095 6.03 3.24 0.88 1.17 0.00 16.72
7 3 957 155 182 917 743 007 6.32 2.93 0.58 1.85 0.00 18.72
8 3 604 991 145 558 688 607 5.70 2.84 0.36 1.01 0.00 15.32 9 4 002 420 140 360 699 757 5.12 2.82 0.93 0.74 0.00 11.46 10 4 358 228 188 569 856 512 5.13 3.47 0.59 0.98 0.00 14.06 11 3 791 050 167 963 725 669 4.56 3.82 0.44 1.18 0.00 12.50 12 3 608 927 137 257 686 296 4.64 3.39 0.13 1.05 0.00 9.54 1997 1 3 949 284 174 392 818 577 4.45 4.19 0.31 0.99 0.00 10.00
TABLE IX
OPERATION RATES OF THE EMI (CALCULATION MONTH, APPLICABLE THE FOLLOWING MONTH) AND INTEREST RATES AND YIELDS OF ECU INVESTMENTS(%)
[3?Lj
EMI * Deposits (maturity in months) Yield on ECU bonds (maturity in years)eurostat 1
I
3I
6I
12 1I
2I
3I
4I
5I
6I
7I
1992 10.29 10.43 10.41 10.27 10.01
1993 8.21 8.27 7.99 7.65 7.11 7.28 6.87 6.74 6.78 6.91 7.04 7.14
1994 5.92 5.95 5.98 6.05 6.21 6.35 6.77 7.01 7.13 7.24 7.39 7.55
1995 5.88 5.85 5.90 5.98 6.15 6.23 6.66 6.99 7.25 7.46 7.63 7.76
1996 4.35 4.34 4.31 4.32 4.39 4.45 4.79 5.17 5.55 5.90 6.18 6.40
1995 12 5.25 5.31 5.22 5.16 5.12 5.12 5.43 5.76 6.10 6.39 6.62 6.79
1996 1 5.25 4.83 4.75 4.70 4.68 4.69 4.95 5.29 5.67 6.00 6.25 6.44
2 4.75 4.62 4.57 4.53 4.54 4.54 4.98 5.41 5.81 6.15 6.42 6.65
3 4.50 4.56 4.54 4.54 4.61 4.63 5.17 5.65 6.06 6.40 6.66 6.85
4 4.50 4.38 4.35 4.34 4.41 4.50 4.93 5.37 5.78 6.14 6.41 6.61
5 4.25 4.31 4.24 4.23 4.29 4.37 4.82 5.28 5.71 6.08 6.37 6.59
6 4.25 4.35 4.34 4.35 4.49 4.58 5.03 5.44 5.82 6.15 6.45 6.70
7 4.25 4.33 4.34 4.37 4.53 4.59 5.02 5.42 5.78 6.10 6.38 6.62
8 4.25 4.28 4.29 4.32 4.44 4.56 4.90 5.28 5.67 6.02 6.30 6.51
9 4.25 4.14 4.15 4.17 4.28 4.38 4.66 5.03 5.42 5.78 6.07 6.30
10 4.00 4.06 4.06 4.07 4.12 4.20 4.36 4.66 5.03 5.39 5.69 5.93
11 4.00 4.07 4.07 4.09 4.15 4.23 4.41 4.70 5.03 5.36 5.63 5.86
12 4.00 4.11 4.06 4.07 4.09 4.13 4.27 4.54 4.87 5.20 5.49 5.72
1997 1 4.00 4.01 3.99 3.98 3.98 4.02 4.13 4.39 4.71 5.05 5.35 5.60
2 3.75 4.04 4.03 4.02 4.02 4.02 4.13 4.35 4.62 4.91 5.18 5.41
3 3.75 4.12 4.13 4.16 4.21 4.26 4.45 4.69 4.97 5.25 5.50 5.72
4 4.00 4.05 4.07 4.11 4.19 4.23 4.46 4.74 5.05 5.35 5.62 5.85
5 4.00 4.01 4.05 4.09 4.16 4.18 4.35 4.60 4.88 5.17 5.43 5.66
(*) See explanatory notes
DAILY RATES
[3?Lj
Deposits (maturity in months) Yield on ECU bonds (maturity in years)eurostat
1
I
3I
6I
12 1I
2I
3I
4I
5I
6I
7I
1.05.97 4.03 4.06 4.12 4.19 4.20 4.40 4.67 4.96 5.26 5.53 5.76
2.05.97 4.03 4.06 4.11 4.19 4.20 4.39 4.64 4.91 5.18 5.44 5.67
6.05.97 4.03 4.06 4.11 4.19 4.12 4.37 4.63 4.91 5.18 5.45 5.68
7.05.97 4.01 4.06 4.10 4.18 4.11 4.36 4.62 4.90 5.18 5.44 5.67
8.05.97 4.02 4.06 4.11 4.19 4.09 4.36 4.64 4.91 5.18 5.44 5.67
9.05.97 4.03 4.06 4.11 4.19 4.15 4.35 4.60 4.88 5.16 5.41 5.65
12.05.97 4.02 4.06 4.10 4.19 4.15 4.32 4.55 4.82 5.10 5.35 5.58
13.05.97 4.02 4.05 4.09 4.17 4.15 4.28 4.50 4.78 5.07 5.32 5.54
14.05.97 4.01 4.04 4.09 4.16 4.15 4.26 4.49 4.77 5.06 5.32 5.54
15.05.97 4.00 4.04 4.09 4.16 4.15 4.28 4.51 4.79 5.07 5.33 5.55
16.05.97 4.00 4.04 4.07 4.13 4.19 4.31 4.53 4.80 5.08 5.34 5.56
19.05.97 4.00 4.03 4.06 4.13 4.16 4.31 4.53 4.80 5.08 5.34 5.57
20.05.97 4.00 4.03 4.06 4.13 4.19 4.32 4.55 4.83 5.12 5.37 5.59
21.05.97 4.00 4.03 4.06 4.13 4.17 4.32 4.56 4.83 5.10 5.35 5.56
22.05.97 4.00 4.03 4.06 4.13 4.22 4.39 4.64 4.S2 5.20 5.46 5.67
23.05.97 4.00 4.03 4.06 4.13 4.22 4.37 4.62 4.91 5.21 5.47 5.69
27.05.97 4.00 4.03 4.06 4.13 4.26 4.42 4.69 5.01 5.32 5.57 5.78
28.05.97 4.00 4.03 4.06 4.13 4.24 4.41 4.68 4.99 5.30 5.57 5.80
29.05.97 4.02 4.06 4.09 4.16 4.22 4.40 4.67 4.99 5.30 5.58 5.81
30.05.97 4.01 4.05 4.09 4.16 4.20 4.37 4.63 4.94 5.25 5.53 5.76
8
I
9I
107.20 7.22 7.19 7.66 7.69 7.56 7.85 7.88 7.86 6.57 6.72 6.85
6.92 7.03 7.14
6.59 6.74 6.92 6.83 7.00 7.16 7.01 7.17 7.34 6.77 6.91 7.05 6.77 6.91 7.04 6.89 7.01 7.07 6.80 6.92 6.99 6.68 6.81 6.92 6.47 6.61 6.72 6.12 6.27 6.39 6.04 6.19 6.32 5.91 6.07 6.22
5.81 5.98 6.14 5.62 5.78 5.90 5.91 6.07 6.20 6.04 6.19 6.30 5.85 6.01 6.14
8
I
9I
10GRAPH 3: ECU YIELD CURVE
I
=¥/1
eurostat
Yield
7.5% --,---.----~----,,---~---~--~---.---~
7.0% - - - ;- - - 1- - - I- - - I- - - I- - - I - -
-6.5%
6.0%
5.5%
5.0% - - -
-' '
4.5%
4.0% -t---+----+---i----+----+---!---t---+--~
2 3 4 5 6 7 8 9 10
Maturity (years)
1-30-05-97 --=--30-04-97 --31-05-961
GRAPH 4: EVOLUTION OF ECU YIELDS
I
=vii
- 2 years """"""""'10 yearseurostat
Yield
7.5% --,---,--~---.---,--~---.---,--~---.---,--~-~
7.0%
6.5% - - - -' - - - - ' -
-6.0%
5.5% - - -
-I I I I I I I I I I I
6 7 8 9 10 11 12 1 2 3 4 5
TABLEX
CENTRAL BANK INTEREST RATES
D EL E
[3!L)
B DKeurostat DR AUCT AR CR DR REPO CD DR LA REPO 3D TB DR LR OR REPO AR
05/96 06/96 07/96 08/96 09/96 10/96 11/96 12/96 01/97 02/97 03/97 04/97 05/97
01.04.97 02.04.97 03.04.97 04.04.97 07.04.97 08.04.97 09.04.97 10.04.97 11.04.97 14.04.97 15.04.97 16.04.97 17.04.97 18.04.97 21.04.97 22.04.97 23.04.97 24.04.97 25.04.97 28.04.97 29.04.97 30.04.97 01.05.97 02.05.97 05.05.97 06.05.97 07.05.97 08.05.97 09.05.97 12.05.97 13.05.97 14.05.97 15.05.97 16.05.97 19.05.97 20.05.97 21.05.97 22.05.97 23.05.97 26.05.97 27.05.97 28.05.97 29.05.97 30.05.97
2.50 2.50 2.50 2.50 2.50 2.50 2.50 2.50 2.50 2.50 2.50 2.50 2.50
RATES AT THE END OF:
3.20 4.45 3.20 3.25 3.80 3.80 2.50 4.50 3.30 3.10 17.50 21.00 26.00 7.50 7.60 3.20 4.45 3.20 3.25 3.70 3.70 2.50 4.50 3.30 3.10 17.50 21.00 26.00 7.25 7.35 3.20 4.45 3.20 3.25 3.70 3.70 2.50 4.50 3.30 3.10 17.50 21.00 26.00 7.25 7.35 3.00 4.25 3.00 3.25 3.50 3.50 2.50 4.50 3.00 3.10 17.50 21.00 26.00 7.25 7.35 3.00 4.25 300 3.25 3.50 3.50 2.50 4.50 3.00 3.10 17.50 21.00 26.00 7.25 7.35 3.00 4.25 3.00 3.25 3.50 3.50 2.50 4.50 3.00 3.10 17.50 21.00 26.00 6.75 6.85 3.00 4.25 3.00 3.25 3.50 3.50 2.50 4.50 3.00 3.10 17.50 21.00 26.00 6.75 6.85 3.00 4.25 3.00 3.25 3.50 3.50 2.50 4.50 3.00 3.10 16.50 21.00 25.00 6.25 6.35 3.00 4.25 3.00 3.25 3.50 3.50 2.50 4.50 3.00 3.10 16.50 21.00 25.00 6.00 6.10 3.00 4.25 3.00 3.25 3.50 3.50 2.50 4.50 3.00 3.10 15.50 20.00 25.00 6.00 6.10 3.00 4.25 3.00 3.25 3.50 3.50 2.50 4.50 3.00 3.10 15.50 20.00 25.00 5.75 5.75 3.00 4.25 3.00 3.25 3.50 3.50 2.50 4.50 3.00 3.10 15.50 20.00 25.00 5.50 5.60 3.00 4.25 3.00 3.25 3.50 3.50 2.50 4.50 3.00 3.10 14.50 19.00 24.00 5.25 5.30
RECENT ACTUAL CHANGES
5.85 5.50 5.60
14.50 19.00 24.00
5.65
5.25 5.30
TABLE X
CENTRAL BANK INTEREST RATES
~~F~ ___ IR_L __ ~--~--~--~--~--..~NL---...~--~----A--~--~--~---P~. --~---~--~
AUCT REPO STF DR LR REPO R-REPO AR SPR LR DR LR REPO PR R SFR DR R DRO PRO eurostat
RATES AT THE END OF:
3.70 4.90 6.25 9.00 10.50 9.38
-
2.00 2.60-
2.50 4.75 3.50 7.500 9.00 6.80 6.800 7.500 05/96 3.60 4.90 6.25 9.00 10.50 8.75-
2.00 2.60 - 2.50 4.75 3.50 7.500 9.00 6.80 6.800 7.500 06/96 3.55 4.90 6.25 8.25 9.75 8.70 2.00 2.70-
2.50 4.75 3.50 7.500 9.00 6.80 6.800 7.500 07/96 3.35 4.75 6.25 8.25 9.75 8.58 2.00 2.50 2.50 4.75 3.50 7.500 9.00 6.80 6.800 7.500 08/96 3.25 4.75 6.25 8.25 9.75 8.22 2.00 2.50-
2.50 4.75 3.40 7.250 9.00 6.80 6.800 7.250 09/96 3.25 4.75 6.25 7.50 9.00 8.22 8.61 2.00 2.50 2.50 4.75 3.40 7.000 9.00 6.80 6.800 7.000 10/96 3.20 4.75 6.25 7.50 9.00 8.01 8.08 2.00 2.50 2.50 4.75 3.40 6.900 8.50 6.40 6.400 6.900 11/96 3.15 4.60 6.25 7.50 9.00 7.05-
2.00 2.50 2.50 4.75 3.40 6.700 8.30 6.20 6.200 6.704 12/96 3.10 4.60 6.25 6.75 8.25 7.21-
2.00 2.50 2.50 4.75 3.40 6.500 8.30 6.20 6.200 6.500 01/97 3.10 4.60 6.25 6.75 8.25 7.35 - 2.00 2.70 2.50 4.75 3.40 6.500 8.30 6.20 6.200 6.500 02/97 3.10 4.60 6.25 6.75 8.25 7.34 2.50 2.90-
2.50 4.75 3.40 6.520 8.30 6.20 6.200 6.500 03/97 3.10 4.60 6.25 6.75 8.25 7.09 2.50 2.90 2.50 4.75 3.40 6.300 7.80 5.80 5.800 6.300 04/97 3.10 4.60 6.75 6.75 8.25 6.77 2.50 2.90 4.50 2.50 4.75 3.40 6.000 7.70 5.70 5.700 6.000 05/97RECENT ACTUAL CHANGES
01.04.97 02.04.97 03.04.97 04.04.97 07.04.97 08.04.97 09.04.97 10.04.97
7.41 11.04.97
7.80 5.80 14.04.97
7.22 5.800 15.04.97
16.04.97 17.04.97 18.04.97 21.04.97 22.04.97
7.08 23.04.97
6.316 24.04.97 25.04.97
7.09 6.300 28.04.97
6.300 29.04.97 30.04.97 01.05.97
6.75 02.05.97
6.99 05.05.97
06.05.97 07.05.97 08.05.97 09.05.97 6.000 7.70 5.70 12.05.97
7.29 5.700 13.05.97
14.05.97 15.05.97 16.05.97
6.78 19.05.97
20.05.97 21.05.97 6.014 22.05.97
4.50 6.000 23.05.97
6.77 26.05.97
27.05.97 28.05.97 29.05.97 30.05.97
TABLEX
CENTRAL BANK INTEREST RATES
[3!L)
eurostat 05/96 06/96 07/96 08/96 09/96 10/96 11/96 12/96 01/97 02/97 03/97 04/97 05/97 01.04.97 02.04.97 03.04.97 04.04.97 07.04.97 08.04.97 09.04.97 10.04.97 11.04.97 14.04.97 15.04.97 16.04.97 17.04.97 18.04.97 21.04.97 22.04.97 23.04.97 24.04.97 25.04.97 28.04.97 29.04.97 30.04.97 01.05.97 02.05.97 05.05.97 06.05.97 07.05.97 08.05.97 09.05.97 12.05.97 13.05.97 14.05.97 15.05.97 16.05.97 19.05.97 20.05.97 21.05.97 22.05.97 23.05.97 26.05.97 27.05.97 28.05.97 29.05.97 30.05.97 BR 4.50 4.50 4.50 4.50 4.00 4.00 4.00 4.00 4.00 4.00 4.00 4.00 4.00FIN
s
UK
ISTR AR DR AR REPO IBR BR DR REPO CD RATES AT THE END OF:
3.75 5.75 5.50 7.50 6.50 7.75 6.00 5.60 6.50 4.40
3.60 5.60 5.50 6.75 6.10 7.25 5.75 5.60 6.50 4.40
3.50 5.50 4.50 6.75 5.55 7.25 5.75 5.60 6.50 4.40
3.25 5.25 4.50 6.25 5.25 7.25 5.75 5.60 6.50 4.40
3.10 5.10 4.50 6.25 5.05 6.95 5.75 5.60 6.90 5.70
3.00 5.00 3.50 5.75 4.60 6.05 6.00 6.00 6.90 5.70
3.00 5.00 3.50 5.75 4.35 6.05 6.00 6.00 6.90 5.70
3.00 5.00 3.50 5.25 4.10 6.05 6.00 6.00 6.90 5.70
3.00 5.00 2.50 5.25 4.10 5.26 6.00 6.50 6.90 6.60
3.00 5.00 2.50 5.25 4.10 5.47 6.00 6.50 6.90 6.60
3.00 5.00 2.50 5.25 4.10 5.58 6.00 6.50 6.90 6.60
3.00 5.00 2.50 5.25 4.10 6.04 6.00 6.50 6.90 6.60
3.00 5.00 2.50 5.25 4.10 6.04 6.25 6.50 6.90 6.60
RECENT ACTUAL CHANGES
6.04
6.25
N AR
6.50 6.50 6.50 6.50 6.50 6.50 6.00 6.00 5.25 5.25 5.25 5.25 5.25
CH DR LR
1.50 1.50 1.50 1.50 1.00 1.00 1.00 1.00 1.00 1.00 1.00 1.00 1.00 4.875 5.125 4.625 4.000 3.500 3.750 4.000 5.250 3.875 3.750 4.375 3.750 2.875 3.875
4.000 3.875 3.750 3.625 3.500 3.375 3.500 3.375
3.500
3.750
3.500
3.625
3.500
3.375 3.250 3.000 2.875
US JAP DR FED DR
5.00 5.25 0.50 5.00 5.25 0.50 5.00 5.25 0.50 5.00 5.25 0.50 5.00 5.25 0.50 5.00 5.25 0.50 5.00 5.25 0.50 5.00 5.25 0.50 5.00 5.25 0.50 5.00 5.25 0.50 5.00 5.50 0.50 5.00 5.50 0.50 5.00 5.50 0.50
EVOLUTION OF CENTRAL BANK INTEREST RATES OVER THE LAST 12 MONTHS
[3?Zj
eurostat
10
@)
1
· .
"
~:
I
10
~
D7 7
4 4
3.6.96 1.10.96 30.1.97 30.5.97 3.6.96 1.10.96 30.1.97 30.5.97
- D R I - D R LR --OR I
- - L R
·Repo L
L
3.6.96 1.10.96 30.1.97 30.5.97
3.6.96 1.10.96 30.1.97 30.5.97
10
1-Repol
- · -AR
7
4
3.6.96 1.10.96 30.1.97 30.5.97 3.6.96 1.10.96 30.1.97 30.5.97
10
[-STF[
7
4
3
1 ~~~~~~~~~~~~~~~~~
3.6.96 1.10.96 30.1.97 30.5.97 3.6.96 1.10.96 30.1.97 30.5.97
10
- D R - - L R
7 7 Re po
4 4
1 ~~~~~~~~~~~~~~~~~
EVOLUTION OF CENTRAL BANK INTEREST RATES OVER THE LAST 12 MONTHS
[3?B
eurostat
~ .. ,,, .. ,
,·~·~.-3.6.96 1.10.96
3.6.96 1.10.96
10
@l
\
--
Repo I7
4
3.6.96
1:
!
:1
3.6.96
10
8
6
4
2
0 3.6.96
lcHI
jJAPI
1.10.96
~
~
1.10.96
1-oRI
1.10.96
"'."'""'' .- ' .
---..,_____
\ _
30.1.97 30.5.97 3.6.96 1.10.96 30.1.97 30.5.97
10
El
1-sRI
7
4
1
30.1.97 30.5.97 3.6.96 1.10.96 30.1.97 30.5.97
10
~
J
-
ARI
7
4
30.1.97 30.5.97 3.6.96 1.10.96 30.1.97 30.5.97
4
1 ~~~~~~~~~~~~~~~~~
30.1.97 30.5.97 3.6.96 1.10.96 30.1.97 30.5.97
EXPLANATORY NOTES
Exchange rate grid (Table
I)
The intervention limit rates fixed in the official grid do not
correspond exactly to + or - 15 % of the central rates, since
for each currency pair (whose exchange rates are inversely proportional to one another) the lower limit of one corresponds to the upper limit of the other.
Bilateral fluctuations of the ERM currency (Graph 1 on page 5)
The daily market exchange rates of all currencies are compared with the relevant bilateral central rates and the differentials between the two calculated.
The graph is divided symmetrically by a horizontal axis along which the points would be plotted if all currencies were at their bilateral central rate and there were therefore no fluctuations.
The curves are drawn by linking the daily points showing the relative positions of each currency. These should be compared in pairs. To find the differential between two currencies, subtract the (positive or negative) values along the y-axis corresponding to each currency.
The graph is drawn with the curve of the stronger currency above that of the weaker. It shows therefore the relative position of each currency vis-a-vis the other currencies.
When two curves intersect or merge over a period of time there is no differential between the two currencies and their market exchange rate equals their bilateral central rate.
The maximum spread recorded between two currencies is signified by the band, symmetrical with the horizontal axis. The fluctuations of the other currencies in relation to either of the two currencies in question are shown within the maximum spread.
The divergence indicator (Graph 2 on page 5)
The divergence indicator (DI) measures the degree of movement of a specific EMS currency against its maximum divergence spread. In effect, the DI is a mechanism which detects the EMS currencies that deviate upwards or downwards from the Community average as represented by the ECU.
For a given currency the divergence indicator is obtained:
(i) first by calculating the appreciation or depreciation of the market rate of the ECU in terms of that currency against its ECU-related central rate;
(ii) and then by comparing the result obtained with the maximum divergence spread (MOS), which is the intervention limit, corrected by the weight of each currency in the basket in such a way that an increase in the weight of a currency reduces its maximum divergence spread.
Explanatory notes
In order to permit a comparison of movements in the divergence indicators for each of the EMS currencies, the MOS is expressed as an index number ranging between
+/-100. At an absolute index number of 75, a currency
reaches its divergence threshold. When a currency crosses
its "threshold of divergence", this results in a presumption
that the authorities concerned will correct this situation by taking adequate measures.
ECU exchange rates (Table II)
The exchange rates for the ECU against the national currencies of the member states of the Community, the USO and yen are shown as annual averages, monthly averages (for the current year), and daily rates (for the latest available month).
Consumer price indices in national currency (Table
Ill)
The consumer price indices in the national currency of each country measure changes in the purchasing power of one unit of national currency spent in the country concerned.
Two composite indices are calculated, covering all the member states of the Community (EUR 15) and the 12 member states whose currencies participate in the European Monetary System exchange rate mechanism (ERM). (Although the peseta has been participating in the exchange rate mechanism since 19/06/89 and has been included in the calculation of the ECU since 21/09/89, it is only taken into account in the indices relating to the ERM which are included in this bulletin for data after 30/09/89).
These indices are calculated as weighted arithmetic means (chain indices) of the national indices, the weighting for each member state being its relative share in the final consumption of households of the group of countries in question (EUR 15, ERM), expressed in purchasing power standards, at current prices and purchasing power parities.
Consumer price indices in ECUs (Table IV)
For each country the index of consumer prices in ECUs is calculated by multiplying the national consumer price index by the average movement of the national currency in relation to the ECU during the month. It measures the change in the purchasing power of one ECU in the country concerned.
Three composite indices are calculated, the first covering all the member states of the Community (EUR 15), the second
covering 12 member states whose currencies participate in
ECU-EMS Information and central bank interest rates
calculation of the ECU since 21/09/89, it is only taken into account in the indices relating to the ERM which are included in this bulletin for data after 30/09/89).
These three indices are calculated as weighted arithmetic means (chain indices). The weightings are defined as follows: for the EUR 15 and ERM indices, the relative share of each member state in the finai consumption of households for the group of countries in question (EUR 15 or ERM), expressed in ECUs at current prices and exchange rates (annual weighting). For the ECU index, the relative share of each member state's currency in the calculation of the ECU (monthly weighting).
ECU bond issues (Tables V &
VI)
In table V, issues are recorded as at the payment date. This bulletin covers ECU issues in the Eurobond market, which includes international and foreign issues and domestic
issues which can be assimilated with Eurobond issues. More specifically, the domestic issues should be free of withholding tax in the hands of non-residents and subject to similar Clearing and settlement procedures. This includes ECU issues offering the option of conversion into other currencies. Main source: International Financing Review.
Table V shows, under the headings:
Business sector and Governments: national issuers, both private and public.
Institutions: the European Investment Bank and the Commission of the European Communities (EEC, ECSC, Euratom).
Organizations: the specialist institutions of the United Nations, the World Bank, the Council of Europe, etc ....
Table VI shows detailed information on the latest known issues, irrespective of the payment date.
Outstanding amount of ECU bonds (Table
VII)
This table shows the bonds in ECUs outstanding at the end of the last three months and at the end of the last three years. These statistics are taken from a particularly comprehensive database and measure the volume of ECU bonds in circulation. The overall figure is broken down in two ways -by residual maturity and by type of issuer.
Total of the secondary market turnover and
%
of market taken by ECU securities (TableVIII)
This table shows the volume of transactions on securities conducted by the international clearing houses Cedel and Euroclear. The market shares of the various types of instrument are calculated. These statistics do not cover all
transactions throughout the world, since internal movements are not included. They do, however, give a realistic idea of market developments.
Interest rates and yields on ECU investments (Table IX}
The interest rates for 1, 3, 6 and 12 months deposits are calculated on the basis of the London market rates LIBID as follows:
until October 1993: source: Financial Times, Friday rate.
from November 1993: source : Bank of England, British Banker's Association, daily rates.
The yields of ECU bonds at 1 - 1 O years are those provided by Eurostat's yield curve. These are redemption yields. Eurostat's yield curve, which portrays the interest rate structure of maturities ranging from 1 to 10 years, is based on highest quality issues with a triple-A rating of at least ECU 500 million outstanding, with a very high liquidity (bid-offer spread less than 50 basis points). The curve is calculated daily by fitting a third order polynomial function by regression to the price/yield values of bonds provided by ISMA (International Securities Market Association, London). These values reflect the mean of bid and offer prices communicated by a comprehensive range of financial institutions. The monthly figures included in the table are the arithmetic average of daily figures and the yearly figures are the arithmetic average of daily figures.
Operation rates of the EMI (Table IX)
The interest rate for transactions of the EMI (European Monetary Institute) in ECUs is the weighted average of the most representative rates on the domestic money market of the countries wh9se currencies make up the ECU basket. It is based on the weighting of the currencies in the ECU basket as derived from the ECU central rates in force. The rate thus calculated for a given month applies to EMI transactions for the following month. In table VII, this rate relates to the month upon which the calculations are based and not to the (following) month during which it is used by the EMI.
ECU yield curve