Accepted Manuscript
Accurate quantification of modified cyclic peptides without the need for authentic standards
Rosemary I. Adaba, Greg Mann, Andrea Raab, Wael E. Houssen, Andrew R. McEwan, Louise Thomas, Jioji Tabudravu, James H. Naismith, Marcel Jaspars
PII: S0040-4020(16)31195-4
DOI: 10.1016/j.tet.2016.11.040
Reference: TET 28254
To appear in: Tetrahedron
Received Date: 4 September 2016 Revised Date: 31 October 2016 Accepted Date: 14 November 2016
Please cite this article as: Adaba RI, Mann G, Raab A, Houssen WE, McEwan AR, Thomas L, Tabudravu J, Naismith JH, Jaspars M, Accurate quantification of modified cyclic peptides without the need for authentic standards, Tetrahedron (2016), doi: 10.1016/j.tet.2016.11.040.
M
AN
US
CR
IP
T
AC
CE
PT
ED
ACCEPTED MANUSCRIPT
Graphical Abstract
∗
———
∗ Corresponding author. Tel.:
+44 (0)1224 272943; fax: +44 (0)1224 272921; e-mail:[email protected]
Accurate quantification of modified cyclic
peptides without the need for authentic standards
Rosemary I. Adaba
a, Greg Mann
b, Andrea Raab
c, Wael E. Houssen
a,d,e, Andrew R. McEwan
a,d, Louise Thomas
a,d
, Jioji Tabudravu
a, James H. Naismith
band Marcel Jaspars
∗aa
Marine Biodiscovery Centre, Department of Chemistry, University of Aberdeen, Meston Walk, Aberdeen. AB24
3UE, UK.
bBiomedical Sciences Research Complex, University of St Andrews, North Haugh, St Andrews, Fife
KY16 9ST, UK.
cTESLA, Department of Chemistry, University of Aberdeen, UK.
dInstitute of Medical Sciences,
University of Aberdeen, Aberdeen AB25 2ZD, UK.
ePharmacognosy Department, Faculty of Pharmacy,
Mansoura University, Mansoura 35516, Egypt.
M
AN
US
CR
IP
T
AC
CE
PT
ED
ACCEPTED MANUSCRIPT
Tetrahedron
j o u r n a l h o m e p a g e : w w w . e l s e v i e r . c o m
Accurate quantification of modified cyclic peptides without the need for authentic
standards.
Rosemary I. Adaba
a, Greg Mann
b, Andrea Raab
c, Wael E. Houssen
a,d,e, Andrew R. McEwan
a,d, Louise
Thomas
a,d, Jioji Tabudravu
a, James H. Naismith
band Marcel Jaspars
∗a.
aMarine Biodiscovery Centre, Department of Chemistry, University of Aberdeen, Meston Walk, Aberdeen. AB24 3UE, UK bBiomedical Sciences Research Complex, University of St Andrews, North Haugh, St Andrews, Fife KY16 9ST, UK cTESLA, Department of Chemistry, University of Aberdeen, UK
dInstitute of Medical Sciences, University of Aberdeen, Aberdeen AB25 2ZD, UK
ePharmacognosy Department, Faculty of Pharmacy, Mansoura University, Mansoura 35516, Egypt.
———
∗ Corresponding author: Marine Biodiscovery Centre, Department of Chemistry, University of Aberdeen, Meston Walk, Aberdeen. AB24 3UE,
UK
E-mail: [email protected]
A R T I C L E I N F O A B S T R A C T
Article history:
Received
Received in revised form Accepted
Available online
There is a growing interest in the use of cyclic peptides as therapeutics, but their efficient production is often the bottleneck in taking them forward in the development pipeline. We have recently developed a method to synthesise azole-containing cyclic peptides using enzymes derived from different cyanobactin biosynthetic pathways. Accurate quantification is crucial for calculation of the reaction yield and for the downstream biological testing of the products. In this study, we demonstrate the development and validation of two methods to accurately quantify these compounds in the reaction mixture and after purification. The first method involves the use of a HPLC coupled in parallel to an ESMS and an ICPMS, hence correlating the calculated sulfur content to the amount of cyclic peptide. The second method is an NMR ERETIC method for quantifying the solution concentration of cyclic peptides. These methods make the quantification of new compounds much easier as there is no need for the use of authentic standards when they are not available.
2016 Elsevier Ltd. All rights reserved.
Keywords:
Cyclic peptide LC-MS ICP-MS NMR
Quantification without authentic standards Cyanobacteria
M
AN
US
CR
IP
T
AC
CE
PT
ED
ACCEPTED MANUSCRIPT
Tetrahedron
2
1.Introduction
The growing application of peptides in drug discovery necessitates their accurate quantification in order to obtain the right metabolic, enzymatic, kinetic and pharmacokinetic data.1-6 Several methods for peptide quantification have been reported to date, these include liquid chromatography combined with ultraviolet (UV) or fluorescence detection, capillary electrophoresis with UV detection, matrix-assisted laser-desorption/ionization mass spectrometry (MALDI-MS), surface-enhanced laser desorption/ionization (SELDI),6-12 liquid chromatography- mass spectrometry (LC-MS),7,8 inductively coupled plasma mass spectrometry (ICP-MS)13-14 and quantitative nuclear magnetic resonance (qNMR).9
Limitations of these techniques for quantification of peptides vary by technique. Matrix effects limit optical techniques such as UV and fluorescence detection.7,8 Different mass spectrometric methods suffer from different problems. Matrix-assisted laser desorption/ionization–time of flight mass spectrometry (MALDI-TOF) and electrospray ionisation (ESMS) techniques both suffer drawbacks such as differential response of proteins and peptides depending on size, hydrophobicity, matrix, or solvents.10 At low mass resolution, LC-MS data has a limited accuracy for reported intensity of the extracted ion currents due to contamination by nearby peptide signals, thereby affecting accurate quantification.11,12 For quantification purposes, it is necessary to address these issues in particular ionisation efficiency and matrix effects when using an ESMS or MALDI-MS direct measurements. For this reason various sample treatments for MS-based quantification are reported in the literature for peptides including; isotope-coded affinity tag reagents (ICATs),13-15 isotope-coded protein labelling (ICPL),16-18 stable isotope labelling by amino acid in cell culture (SILAC),19-21 isotope-differentiated binding energy shift tag (IDBEST), chemical labelling, isobaric tagging (iTRAQ, TMT),22,23 and absolute quantification with the use of synthetic labelled peptides (AQUA),24,25 These methods require additional sample preparation and cost.
ICP-MS is a sensitive analytical tool for elemental analysis with advantages of having species independence and high ionization efficiency for most elements in the periodic table, high sensitivity of parts per billion to parts per trillion levels, together with affordable isotope distribution information.26-27 For these reasons it has become a significant and complementary technique in bioanalysis for the determination of biomolecules and quantification of therapeutic agents.28-36 Application of ICPMS allows the quantification of elements independent of their molecular form, hence the analyte retains its original form during quantification. Coupled with molecular information obtained from ESI-MS or MALDI enables the compound identification simultaneously with its quantification. Sulphur has been successfully used for the quantification of proteins and peptide in biological samples by coupling the ICP-MS to different chromatographic systems.37-40
NMR produces a signal for any species that will have an area that is proportional to its concentration.40 Complex mixtures can be analyzed by NMR which provides the concentration of the chemical components in a mixture, hence allowing quantification of species for metabolomic and related studies.41-42 Proton NMR quantification (qNMR) by ERETIC is a non-destructive and rapid way of providing accurate analyte concentrations43 by using an indirect internal reference signal that represents a known concentration. This averts the need to determine a compound-specific response factor,44 making qNMR an accurate and straightforward technique for quantification. The drawbacks to
this method are that it requires relatively pure samples of large size that would allow sufficient signal to noise ratio (>150:1)9 and an internal certified reference material.
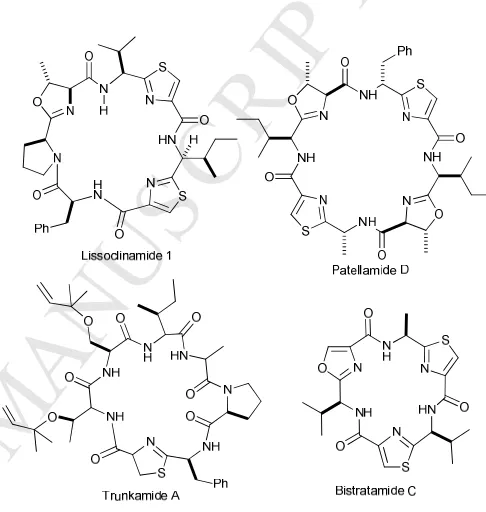
[image:4.595.307.550.205.461.2]Cyclic peptides show promise in many therapeutic areas, particularly in complex diseases such as auto-immune disorders.45 Cyanobactins are a family of modified cyclic peptides that have interesting structural features including heterocycles, epimerized stereocentres and prenylated residues (Figure 1).46 Some of these modifications lead to better target affinity by constraining conformational flexibility, while others increase cellular permeability.47,48 Members of cyanobactins are known to reverse multi drug resistance in human lymphoblasts by inhibiting the P-glycoprotein (Pgp) drug efflux pump.49-51
Figure 1: Structures of some modified cyclic peptides in the cyanobactin
family showing heterocycles, epimerized stereocentres and prenylated residues in trunkamide A.
Patellamides are the most studied members of the cyanobactins. They were originally isolated from extracts of the Indo-Pacific ascidian Lissoclinum patella, but shown later to be produced by its cyanobacterial symbiont Prochloron sp..52,53 Genomicstudies of Prochloron sp.delineated the gene cluster for the biosynthesis that directs the production of the patellamides.
54-59
Their biosynthesis occurs via the production of a ribosomally encoded precursor peptide, in which a core peptide sequence is modified by a series of processing enzymes.52,61-64 We recently used these enzymes in vitro to generate natural and non-natural cyanobactins in milligram quantities.61 Accurate quantification of the reaction products is essential to calculate yields before and after purification and for their downstream biological screening but is challenging due to the lack of authentic standards.
M
AN
US
CR
IP
T
AC
CE
PT
ED
ACCEPTED MANUSCRIPT
compounds from chemoenzymatic reaction mixtures andidentified the most efficient extraction and purification strategy. While the second method describes an alternative quantification method using NMR and an ERETIC (electronic reference to access in vivo concentrations) reference for the quantification of non- sulfur containing cyclic peptides. ERETIC qNMR enabled us to obtain the concentration and identity of these new compounds simultaneously.
2.Results and Discussion
2.1.Verification of sulfur quantification by HPLC
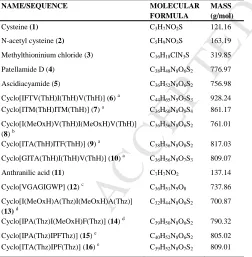
Two sulfur containing compounds 1 and 2 (Table 1, SI Scheme 1) were used as calibration standards. The accuracy of the method was verified using, a known drug molecule containing sulfur; methylthioninium chloride 3, commercially available sulfate standard solution and three certified reference materials (CRMs): RM8415 (whole egg powder); BCR-062 (olive leaves) and seronorm (trace elements in urine blank) whose total sulfur contents are known were analysed. The detection limits for sulfur by HPLC ranged from 1.00 to 2.03 x 10⁻⁴ mg/mL using either compound 1 or 2 as standard, with a correlation coefficient > 0.99. There was no statistically significant difference in the results using either compound 1 or 2 for quantification of sulfur in the samples. Recovery of sulfur in the three certified reference materials was 101 ± 8 % and compound 3 was 78 ± 2 % (Table 2). The sulfur content of the HPLC calibration standards (1 and
2) was within the calculated range (± 3 %) allowing their use as
[image:5.595.37.289.433.690.2]standards in HPLC-ICPMS/ESMS.
Table 1: Names of compounds studied with their molecular
formula and molecular masses in g/mol.
NAME/SEQUENCE MOLECULAR FORMULA
MASS (g/mol)
Cysteine (1) C3H7NO2S 121.16
N-acetyl cysteine (2) C5H9NO3S 163.19
Methylthioninium chloride (3) C16H18ClN3S 319.85
Patellamide D (4) C38H48N8O6S2 776.97
Ascidiacyamide (5) C36H52N8O6S2 756.98
Cyclo[IFTV(ThH)I(ThH)V(ThH)] (6) a C44H65N9O7S3 928.24 Cyclo[ITM(ThH)ITM(ThH)] (7) a C36H60N8O8S4 861.17
Cyclo[I(MeOxH)V(ThH)I(MeOxH)V(ThH)] (8) b
C36H56N8O6S2 761.01
Cyclo[ITA(ThH)ITF(ThH)] (9) a C38H56N8O8S2 817.03
Cyclo[GITA(ThH)I(ThH)V(ThH)] (10) a C36H56N8O7S3 809.07
Anthranilic acid (11) C7H7NO2 137.14
Cyclo[VGAGIGWP] (12) c C36H51N9O8 737.86
Cyclo[I(MeOxH)A(Thz)I(MeOxH)A(Thz)] (13) d
C32H44N8O6S2 700.87
Cyclo[IPA(Thz)I(MeOxH)F(Thz)] (14) d C39H50N8O6S2 790.32
Cyclo[IPA(Thz)IPFThz)] (15) e C40H52N8O6S2 805.02 Cyclo[ITA(Thz)IPF(Thz)] (16) e C39H52N8O7S2 809.01
Modified cyclic peptides prepared from the corresponding linear peptides by processing with: aTruD heterocyclase, which converts Cys to thiazoline, followed by
PatGmac; bPatD heterocyclase, which converts Cys, Ser, Thr to thiazoline, oxazoline and
methyl oxaxoline respectively, followed by PatGmac, cMacrocylicization by PatGmac, dMicD heterocyclase, which converts Cys to thiazoline, Thr to methyl oxaxoline,
followed by PatGmac, followed ArtGox and eLynD heterocyclase, which converts Cys to thiazoline, followed by PatGmac and ArtGox.
Quantification of compound 3 gave a recovery of 75 ± 3 % (Table 2) of the theoretical value which is similar to the value achieved during total sulfur determination. This indicates that there was no loss of compound 3 on the column, that the standards used for quantification and the methods used are of sufficient accuracy.
Table 2: Sulfur quantification results for the concentration of
compound 3 and certified reference materials in mg compound/g solution. Sample (n=3) Theoretical mg compound/g Found mg compound/g 3 1.41 1.34 ± 0.0439
Total S in CRM's Certified Value mg/kg
RM8451 5120 ± 500 4762 ± 54 BCR-062 1600 (indicative
value)
1588 ± 32 Seronorm urine 545 (513-577) 617 ± 123
2.2.Naturally occurring cyclic peptides
As a proof of concept, purified natural products 4 and 5 were obtained from an Australian collection of the seasquirt Lissoclinum patella. These natural products were subjected to HPLC-ICPMS/ESMS. The observed peaks for each sample in both positive mode ES-MS and ICP-MS were at the same retention time (tR) (Figure 2). Quantification of compound 4 [777 (M+H)+] with tR of 23.2 min (Figure 2A) revealed that the total solid mass of compound 4 in the analysed sample was between 29.0 to 30.8 % (Table 3). Compound 5 [757 (M+H)+] with a tR of 24.3 min (Figure 2B) had between 84 and 89 % total solid in the analysed sample (Table 3), using the developed method for quantification with compounds 1 or 2 as standard.
-1.5 -1 -0.5 0 0.5 1
0 5 10 15 20 25 30 35
R e la ti v e I n te n s it y
Retention Time (Mins)
ICP SULPHUR INTENSITY MS EIC @ 777
0 5 10 15 20 25 30 35 40
0 5 10 15 20 25 30 35
R e la ti v e I n te n s it y
Retention Time (Mins)
ICP SULPHUR INTENSITY
MS EIC @ 757
A
[image:5.595.310.556.472.764.2]M
AN
US
CR
IP
T
AC
CE
PT
ED
ACCEPTED MANUSCRIPT
Tetrahedron
4
Figure 2: Separation of compound 4 and 5 containing solids and
detection by ICPMS (red) and ESMS (blue), A) ICP-MS and extracted ion count (EIC) chromatograms of compound 4, B) ICP-MS and extracted ion count (EIC) chromatograms of compound 5.
2.3.Biosynthetic peptides
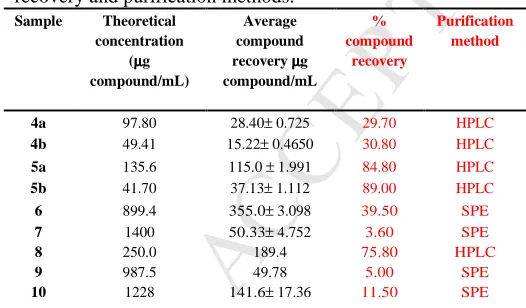
For HPLC-ICP-MS quantification, interferences were efficiently removed in the ICP-MS/MS with selection of dual m/z, for sulfur quantification, by measuring S, m/z 32 and 34 were obtained as 32S16O+ and 34S16O+ preventing m/z 48 and 50 interferences66. Cyclic peptides 6-10 were extracted from chemoenzymatic reaction mixtures using SPE and subsequently identified and quantified by HPLC-ICPMS/ESMS. Solutions of samples 3 to 10 for species quantification were injected in triplicate and results are given as mean ± SD except 8 and 9 (Table 3). These samples showed the presence of the respective peptides at different tRs (Figure S1- S5i in Supporting Information) the sulfur peak areas at each tRs for each compound was used for their individual quantification. Quantification results of the samples revealed that compound 6 and 7 contained 39.5 % and 3.60 %, of the desired peptides respectively, while compound 8 contributed 75.8 % to the analysed fraction, 5.0 % of compound 9 was present in the analysed sample and compound 10 contained 11.5 % of the peptide. RP-SPE method is useful for desalting and fractionation for compound before quantification, however data show that the estimated weight of samples was influenced by significant amounts of non-targeted compounds (data not shown) may be the reason for observed low concentrations for 6, 7, 9 and 10 after quantification, compared to the data obtained for 8, which was purified by HPLC. Recent studies by Møller et al67 for peptides in human plasma and Hermann et al.68 report for S-containing proteins shows the applicability of this method for accurate quantification of peptides.
Table 3: Theoretical concentration of samples, average
amount of compounds recovered after quantification by sulfur for compounds 4, 5, 6, 7, 8, 9 and 10 in µg/m, % compound recovery and purification methods.
Sample Theoretical concentration
(µµµµg compound/mL)
Average compound recovery µµµµg compound/mL
% compound
recovery
Purification method
4a 97.80 28.40± 0.725 29.70 HPLC
4b 49.41 15.22± 0.4650 30.80 HPLC
5a 135.6 115.0 ± 1.991 84.80 HPLC
5b 41.70 37.13± 1.112 89.00 HPLC
6 899.4 355.0± 3.098 39.50 SPE
7 1400 50.33± 4.752 3.60 SPE
8 250.0 189.4 75.80 HPLC
9 987.5 49.78 5.00 SPE
10 1228 141.6± 17.36 11.50 SPE
a and b are different concentrations for each sample.
2.4.Comparison of Extraction Methods
Quantification of samples obtained using various extraction methods for compound 10 revealed that reverse phase solid phase extraction RP-SPE gave optimum compound recovery and purity
(Table 4). The protein concentrator and crude sample showed
more peaks at retention times before 5 min due to high concentration of inorganic sulfate (Figure S7). This confirms the need for SPE in sample preparation of target compounds/
analytes,69,70 as it increases the recovery of the compounds by removing the salts from the reaction buffer by selective isolation/fractionation of the cyclic peptides from the reaction mixture. This is consistent with work carried out by Loroch et al. using RP-SPE for phosphopeptide fractionation71. The protein concentrator fractions also showed the presence of other non-identified sulfur containing compounds, which eluted through the filter with the compound of interest as the filter does not selectively isolate the apolar cyclic peptides from the more polar linear peptides, in contrast to the SPE process, hence reducing the percentage purity of the extract. We also observed that the 70 Å SPE cartridge with a smaller pore size had a higher sample yield for our compounds in comparison to the 125 Å SPE cartridge.
Table 4: Sample total dry weight, percentage purity and yield
for each extraction method applied to compound 10 based on enrichment factor.
Sample Sample total dry
weight (mg)
Ratio of compound/total
solid
% purity % compound
recovery
Crude 0.30 0.13 0.046±0.0072 SPE_125Å 0.031 0.082 8.5±2.5 10
SPE_70Å 0.059 0.099 14 ±3.2 19
Supernatant 0.054 0.12 1.8±0.21 18
Filtrate 0.18 0.18 0.28±0.15 61
2.5.Verification of quantification by NMR
Compound 11 was used as an external reference material for calculating the ERETIC concentration of cyclic peptides (Table 5). Validation of this method for our system was achieved by comparing the calculated ERETIC concentration to that obtained by UV-absorbance at 280nm. A 500µL DMSO-d6 solution of 12 gave a theoretical concentration of 13 mM, equating to 5.1 mg of
12 by UV. A qNMR spectrum of 11 was recorded and one of the
benzyl-hydrogen peaks was integrated, set to 10 mM and used for the ERETIC reference. Compound 12 was diluted to 600µL and qNMR spectrum was recorded. The distinct indole nitrogen peak was integrated, and its value compared to that of the ERETIC reference which gave a concentration of 13 mM, which corresponded to a total of 5.1 mg of 12 (see Figure S7 for 1H NMR spectra). The total solid amount of 12 determined via UV absorbance and ERETIC quantification were with 5.06 and 5.08 mg respectively similar, thus showing that qNMR can be used to accurately determine the total solid in a purified cyclic peptide.
2.6.Peptide Quantification by NMR
[image:6.595.31.294.497.651.2]M
AN
US
CR
IP
T
AC
CE
PT
ED
ACCEPTED MANUSCRIPT
Table 5: Weighed mass sample, concentration of compound
and % compound obtained after qNMR quantification with their respective unit.
Sample Weighed mass of sample (mg)
Experimental mass of compound
(mg)
% compound
recovery
4 5.70 5.67 99
5 8.10 6.05 75
13 1.50 0.31 21
14 4.97 1.69 34
15 1.60 0.30 19
16 5.40 0.54 33
3.Conclusion
The samples batch containing 4 and 5 for the respective ICP-MS and qNMR quantification were different. A low compound recovery for 4 in the ICPMS quantification compared to the NMR method was attributed to the presence of other unidentified compound(s) which added to the weight of the purified compound used for analysis; assuming that ionization efficiency was equal, on calculation of the extracted ion peak area with the m/z for 4 used for each quantification method, the ICPMS sample had only 48 % while the NMR sample had 87 % of the compound mass. This may be the reason for the difference in quantification observed.
Accurate quantification of natural and non-natural modified cyclic peptides at various stages of purification by HPLC-ICPMS/ESMS and 1H qNMR spectroscopic without the use of authentic standards is possible using these methods. Whereas the ICPMS method would be suitable for very small sample sizes with low purity and compounds containing a target element, the NMR method requires larger sample size and higher purity. Our data shows that these quantification methods can be applied to new compounds without authentic standards as they are not species specific but rely on elemental constitution of each compound. Application of these methods is possible for non-cyclic peptides as we were able to identify other organic and inorganic sulfur species using HPLC-ICPMS/ESMS. These methods also eliminate the drawbacks associated with quantification by only HPLC, UV or ESMS and polyatomic spectral interference associated with ICPMS sulfur quantification. Data obtained also show that sulfur quantification can be used to measure the purity of peptides and product yield using different extraction methods accurately from microgram to milligram quantity. ERETIC based proton qNMR can be used to quantify peptides in the presence or absence of heteroatoms.
4.Experimental
4.1.Materials / methods
4 . 1 . 1 . S a m p l e
Samples used for this work, listed in Table 1 include azole containing cyclic peptides isolated from Lissoclinum patella sourced from Davies Reef (the Great Barrier Reef), Australia, from a collection made in 2006, and analogues synthesised using recombinant biosynthetic enzymes using the method previously reported in Houssen et al.61
4 . 1 . 2 . R e a g e n t s a n d c h e m i c a l s
Milli-Q water (18 MΩcm, Millipore, Germany) was used throughout the experiments. HPLC-solvents of highest purity available (methanol, acetonitrile and trifluoroacetic acid) were obtained from Sigma Aldrich (UK), whereas formic acid (>95 % reagent grade) was obtained from Fluka, UK. Nitric acid (69 %, p.a.) and hydrogen peroxide (30 %, trace select) were obtained from Fisher (UK) and DMSO-d6 (99.8 % purity manufactured by Cambridge Isotope Laboratories, USA). Cysteine 1 and N-Acetylcysteine 2 used as sulfur standards were obtained from Sigma (UK) and anthranilic acid 11 used as ERETIC standard was >99.5 % purity from Sigma-Aldrich, UK. Sulfur standard (1g/L) for total sulfur determination, rhodium and gallium (1g/L) were obtained from High-Purity Standards (USA). Certified reference materials for total sulfur determination were RM8415 (Whole egg powder, NIST, USA), BCR-062 (olive leaves, IRMM Geel) and Seronorm Trace elements in urine blank (Sero, Norway) and the in-house material methylthioninium chloride 3.
4 . 1 . 3 . S t a n d a r d s f o r I C P M S
Standards for total sulfur determination were prepared in 2 % (v/v) nitric acid. Sulfur standards 1 and 2 for HPLC were prepared freshly each day by dissolution in water with a concentration range between 5 and 100 mg S/kg.
4 . 1 . 4 . M i c r o w a v e d i g e s t i o n f o r t o t a l S
For total sulfur determination in RM8415 and BCR-062 both materials were digested using an open microwave system (MARS5, CEM, USA) with 2 mL nitric acid and 1 mL hydrogen peroxide for 30 min at 95 oC. After cooling the samples were diluted with water to 2 % (v/v) nitric acid. Seronorm urine and compound 3 (dissolved in water) were diluted using 2 % (v/v) nitric acid before measurement. The HPLC standards were also acidified with nitric acid (final concentration 2 % v/v) for verification of sulphur concentration.
4 . 1 . 5 . S o l i d P h a s e E x t r a c t i o n ( S P E )
Two types of SPE cartridges with silica as the sorbent were used to extract the peptides from protein mixtures using a vacuum extraction manifold (Phenomenex Strata 1 g C8, 55 µm 70 Å and Waters Sep – Pak 1 g C8, 37 -55 µm 125 Å). Each cartridge was conditioned with 5 column volumes (CV) of methanol and 5 CV of water after which the sample was loaded, washed with equal volume of water and subsequently eluted with 10 CV of 50: 50 v/v water: methanol, 10 CV of 100 % methanol, 10 CV of 100 % acetonitrile and finally with 10 CV of 0.05 % trifluoroacetic acid in acetonitrile. The methanol and acetonitrile fractions were combined and concentrated under a stream of nitrogen. Residual dry sample was then weighed and reconstituted with methanol before use. Phenomenex Strata cartridges were used for extractions for all the samples studied while Waters Sep – Pak was used only for comparison of extraction method for compound 10.
[image:7.595.32.278.83.176.2]M
AN
US
CR
IP
T
AC
CE
PT
ED
ACCEPTED MANUSCRIPT
Tetrahedron
6
An aliquot of compound 10 enzymatic reaction mixture was divided into 12 vials containing 3.2 mL each, to allow triplicate measurements of each sample treatment method. The first set of three sample aliquots were extracted using Phenomenex strata 1 g; 70 Å C8 SPE, the methanol and acetonitrile eluates were then combined, concentrated, weighed and reconstituted in methanol for analysis, using the same treatment, the next set of samples was extracted using Waters 1 g; 125 Å C8 SPE column. The third set sample aliquots were transferred into 30 mL protein filters (protein concentrator MWCO 10,000 from GE Healthcare) and centrifuged at 2000 revolutions per minute (rpm) at 4 oC for 40 mins, the resulting filtrate was transferred into pre-weighed glass vials and the supernatants were transferred into 2 mL protein filters, and centrifuged for 30 mins at 2000 rpm the resulting filtrate was transferred into the initial filtrate, frozen and then freeze dried before re-weighing. The samples were then dissolved in Milli-Q water for analysis, the supernatants obtained after filtration using the 2 mL protein filter was transferred into a separate pre-weighed glass vials, frozen and then freeze dried before reweighing. This was then reconstituted in Milli-Q water. The last set of 3.2 mL sample aliquot crude sample was put in pre-weighed vials, frozen and freeze dried; sample weight was obtained before dissolving in Milli-Q water for analysis.
4 . 1 . 7 . 1H N M R Q u a n t i f i c a t i o n
Pure (95 %) 12 (5.6 mg) of was dissolved in 500 µL DMSO-d6. The concentration of 12 in solution was determined first by A280 using a theoretical extinction coefficient of 5500 M
-1
cm-1 as calculated by ExPASy ProtParam. A280 measurements were
performed on a NanoDrop ND-1000 spectrophotometer, which returned a concentration of 13 mM, equating to 5.1 mg of product. The solution was diluted to 600 µL and transferred to an NMR tube for qNMR and the spectrum recorded. A 1M solution of 11 was prepared in DMSO and subsequently diluted to 10 mM using DMSO-d6 before obtaining the qNMR spectrum. From this spectrum one of the well-defined and isolated benzyl-hydrogen peaks was integrated and set to 10 mM as an ERETIC reference. The concentration of 12 was calculated by integrating the well-defined and isolated indole nitrogen peak and comparing the value with that of the ERETIC reference. Synthetic peptides
13-16 were quantified using the same procedure, data were analysed
using TopSpin software (Bruker).
The dry mass of 4 and 5 weighed and dissolved in 800 µL of DMSO-d6, 99 mM stock solution of 11 in DMSO-d6 was prepared from which 50 mM and 20 mM were made up. Proton NMR was acquired for the standards and samples sequentially on the same day using 5 mm tubes. Data was analysed using qNMR on MestReNova software for compound quantification.
4.2.Instrumentation/Methods
4 . 2 . 1 . I C P M S ( t o t a l s u l p h u r d e t e r m i n a t i o n )
An Agilent 8800 (Agilent Technologies, USA) was used for total sulfur determination. The instrument was used in MS/MS-mode using oxygen as reaction gas. The general instrument parameters were optimized for robust plasma conditions using Ni-cones. Sulfur was measured in mass-shift mode on m/z 49 (33S-> 33S16O) and m/z 50 (34S -> 34S16O). Gallium (10µg/kg) was used as internal standard.
4 . 2 . 2 . P r e p a r a t i v e H P L C S e p a r a t i o n
Reverse phase liquid chromatographic separation was used for sample separation using an Agilent 1260 infinity HPLC system; each sample separation gradient was developed depending on the best separation chromatogram observed using a UV detector. Chromatographic methods are as shown in Table 6, methods A and B were used for the purification of Lissoclinum patella extract to obtain 4 and 5, while methods C and D were analytical methods used for HPLC-ICPMS/ESMS.
Table 6: LC separation gradient for the purification of
compound 7 and 8 (method A and B) and methods C and D used for quantification.
Instrument Parameter Method A preparative Method B preparative Method C Analytical Method D Analytical
Column Sunfire C18 10 µm 10 x 250 mm D
YMC-Pack pro C4, 3 µm 12 nm,
150 x 4.6 mm D
Agilent XBD- Eclipse C18,
4.6 x 150 mm D Poresize 5
µm
YMC-Pack Pro C4 150 x4.6 mmD, S-3 µm
Flowrate 1.5 mL/min 1.0 mL/min 0.9 mL/min 0.9 mL/min
Injection Volume
200 µL 100 µL 20 µL 20 µL
Column temperature
30 oC 30 oC 35 oC 35 oC
Solvent A milliQ water milliQ water 0.1 % (v/v) Formic acid in water
0.1 % (v/v) Formic acid in water Solvent B Acetonitrile Acetonitrile 0.1 % (v/v)
Formic acid in Methanol
0.1 % (v/v) Formic acid in Methanol Gradient 0- 20 min:
0 – 100 % B 20 – 32 min 100 % B
0- 25 min: 0 – 100 % B 20 – 32 min
100 % B
0 -25 min: 0 – 100 % B 25 – 35 min 100 % B
0 – 20 min: 10 – 100 %
B 20 - 25 min
100 % B
4 . 2 . 3 . H P L C - I C P M S / E S M S
An Agilent 1100 HPLC system consisting of cooled autosampler, quaternary pump and column thermostat was used for the separation of the samples. The autosampler was cooled to 4 oC, whereas the column was held at 35 oC. A sample volume of 20 µL was used throughout. The columns and separation conditions used are summarized in Table 6 methods C and D. The column effluent was split 1:4 using a QuickSplit Post-Column Flow splitter (ASI, USA), with 1 part of the effluent infused into the ICPMS and 3 parts into the ES-MS.
M
AN
US
CR
IP
T
AC
CE
PT
ED
ACCEPTED MANUSCRIPT
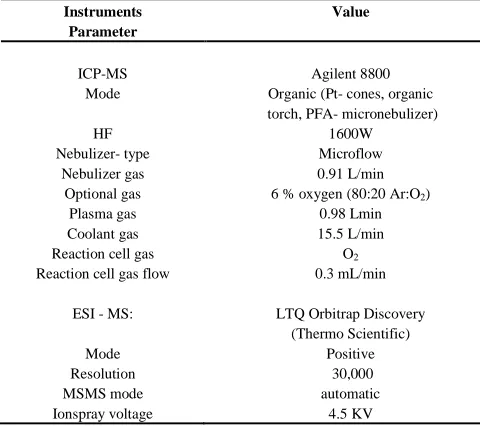
run using a continuous internal standard containing sulfur and [image:9.595.39.279.189.402.2]rhodium as described in Amayo et al65 was used for correction. An LTQ-Orbitrap Discovery from Thermo Scientific, UK was the ESMS system used for molecular identification. The splitter outlet (3 parts) was directly connected to the ES-inlet. The instrument was optimized daily for highest sensitivity and mass accuracy in positive mode. Further instrument parameters can be found in Table 7.
Table 7: Instrumentation parameter for ICPMS and ESMS
optimized for peptide quantification
Instruments Parameter Value ICP-MS Mode HF Nebulizer- type Nebulizer gas Optional gas Plasma gas Coolant gas Reaction cell gas Reaction cell gas flow
ESI - MS:
Mode Resolution MSMS mode Ionspray voltage
Agilent 8800 Organic (Pt- cones, organic torch, PFA- micronebulizer)
1600W Microflow 0.91 L/min 6 % oxygen (80:20 Ar:O2)
0.98 Lmin 15.5 L/min
O2 0.3 mL/min
LTQ Orbitrap Discovery (Thermo Scientific)
Positive 30,000 automatic
4.5 KV
4 . 2 . 4 . N M R
NMR experiments were performed at 25 °C for 4 and 5 in a Bruker Ascend 400MHz NMR machine with a Z116098_0444 (PA BBO 400S1 BBF-H-D-05 Z SP) probe while Bruker DRX500 spectrometer equipped with a 5 mm TXIz probe was used for 13-16. Data acquisition for all compounds was done at 64 scans, 10.00 compensate, 90o pulse and 30 sec Delay.
Acknowledgments
MJ, JHN, WEH, LT gratefully acknowledge support from the the Leverhulme Trust (RPG 2012-504). JT and AR were funded by EU-FP7 project ‘PharmaSea’ (contract 312184) and ARM and GM were funded by Scottish Enterprise High Growth Spinout Programme PS7305CA38.
References and Notes
1. Barnidge, D. R.; Dratz, E. A.; Martin, T.; Bonilla, L. E.; Moran, L. B. Anal. Chem. 2003, 445-451.
2. Zhu, L.; Tamvakopoulos, C.; Xie, D.; Dragovic, J.; Shen, X.; Fenyk- Melody, J. E.; Schmidt, K.; Bagchi, A.; Griffin, P. R.; Thornberry, N. A.; Roy, R. S. J. Biol. Chem 2003, 278, 22418-22423.
3. Weckwerth, W.; Willmitzer, L.; Fiehn, O. Rapid Commun. Mass
Spectrom. 2000, 1677-1681.
4. John, H.; Walden, M.; Schafer, S.; Genz, S.; Forssmann W. Anal.
Bioanal. Chem 2004, 883-897.
5. Goltzman, D. Nat. Rev. Drug Discovery, 1, 784-796. 6. Douglas, S. A. Current Opin. Pharmacol. 2003, 159-167.
7. Hajee, C. A. J.; van Rhijn, H. A.; Lasaroms, J. J. P.; Keukens, H. J.; de Jong, J. Analyst 2001, 126, 1332-1338.
8. Stegehuis, D. S.; Tjaden, U. R.; van den Beld, C. M. B.; van der Greef, J. J Chromatogr. 1991, 549, 185-193.
9. Pauli, G. F.; Gödecke, T.; Jaki, B. U.; Lankin, D. C. J. Nat. Prod.
2012, 834-851.
10. Peffers, M. J.; Beynon, R. J.; Clegg, P. D. Int. J. Mol. Sci. 2013, 20658-20677.
11. Prange, A.; Pröfrock, D. J Anal. At. Spectrom. 2008, 23, 432-459. 12. Gerber, S. A.; Rush, J.; Stemman, O.; Kirschner, M. W.; Gygi, S.
P. Proc. Natl. Acad. Sci. USA 2003, 100, 6940-6945. 13. Yi, E.C.; Li, X.J.; Cooke, K.; Lee, H.; Raught, B.; Page, A.;
Aneliunas, V.; Hieter, P.; Goodlett, D.R.; Aebersold, R.
Proteomics 2005, 5, 380-385.
14. Hansen, K.C.; Schmitt-Ulms, G.; Chalkley, R.J.; Hirsch, J.; Baldwin, M.A.; Burlingame, A.L. Mol. Cell. Proteomics 2003, 2, 299-314.
15. Qu, J.; Straubinger, R. M. Rapid Commun. Mass Spectrom. 2005,
19, 2857-2864.
16. Rainczuk, A.; Condina, M; Pelzing, M.; Dolman, S.; Rao, J; Fairweather, N.; Jobling, T.; Stephens, A.N. J. Proteome Res.
2013, 12, 4074-4088.
17. Schmidt, A.; Kellermann, J.; Lottspeich, F. Proteomics 2005, 5, 4-15.
18. Lottspeich, F.; Kellermann, J. Methods Mol. Biol. 2011, 753, 55-64.
19. Oda, Y.; Huang, K.; Cross, F.R.; Cowburn, D., Chait, B.T. Proc.
Natl. Acad. Sci. USA 1999, 96, 6591-6596.
20. Blagoev, B.; Kratchmarova, I.; Ong, S.E.; Nielsen, M.; Foster, L.J.; Mann, M. Nat. Biotechnol. 2003, 21, 315-318.
21. Krüger, M.; Moser, M.; Ussar, S.; Thievessen, I.; Luber, C.A.; Forner, F.; Schmidt, S.; Zanivan, S.; Fässler, R.; Mann, M. Cell
2008, 134, 353-364.
22. Dayon, L.; Hainard, A.; Licker, V.; Turck, N.; Kuhn, K.; Hochstrasser, D.F.; Burkhard, P.R.; Sanchez, J. C. Anal. Chem.
2008, 80, 2921-2931.
23. Ting, L.; Rad, R.; Gygi, S.P.; Haas, W. Nat. Methods 2011, 8, 937-940.
24. Kettenbach, A.N.; Rush, J.; Gerber, S.A. Nat. Protoc. 2011, 6, 175-186.
25. Prakash, A.; Tomazela, D.M.; Frewen, B.; Maclean, B.; Merrihew, G.; Peterman, S.; Maccoss, M.J. J. Proteome Res. 2009, 8, 2733-2739.
26. He, Y.; Zhang, Y.; Wei, C.; Li, C.; Gao, Y.; Liu,R. Appl. Spec. Rev. 2014, 49, 6, 492-512.
27. Osama, C.; Diego, C.; John, M. J. Pharm. Biomed. Anal. 2015, 113, 2–20.
28. Ahrends, R.; Pieper, S.; K€uhn, A.; Weisshoff, H.; Hamester, M.; Lindemann, T.; Scheler, C.; Lehmann, K.; Taubner, K.; Linscheid, M. W. Mol. Cell. Proteomics 2007, 6, 1907-1916.
29. Pereira-Navaza, A.; Ruiz-Encinar, J.; Sanz-Medel, A. Angew.
Chem. Int. Ed. 2007, 46, 569-571.
30. Xu, M.; Yang, L. M.; Wang, Q. Q. J. Anal At Spectrom 2008, 23, 1545-1549.
31. Xu, M.; Yan, X. W.; Xie, Q. Q.; Yang, L. M.; Wang, Q. Q. Anal.
Chem. 2010, 82, 1616-1620.
32. Theiner, S.; Kornauth, C.; Varbanov, H. P.; Galanski, M.; Schoonhoven, S. V.; Heffeter, P.; Berger, W.; Egger, A. E.; Keppler, B. K. Metallomics 2015, 7, 1256-1264.
33. Wind, M.; Wegener, A.; Eisenmenger, A.; Kellner, R.; Lehmann, W. D. Angew. Chem. Int. Ed. 2003, 42, 3425-3427.
34. Yan, X. W.; Yang, L. M.; Wang, Q. Q. Angew. Chem. Int. Ed.
2011, 50, 5130-5133.
35. Yan, X. W.; Luo, Y. C.; Zhang, Z. B.; Li, Z. X.; Luo, Q.; Yang, L. M.; Zhang, B.; Chen, H. F.; Bai, P. M.; Wang, Q. Q. Angew.
Chem. Int. Ed. 2012, 51, 3358-3363.
36. El Balkhi, S.; Poupon, J.; Trocello, J. M.; Massicot, F.; Woimant, F.; Laprévote, O. Anal. Chem. 2010, 82, 6904-6910.
37. Suzuki, Y.; Nobusawa, A.; Furuta, N. Anal. Sci. 2014, 30, 551-559.
38. Bierla, K.; Bianga, J.; Ouerdane, L.; Szpunar, J.; Yiannikouris, A.; Lobinski, R. J. Proteomics 2013, 87, 26-39.
39. Wang, M.; Feng, W.; Lu, W.; Li, B.; Wang, B.; Zhu, Wang, Y.; Yuan, H.; Zhao, Y.; Chai, Z. Anal. Chem. 2007, 79, 9128-9134. 40. Bernstein, M. A.; Sýkora, S.; Peng, C.; Barba, A.; Cobas, C.;
Anal. Chem. 2013, 85, 5778−5786.
M
AN
US
CR
IP
T
AC
CE
PT
ED
ACCEPTED MANUSCRIPT
Tetrahedron
8
42.Barding, G. A. Jr.; Salditos, R.; Larive, C. K. Anal. Bioanal. Chem. 2012, 404, 1165−1179.
43. Akoka, S.; Barantin, L.; Trierweiler, M.; Anal. Chem. 1999, 71, 2554-2557.
44. Lane, S.; Boughtflower, B.; Mutton, I.; Paterson, C.; Farrant, D.; Taylor, N.; Blaxill, Z.; Carmody, C.; Borman, P. Anal. Chem.
2005, 77, 4354−4365.
45. Giordanetto, F.; Kihlberg, J. J. Med Chem. 2014, 278-295. 46. Arnison, P. G.; Bibb, M. J.; Bierbaum, G.; Bowers, A. A.; Bugni,
T. S.; Bulaj, G.; Camarero, J. A.; Campopiano, D. J.; Challis GL, Clardy J, Cotter PD, Craik DJ, Dawson M, Dittmann E, Donadio S, Dorrestein PC, Entian KD, Fischbach MA, Garavelli JS, Göransson U, Gruber CW, Haft DH, Hemscheidt TK, Hertweck C, Hill C, Horswill AR, Jaspars M, Kelly WL, Klinman JP, Kuipers OP, Link AJ, Liu W, Marahiel MA, Mitchell DA, Moll GN, Moore BS, Müller R, Nair, S.K.; Nes, I. F.; Norris, G. E.; Olivera, B. M.; Onaka H.; Patchett, M. L.; Piel, J.; Reaney, M. J.; Rebuffat, S.; Ross, R. P.; Sahl, H. G.; Schmidt, E. W.; Selsted, M. E.; Severinov, K.; Shen, B.; Sivonen, K.; Smith, L.; Stein, T.; Süssmuth, R. D.; Tagg, J. R.; Tang, G. L.; et al. Nat Prod Rep
2013, 108-160.
47. Houssen, WE. & Jaspars, M ChemBioChem 2010, 11, 1803-1815. 48. Goto, Y.; Ito, Y.; Kato, Y.; Tsunoda, S.; Suga, H. Chem. Biol.
2014, 788-774.
49. Drigger, E. M.; Hale, S. P.; Lee, J.; Terrett, N. K. Nat. Rev. Drug
Discov. 2008, 608-624.
50. Longley, D. B.; Johnston, P. G. J. Pathol. 2005, 275-292. 51. Williams B.A., J. R. S. Cancer Lett. 1993, 71, 97-102.
52. Aller S.G, Yu J, Ward A, Weng Y,et al. Science 2009, 323, 1718-1721.
53. Long, P. F.; Dunlap, W. C.; Battershill, C. N.; Jaspars, M.
ChemBioChem 2005, 6, 1760-1765.
54. Schmidt, E. W.; Nelson, J. T.; Rasko, D. A.; Sudek, S.; Eisen, J. A.; Haygood, M. G.; Ravel, J. Proc Natl Acad Sci USA 2005, 102, 7315-7320.
55. Houssen, W. E.; Wright, S. H.; Kalverda, A. P.; Thompson, G. S.; Kelly, S. M.; Jaspars, M. ChemBioChem 2010, 11, 1867-1873. 56. Koehnke, J.; Bent, A. F.; Zollman, D.; Smith, K.; Houssen, W. E.;
Zhu, X.; Mann, G.; Lebl, T.; Scharff, R.; Shirran, S.; Botting, C. H.; Jaspars, M.; Schwarz-Linek, U.; Naismith, J. H. Angew. Chem.
Int. Ed. 2013, 52, 13991-13996.
57. Koehnke, J.; Bent, A. F.; Houssen, W. E.; Zollman, D.; Morawitz, F.; Shirran, S. L.; Vendome, J.; Nneoyiegbe, A. F.; Trembleau, L.; Botting, C. H.; et al. Nature Structural and Molecular Biology
2012, 19, 767-772.
58. Leikoski, N.; Liu, L.; Jokela, J.; Wahlsten, M.; Gugger, M.; Calteau, A.; Permi, P.; Kerfeld, C. A.; Sivonen, K.; Fewer, D. P.
Chem. Biol. 2013, 1033-1043.
59. Donia, M. S.; Hathaway, B. J.; Sudek, S.; Haygood, M. G.; Rosovitz, M. J.; Ravel, J.; Schmidt, E. W. Nat. Chem. Biol. 2006,
2, 729-735.
60. Bent, A. F.; Koehnke, J.; Houssen, W. E.; Smith, M. C. M.; Jaspars, M.; Naismith, J. H. Acta Cryst. 2013, F69, 618-623. 61. Houssen, W. E.; Bent, A. F.; McEwan, A. R.; Pieiller, N.;
Tabudravu, J.; Koehnke, J.; Mann, G.; Adaba, R. I.; Thomas, L.; Hawas, U. W.; Liu, H.; Schwarz-Linek, U.; Smith, M. C. M.; Naismith, J. H.; Jaspars, M. Angew. Chem. Int. Ed. 2014, 1-5. 62. Tianero, M. D.; Donia, M. S.; Young, T. S.; Schultz, P. G.;
Schmidt, E. W. J. Am. Chem. Soc 2012, 134, 418-425. 63. McIntosh, J.A.; Donia, M. S.; Schmidt, E. W. J. Am. Chem. Soc.
2010, 132, 4089-4091.
64. McIntosh, J. A.; Schmidt, E. W. ChemBioChem. 2010, 11, 1413-1421.
65. Amayo, K. O.; Petursdottir, A.; Newcombe, C.; Gunnalaugsdottir, H.; Raab, A.; Krupp E.V. Feldmann, J. Anal. Chem. 2011, 83, 3589-3595.
66. Martínez-Sierra, J. G.; Galilea San Blas, O.; Marchante Gayón, J.M.; García Alonso, J.I. Spectrochim. Acta. 2015, 108, 35–52. 67. Møller, L.H.; Macharius, A.; Hansen, T. H.; Nielsen, H.M.;
Cornett, C.; Østergaard, J.; Stürupa, S.; Gammelgaard, B. J. Anal. At. Spectrom. 2016, 31, 1877.
68. G. Hermann, G.; Moller, L. H.; Gammelgaard, B.; J. Hohlweg, J.; Mattanovich, D.; Hann, S.; Koellensperger, G. J. Anal. At. Spectrom. 2016, 31, 1830-1835.
69. Buszewski, B.; Szultka, M. Crit. Rev. Anal. Chem., 2012, 42:198– 213, 2012.
70. Rogeberg, M.; Malerod, H.; Hanne Roberg-Larsen, H.; Aass, C.; Wilson, S. R. J. Pharm. Biomed. Anal. 2014, 87, 120– 129.
71. Loroch, S.; Zahedi, R. P.; Sickmann, A. Anal. Chem. 2015, 87, 1596−1604.