Int. J. Electrochem. Sci., 13 (2018) 762 – 770, doi: 10.20964/2018.01.60
International Journal of
ELECTROCHEMICAL
SCIENCE
www.electrochemsci.orgShort Communication
One-Step Synthesis of Co@C Composite as High-Performance
Anode Material for Lithium-ion Batteries
Ming-Jun Xiao1, Fu-Liang Zhu1,3, Gong-Rui Wang1, Chao-Yu Duan1, Yan-Shuang Meng1,3,* and Yue Zhang2,*
1
School of Materials Science and Engineering, Lanzhou University of Technology, Lanzhou 730050, China
2
Department of Mechanical and Industrial Engineering, Texas A&M University-Kingsville, Kingsville, Texas, 78363, USA
3
State Key Laboratory of Advanced Processing and Recycling of Non-ferrous Metals, Lanzhou 730050, China
*
E-mail: [email protected], [email protected]
Received: 16 October 2017 / Accepted: 24 November 2017 / Published: 16 December 2017
A carbon-coated cobalt (Co@C) composite was synthesized by a one-step method using ionic liquid as carbon source and reducing agent. The Co@C composite exhibited a core-shell structure, in which the cobalt nanoparticles uniformly embedded in the carbon matrix. When used as the anode material for lithium ion batteries, the cobalt nanoparticles enhanced the kinetics of Li+ and electronic transport during the charge/discharge process. The Co@C composite material delivered a reversible capacity of 657.3 mAh g-1 after 60 cycles at a current density of 0.1C and exhibits improved rate performance when compared with pure carbon.
Keywords: Co@C composite; Lithium ion batteries; Ionic liquid
1. INTRODUCTION
graphitic carbon in the energy storage for large-scaled device [6]. It is necessary to develop new anode materials with high specific capacity, rate performance, and cycle stability.
In order to improve the specific capacity of carbon anode material, some researches have been carried out to synthesize porous carbon or metal-oxide/carbon composites[7]. It is found that the carbon composites with transition metals or transition metal oxides exhibit better electrochemical performance than pure carbon materials[8-11]. The introduction of transition metals not only enhances the specific capacity, but also improves the rate performance of carbon anode material. Mai et.al synthesized graphene-Ni hybrid material and found that the anchored nickel nanoparticles could increase the electrical conductivity and also modify the structure of SEI film covering the surface of graphene[12]. The Co@C composite exhibited improved electrochemical performance due to the transition metal, cobalt, which can enhance the electrical conductivity of electrode and catalyzed the lithium-carbon reaction in the electrochemical processes [13].
Herein, an one-step method is used to synthesize Co@C composite, using ionic liquid 1-butyl-3-methylimidazolium dicyanamide ([BMIm]N(CN)2) as carbon source and cobalt acetate
(Co(AC)·4H2O) as cobalt source. The structure characterization results show that cobalt nanoparticles
are embedded in the carbon matrix providing an integrated conductive network. The electrode materials are then assembled into a half-cell to measure the electrochemical performance. Due to the catalytic activity of cobalt nanoparticles and the integrated conductive network, the prepared Co@C composite exhibits a higher reversible capacity, better rate performance and less hysteresis than carbon matrix. These results indicate that Co@C composite is a promising electrode material for LIBs, which would be suitable for widespread applications.
2. EXPERIMENTAL
2.1 Materials Preparation
The carbon source ([BMIm]N(CN)2, 2 g) and cobalt source (Co(AC).4H2O, 1 g) were first
mixed and ground. The mixture was then transferred to a tube furnace purged with argon gas. The mixture was heated to 350 oC and kept for 0.5 hour, followed by heating to 650 oC and kept for 1 hour. The materials after heating were collected and denoted as Co@C. Pure carbon material was prepared as control and denoted as C, which was produced through the same procedure without cobalt source.
2.2 Material Characterization
2.3 Electrochemical measurement
Electrochemical measurements of the anode materials were performed in a coin-type cell. The anode electrodes were fabricated by using 70% active material, 20% Super P, and 10% polyvinylidene fluoride in N-methyl pyrrolidone to form slurry. The slurry was then coated onto a Cu foil. The solvent was evaporated in vacuum at 80oC for 12 hours. A lithium foil counter electrode was invoked. A Celgard 2400 micro-porous polypropylene film was used to separate electrodes. The electrolyte was prepared by dissolving 1 M lithium hexafluorophosphate (LiPF6) in a mixture of ethylene carbonate
(EC) and diethyl carbonate (DEC) with a volume ratio of 1:1. Nickel foam was used to support the battery shell. Coin cell was assembled inside a glove box filled with dry argon. The charge-discharge tests were performed on a battery test system (Land CT2001D, China). Electrochemical impedance spectra (EIS) and cyclic voltammetry (CV) measurements were carried out at room temperature on a CHI660D electrochemistry workstation (Huachen, China).
3. RESULT AND DISCUSSION
10 20 30 40 50 60 70 80
Inte
nsit
y(
a.u.)
2θ (degree)
(a)
graphite,PDF#41-1487 C
Co,PDF#15-0806 Co@C
4000 3500 3000 2500 2000 1500 1000 500 Co@C
T
rans
m
itt
anc
e
(a.
u.
)
Wavenumbers (cm-1) 3430
1631
C
[image:3.596.106.481.360.506.2](b)
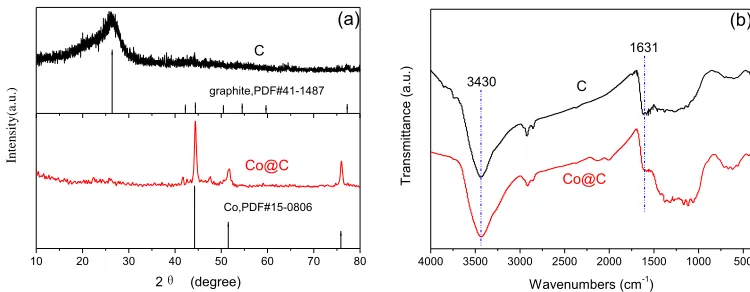
Figure 1. XRD patterns (a) and FTIR spectra (b) of the Co@C and C
400 800 1200 1600 2000 2400 2800 3200
ID/ IG=0,911
G
(1
5
8
7
)
D
(1
3
5
8
)
C
Co@C
Int
ens
ity
(a.
u.
)
Raman shift (cm-1
)
[image:4.596.214.390.77.225.2]ID/ IG=0,959
Figure 2. Raman spectra of Co@C and C
Figure 2 shows the Raman spectra of C and Co@C samples. Two characteristic peaks of D-band (1358 cm-1) and G-band (1587 cm-1) are clearly observed, indicating the presence of graphite carbon in both samples. There is a notable shift in the D and G bands of Co@C sample. This shift indicates the presence of large amount of disorders in the carbon planes of the graphitic carbon in Co@C[16]. The disorder degree of graphite crystal structure of carbon materials can be characterized by the intensity ratio of G band and G band. The ID/IG ratio of Co@C is nearly 1, indicating a large
[image:4.596.96.497.422.723.2]number of defects , which is beneficial for electrochemical properties[17].
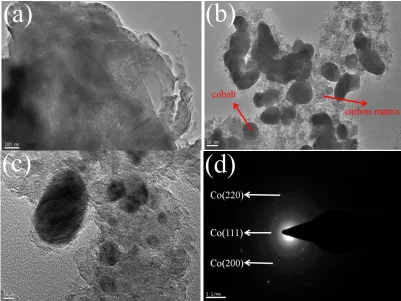
The TEM images, seen in Figure 3, are used to observe the morphology of the Co@C and C samples. As shown in Figure 3 (a), the pure carbon matrix shows network morphology of lamellar structure. Figure 3(a) shows the lamellar structure of the C samples with smooth carbon planes. Some ripples are also observed on the carbon plane, suggesting disordered stacking of these carbon planes[17]. As shown in Figure 3(b), the cobalt nanoparticles are uniformly embedded in the carbon matrix. A closer look of the Co@C sample reveals a core-shell structure, in which the cobalt nanoparticles are wrapped by carbon films that are formed through the catalysis of cobalt nanoparticles (Figure 3(c))[18]. The selected area electron diffraction (SAED) pattern, seen in Figure 3(d), shows the diffraction rings of the (111), (200), and (220) planes of Co, indicating the well crystallization of cobalt nanoparticles. This is also in agreement with the XRD result. The carbon shell with numerous defects could provide active sites for the formation of SEI film[19]. The anchored cobalt nanoparticles are beneficial to the Li+ migration and the electrical conductivity of carbon matrix[20, 21]. Therefore, the unique structure of the Co@C sample could improve the reversible capacity and rate performance when used as anode materials for LIBs.
0 10 20 30 40 50 60
200 300 400 500 600 700 800 900 1000 1100 1200 1300 1400 C Co@C 1C 0.1C 0.5C 0.3C 0.2C 0.1C Spec ific c apac ity (m Ah/ g) Cycle (n) (a)
0 200 400 600 800 1000 1200 1400 0.0 0.5 1.0 1.5 2.0 2.5 3.0 Co@C C Pot ent ial (V)
Specific capacity (mAh/g)
(b)
0 100 200 300 400 500 600 700 800 0.0 0.5 1.0 1.5 2.0 2.5 3.0
60th 30th 5th
Pot
ent
ial
(V)
Specific capacity (mAh/g)
(c)
[image:5.596.100.491.330.631.2]Co@C
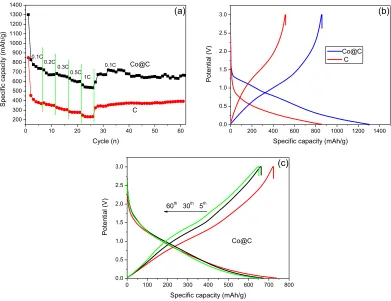
Figure 4. Rate capability of C and Co@C at different current density (a); first charge/discharge curves
of C and Co@C (b) and charge/discharge curves of Co@C after different cycles (c)
Co@C exhibits specific capacity of 1299.3, 735.2, 673, 648.7, 601.5, and 565.4mAh g-1 at different current densities of 0.1C, 0.2C, 0.3C, 0.5C, and 1C (1C=372mA.g-1), respectively. When the current density returns to 0.1C, the Co@C sample still remains a specific capacity of 657.3 mAh g-1, indicating the better rate and cycle performance of Co@C.
From the first charge/discharge curve of C and Co@C, shown in Figure 4(b), the discharge voltage platform increased to ~1.35 V after embedding cobalt nanoparticles in the carbon matrix. This can be attributed to the interaction of cobalt nanoparticles with lithium ions during the charge/discharge process, which is beneficial to the reversible capacity[23]. From the curves in Figure 4(c), it is found that the specific capacities of Co@C are 738.3, 671.8 and 657.3mAh.g-1 after 5, 30 and 60 cycles, respectively, revealing the excellent cycle performance of Co@C. The high reversible capacity and excellent cycle performance is attributed to a core-shell structure of Co@C. The embedded cobalt nanoparticles are benefit to the Li+ migration and the electronic conductivity of carbon matrix. The strong-bonded carbon shell not only provides active sites of Li+ ions, but also reduces the volume effect of cobalt nanoparticles, preventing them from agglomerating during charge/discharge process.
0.0 0.5 1.0 1.5 2.0 2.5 3.0
-0.25 -0.20 -0.15 -0.10 -0.05 0.00 0.05 0.10
SEI
R1=1.10V Co@C C
C
urrent
(m
A)
Potential (V)
[image:6.596.187.398.349.506.2]R2=2.00V
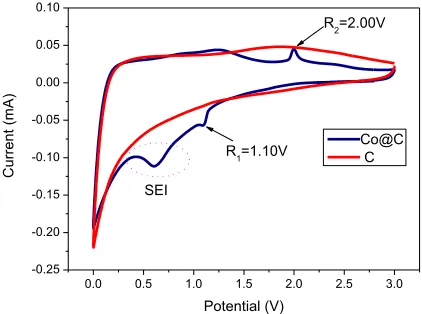
Figure 5. CV profiles of C and Co@C at scan rate of 0.1 mV.s-1
0 100 200 300 400 500 600 700 800
0 200 400 600 800 1000
Co@C C
-Z
''
(
)
[image:7.596.182.413.78.250.2]Z' ()
[image:7.596.45.544.338.369.2]Figure 6. Nyquist plots of C and Co@C
Table 1. The parameters obtained by fitting an equivalent circuit of C and Co@C electrodes
Sample Rs(Ω) Rf(Ω) Rct(Ω)
Co@C 7.4±0.2 27.8±8.6 323.8±14.3
To further understand the reasons for the improved rate capability and cycling stability of Co@C sample, the EIS is performaned and the Nyquist plots of the C and Co@C electrodes are shown in Figure 6. The semicircle diameter of Co@C electrode is smaller than that of the carbon electrode, indicating a smaller surface film resistance and lithium-ion charge transfer resistance. The equivalent circuit is exhibited in the inset. The equivalent analog of Rf relates to the Li+ migration through the surface films[28]. Rs represents the electrolyte resistance and Rct represents the charge transfer resistance of lithium-ion at the interface between electrolyte and electrode. and a sloped line at low frequency is indexed with the Warburg resistance (W1)[29, 30]. The resistances are summarized in Table.1The Rf and Rct of the carbon electrode are 285.3±18.4 and 567.5±27.12, respectively. But for the Co@C electrode, the Rf and Rct drastically reduced to 27.8±8.6 and 323.8±14.3, respectively. The EIS results suggest that the kinetics of Li+ and electronic transport are enhanced by embedding cobalt nanoparticles into the carbon matrix, leading to the excellent electrochemical performance.
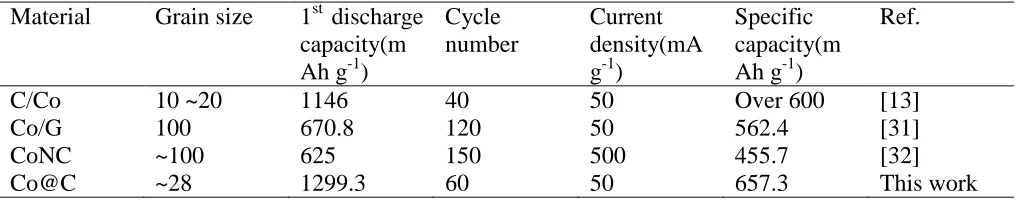
Table 2. Comparison of the Co@C electrode with similar electrodes reported in the literature
Material Grain size 1st discharge capacity(m Ah g-1)
Cycle number
Current density(mA g-1)
Specific capacity(m Ah g-1)
Ref.
C/Co 10 ~20 1146 40 50 Over 600 [13]
Co/G 100 670.8 120 50 562.4 [31]
CoNC ~100 625 150 500 455.7 [32]
[image:7.596.45.553.655.755.2]
By comparison from Table 2, the discharge capacity of Co@C composite is much higher than other similar materials. In addition, after 40 cycles, Co@C composite also outperforms other similar materials in grain size and cycle stablity.
4. CONCLUSION
Co@C composite was successfully produced by pyrolysing a mixture of ([BMIm]N(CN)2and
(Co(AC)·4H2O). A core-shell structure was obtained, in which the cobalt nanoparticles uniformly
distributed in the carbon matrix. The cobalt nanoparticles not only provided active sites for lithium storage, but also enhanced the electrical transport and Li+ migration during the charge/discharge process. The carbon shell, with many defects, provided active sites for Li+ ions and also prevented the agglomeration of the cobalt nanoparticles during the charge/discharge process. Due to this unique structure, the Co@C composite delivered a reversible capacity of 657.3mAh g-1 after 60 cycles at a current density of 0.1C, which is twice the capacity of the pure carbon matrix. The Co@C electrode also exhibited excellent rate and cycling performances. These results indicate that the Co@C composite can be integrated into highly efficient energy storage applications, which with further optimization should be suitable for widespread applications.
ACKNOWLEDGEMENT
The project was supported by the National Natural Science Foundation of China (grant No. 51364024, 51404124), the Foundation for Innovation Groups of Basic Research in Gansu Province (No. 1606RJIA322) and Research and Development Fund of Lanzhou University of Technology (01-0443).
References
1. W. Wei, Z. Wang, Z. Liu, Y. Liu, L. He, D. Chen, A. Umar, L. Guo, J. Li, J Power Sources, 238 (2013)376.
2. V.S. Espinoza, S. Erbis, L. Pourzahedi, M.J. Eckelman, J.A. Isaacs, ACS Sustainable Chemistry & Engineering, 2 (2014)1642.
3. B. Scrosati, J. Garche, J Power Sources, 195 (2010)2419.
4. Y. Jiang, X. Yan, W. Xiao, M. Tian, L. Gao, D. Qu, H. Tang, J. Alloy. Compd., 710 (2017)114. 5. L. Li, G. Zhou, X.-Y. Shan, S. Pei, F. Li, H.-M. Cheng, J Power Sources, 255 (2014)52.
6. Y. Ma, J. Huang, X. Liu, F. Bu, L. Wang, Q. Xie, D.-L. Peng, Chemical Engineering Journal, 327 (2017)678.
7. X. Wang, S. Dai, Angew Chem Int Ed Engl, 49 (2010)6664.
8. S. Zhang, H. Gu, H. Pan, S. Yang, W. Du, X. Li, M. Gao, Y. Liu, M. Zhu, L. Ouyang, D. Jian, F. Pan, Advanced Energy Materials, 7 (2017)1601066.
9. X. Zhu, Y. Zhu, S. Murali, M.D. Stoller, R.S. Ruoff, J Power Sources, 196 (2011)6473.
10.K. Cao, L. Jiao, Y. Liu, H. Liu, Y. Wang, H. Yuan, Advanced Functional Materials, 25 (2015)1082. 11.N. Recham, M. Armand, R. Janot, C. Masquelier, L. Dupont, J.M. Tarascon, Zeitschrift für
anorganische und allgemeine Chemie, 634 (2008)2005.
14.D. Zhang, D. Cao, K. Ye, J. Yin, K. Cheng, G. Wang, Electrochimica Acta, 139 (2014)250. 15.L. Sun, H. Li, L. Ren, C. Hu, Solid State Sciences, 11 (2009)108.
16.E. Duraisamy, P. Gurunathan, H.T. Das, K. Ramesha, P. Elumalai, J Power Sources, 344 (2017)103.
17.E.J. Yoo, J. Kim, E. Hosono, H. Zhou, T. Kudo, I. Honma, Nano Letters, 8 (2008)2277. 18.H. Zhang, C. Liang, J. Liu, Z. Tian, G. Shao, Carbon, 55 (2013)108.
19.F. Béguin, F. Chevallier, C. Vix-Guterl, S. Saadallah, V. Bertagna, J.N. Rouzaud, E. Frackowiak, Carbon, 43 (2005)2160.
20.I.R.M. Kottegoda, Y. Kadoma, H. Ikuta, Y. Uchimoto, M. Wakihara, Electrochemical and Solid-State Letters, 5 (2002)A275.
21.Y. Wu, C. Jiang, C. Wan, E. Tsuchida, Electrochem Commun, 2 (2000)626. 22.L. Wang, Y. Yu, P.C. Chen, C.H. Chen, Scripta Materialia, 58 (2008)405. 23.Y.J. Mai, J.P. Tu, C.D. Gu, X.L. Wang, J. Power Sources, 209 (2012)1.
24.T. Zheng, W. Mckinnon, J. Dahn, Journal of the Electrochemical Society, 143 (1996)2137. 25.D. Xu, C. Mu, J. Xiang, F. Wen, C. Su, C. Hao, W. Hu, Y. Tang, Z. Liu, Electrochimica Acta, 220
(2016)322.
26.N.S. Marzuki, N.U. Taib, M.F. Hassan, N.H. Idris, Electrochimica Acta, 182 (2015)452. 27.G. Yan, X. Li, Z. Wang, H. Guo, C. Wang, J. Power Sources, 248 (2014)1306.
28.M.D.L. And, D. Aurbach, Journal of Physical Chemistry B, 101 (1997)4641.
29.M.V. Reddy, T. Yu, C.H. Sow, Z.X. Shen, C.T. Lim, G.V. Subba Rao, B.V.R. Chowdari, Advanced Functional Materials, 17 (2007)2792.
30.Z. Yan, Q. Hu, G. Yan, H. Li, K. Shih, Z. Yang, X. Li, Z. Wang, J. Wang, Chemical Engineering Journal, 321 (2017)495.
31.G.-C. Li, W. Zhao, J. Alloy. Compd., 716 (2017)156.
32.C. An, M. Wang, W. Li, Q. Deng, Y. Wang, L. Jiao, H. Yuan, Electrochimica Acta, 250 (2017)135.