Int. J. Electrochem. Sci., 13 (2018) 2875 – 2886, doi: 10.20964/2018.03.07
International Journal of
ELECTROCHEMICAL
SCIENCE
www.electrochemsci.org
Novel Ratiometric Electrochemical Sensor for Sensitive
Detection of Ag
+Ion Using High Nitrogen Doped Carbon
Nanosheets
Xian-He Yu1, Zhong-Xia Wang2, Yuan-Fei Gao2, Fen-Ying Kong2, Wei-Xin Lv2, Hong-Fei Ma1,* and Wei Wang2,*
1
School of Chemistry and Molecular Engineering, Nanjing Tech University, Nanjing 211816, P.R. China.
2
School of Chemistry and Chemical Engineering, Yancheng Institute of Technology, Yancheng224051, P.R. China.
*
E-mail: [email protected], [email protected]
Received: 20 October 2017 / Accepted: 19 December 2017 / Published: 5 February 2018
A novel dual-signal ratiometric electrochemical nanosensor for highly sensitive and selective detection of Ag+ ion has been designed on the basis of decreasing overpotential of high nitrogen doped carbon nanosheets and poly(diallyldimethylammonium chloride)-coated oxidized single-walled carbon nanotubes (HNCNs/PDDA/SWCNTs) and highly specific response strategy. The formation of HNCNs/PDDA/SWCNTs nanocomposite not only provides a higher surface area, but also nitrogen-hole microenvironment for retaining the native activity of the reacted Ag+ ion. As a ratiometric amperometric sensor, the resulting HNCNs/PDDA/SWCNTs nanocomposite-modified electrode exhibited high sensitivity and selectivity for the detection of Ag+ ion in the range of 5 nM-10 µM and 10-200 µM with a detection limit of 1.97 nM (S/N = 3). The results indicated that the synergetic effect with PDDA/SWCNTs changes the analytical path of the HNCNs matrix for Ag+ ion detection. This work demonstrated that HNCNs/PDDA/SWCNTs nanocomposite possesses the feasibility and potential applications in electrochemical sensing.
Keywords: High nitrogen doped carbon nanosheets; Amperometric; Ratiometric sensor; Silver ion; Decreasing overpotential
1. INTRODUCTION
cognitive and motion disorders, and Minamata disease [5-9]. Therefore, it is still a challenge to develop simple and rapid method for the sensitive and selective detection of trace amounts Ag+ ions in environment and biological samples.
Comparing with the traditional single-signal output analytical techniques, the ratiometric analytical way, as one of new analysis techniques, is a powerful tool to surmount the background interference, the instability of single analytical signal intensity and low sensitivity and selectivity [10-13]. More recently, several ratiometric sensors such as electrochemical, fluorescent, and surface-enhanced Raman spectroscopy (SERS) have been developed for detection metal ions, DNA, and biomolecules [14-18], and so on, meanwhile, they have been demonstrated to permit signal rationing and provided built-in correction for environment effects. Among these ratiometric methods, rationmetric electrochemical sensor has attracted the extensive attention owing to its lower detection limit, good self-calibration, and the ability to eliminate the background and personal factors and thus enhances the reproducibility greatly [19-23]. Therefore, more sensitive and simple rationmetric electrochemical approaches for Ag+ ion detection are still urgent problem because Ag+ ion do harm to human health and environment after long-term accumulation.
In this work, a simple and sensitive electrochemical sensor for the detection of Ag+ ion has been developed based on high nitrogen doped carbon nanosheets and poly(diallyldimethylammonium chloride)-coated oxidized single-walled carbon nanotubes (HNCNs/PDDA/SWCNTs) nanocomposite, and the dual-signaling ratiometric electrochemical assay strategy. And the HNCNs/PDDA/SWCNTs nanocomposite was synthesized by simply electrostatic interaction using polycationiccompound, poly(diallyldimethylammonium chloride) (PDDA) as a bridge medium. The detailed concept of strategy is illustrated in Scheme 1. By taking advantages of decreasing overpotential of HNCNs/PDDA and the highly specific response between Ag+ ion and lots of nitrogen active sites of HNCNs/PDDA/SWCNTs nanocomposite, the fabricated HNCNs/PDDA/SWCNTs nanocomposite-modified electrode exhibited excellent performance as label-free amperometric sensors for Ag+ ion. To the best of our knowledge, it is the first time that HNCNs/PDDA/SWCNTs nanocomposite has been used to fabricate Ag+ ion sensor with a low detection limit and a wide response range.
2. EXPERIMENTAL
2.1 Reagents and chemicals
Single-walled carbon nanotubes (SWCNTs, with length of 10-20 µm, external diameter 1-5 nm and surface area 40-300 m2 g−1), poly(diallyldimethylammonium chloride) (PDDA) were obtained from Sigma-Aldrich. Adenine (AD, C5H5N5) was purchased from Shanghai Sangon Biological Co.
Ltd. (Shanghai, China). Silver nitrate (AgNO3) was purchased from Nanjing Chemical Reagent Co.
2.2 Apparatus
All electrochemical measurements experiments were performed on a CHI 660E electrochemical workstation using a conventional three-electrode system (CHI, China). A platinum (Pt) wire and saturated calomel electrode (SCE) were used as counter electrode and reference electrode, respectively, and the bare or modified glassy carbon electrode (GCE, diameter 3 mm) was used as working electrode. UV-vis absorption spectra were recorded on a Shimadzu UV-2550 spectrophotometer (Tokyo, Japan). Scanning electron microscopy (SEM) and EDX elemental mappings were carried out using a FEI Sirion 200 scanning electron microscope (FEI).
2.3 The preparation of HNCNs
High nitrogen doped carbon nanosheets (HNCNs) were prepared by hydrothermal treatment of AD [7]. In a typical experiment, 1.5 g AD was dissolved in 25 mL deionized water and 25 mL ethanol to form a homogeneous suspension solution under sonication. Then, 25 mL as-prepared solution was transferred into autoclave and heated at 180 °C for 7.5 h, and then cooled to room temperature naturally. The water phase solution was placed in refrigerator for about five days to remove all large HNCNs. At last, the resulting solution was centrifuged at 10,000 rpm for 30 min to remove the large tracts, and a pale-yellow HNCNs aqueous solution was obtained.
2.4 Noncovalent functionalization of SWCNTs by HNCNs
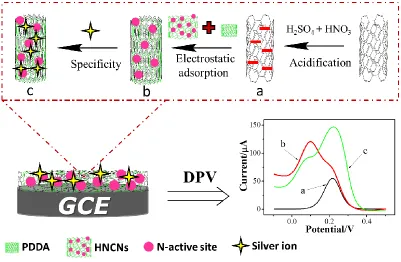
The SWCNTs were treated with nitric acid and sulfuric acid during purification process and then filtered, rinsed with doubly distilled water, finally, the negatively charged SWCNTs were dried under vacuum [24]. The procedure for the noncovalent functionalization of SWCNTs using HNCNs is as follows (Figure 1, steps a, b): SWCNTs (21 mg) was sonicated in 50 mL of 1.0 M NaCl solution for 2.0 h, and then 100 mL of PDDA was added. Next, the solution was continuously sonicated for 3.0 h. Subsequently, the resultant suspension was centrifuged to remove excess PDDA and NaCl at 7000 rpm for 30 min. And the prepared PDDA-SWCNTs (~20.0 mg) nanocomposites was dispersed in 50 mL of distilled water containing 1.0 mg mL-1 of HNCNs, then the mixed solution was sonicated for 3.0 h. At last, the suspension was centrifuged to remove excess HNCNs at 7000 rpm for 20 min, and the product was then resuspended in 2.0 mL distilled water. The HNCNs/PDDA/SWCNTs nanocomposites homogeneous suspension solution was obtained.
2.5 Preparing HNCNs/PDDA/SWCNTs nanocomposites modified GCE electrodes
[image:4.596.98.499.181.443.2]
HNCNs/PDDA/SWCNTs nanocomposites was successively dropped on the prepared GCE, then, the finally obtained modified GCE required drying at room temperature for 12 h before carrying out the following electrochemical measurements. As a comparative electrode, nanostructured electrode decorated with HNCNs, PDDA or PDDA/SWCNTs was also prepared by the same condition. All electrochemical experiments were carried out at 25 °C.
Figure 1. The stepwise fabrication process of the Ag+ ion sensor.
2.6 Electrochemical measurements
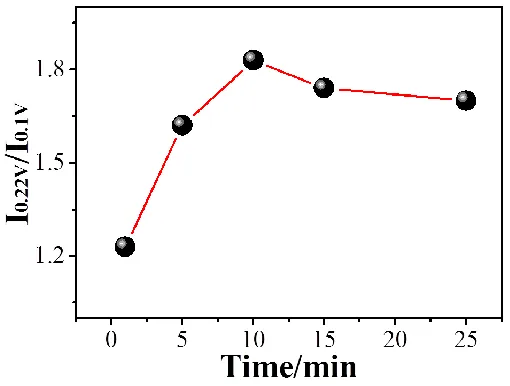
Electrochemical measurements were performed with a CHI 660E potentiostat (CHI, China) by using a conventional three-electrode system. The prepared Ag+ ion sensor was incubated in a solution containing different concentrations of Ag+ ion solution at 25 °Cfor 10 min (Figure 1, step c). After washing carefully with pH 7.0 Tris-HNO3 buffer to remove the nonchemisorbed Ag+ ion, differential
pulse voltammetric (DPV) responses of the sensor were recorded in 50 mM pH 7.0 Tris-HNO3 buffer
solution containing 5 mM [Fe(CN)6] 3−/4−
. The current intensities were measured at Imax 0.1 V and 0.22
V, respectively, and was represented ratio as I0.22V/I0.1V.
3. RESULTS AND DISCUSSION
3.1. Characterization of HNCNs/PDDA/SWCNTs nanocomposite
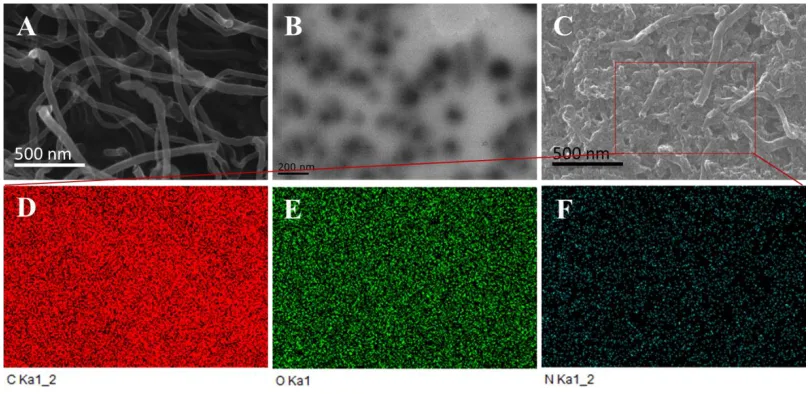
Figure 1a reproduces typical top-view SEM images of the SWCNTs, showing well-aligned CNTs with a smooth surface. And Figure 2B shows the TEM image of pure HNCNs, which has a graphene quantum dot-like shapes of different diameters. After incorporating HNCNs into the PDDA/SWCNTs matrix (Figure 2C), the hybrid nanofilm displays a 3D rough structure as expected, and SWCNTs are densely dispersed in the hybrid nanofilm without obvious aggregation, which indicated the successful formation of HNCNs/PDDA/SWCNTs nanocomposite nanofilm through simple electrostatic adsorption process, which is consistent with the corresponding UV-vis spectra results (SI, Figure S1). Furthermore, the successful formation of HNCNs/PDDA/SWCNTs nanofilm was proven by the EDX elemental mappings, as shown in Figure 2D-F. From the elemental maps, it is clear that the nitrogen element is uniform distribution in the entire sample. Quantification of the EDX spectra obtained in these nanocomposite nanofilm is shown in the maps, confirming relatively high levels of N doping (11.85 atom %) for the N-doped case.
Figure 2. The SEM images of (A) SWCNTs and (C) HNCNs/PDDA/SWCNTs, and TEM image of (B) HNCNs, and EDX elemental mappings (D-F) of HNCNs/PDDA/SWCNTs nanocomposite.
3.2 Electrochemical properties of the HNCNs/PDDA/SWCNTs nanocomposite modified GCE
Cyclic voltammograms (CVs) are a simple mean of demonstrating the changes of electrode behavior after each assembly step, since the electron transfer between the solution species and the modified electrode usually occur by tunneling either through the barrier or through the defects of electrode modified nanofilm in the barrier [24-25]. Figure 3 shows CVs of differently modified electrodes in 5 mM [Fe(CN)6]
3−/4−
compared with the PDDA/GCE as the SWCNTs act as a conducting wire or an electron communication relay, which increase the electron transfer efficiency. And it is important to note that the background and peak currents of the HNCNs/PDDA/SWCNTs/GCE increase greatly, and the apparent peak potential (Ep= (Epa+ Epc)/2) negatively shifts ∼100 mV compared with bare GCE
(Figure 3e), indicating that for the HNCNs/PDDA/SWCNTs modified GCE, the SWCNTs can significantly decrease the impedance and the HNCNs/PDDA matrix can greatly reduce the overpotential in the catalytic ferricyanide-redox reaction. Meanwhile, it was worth noting that the CVs spectra of PDDA and PDDA/SWCNTs modified GCE electrode include two pairs cathodic and anodic peak currents, while after modification the HNCNs, the above two pairs cathodic and anodic peak currents evolving into a single cathodic and anodic peak currents was observed by Figure 3. This phenomenon might be clearly explained that the PDDA has also some the active nitrogen center, and resulting decreasing overpotential in the catalytic ferricyanide-redox reaction (~90 mV) accompanied by the traditional electronic transmission process (~200 mV). When PDDA involving SWCNTs surface, the active nitrogen center of PDDA/SWCNTs nanocomposite relatively decrease, resulting greatly decrease of peak current at 90 mV and increase of peak current at 200 mV. Therefore, the decreasing overpotential of the hybrid nanofilm could be obviously improved due to the electron withdrawing ability of the N atoms from the HNCNs can create net positive charge on the adjacent carbon atoms in the PDDA/SWCNTs plane [27-28].
Meanwhile, the different scan rates of the HNCNs/PDDA/SWCNTs modified GCE in the 5 mM [Fe(CN)6]3−/4− (1:1) containing 0.1 M KCl solution were investigated by CVs (Figure S2A). It is
[image:6.596.190.405.530.698.2]seen that a pair of narrow and well-defined quasi-reversible anodic and cathodic peaks are presented, and the redox peak currents increased continuously with increasing the scan rate from 10 to 200 mV s−1 (SI, Figure S2B), which might be related to thin layer electrochemistry due to the porous structure of the HNCNs/PDDA/SWCNTs nanocomposite-modified electrode. These results indicate that the electroconductibility of the containing N nanomaterial would become dominant, and thus plays an important role in facilitating the electron transfer and decreasing overpotential.
Figure 3. A CVs obtained at bare GCE (a), HNCNs/GCE (b), PDDA/GCE (c), PDDA/SWCNTs/GCE (d) and HNCNs/PDDA/SWCNTs/GCE (e) in 0.1 M KCl containing 5 mM [Fe(CN)6]
3−/4−
3.3 Mechanism of Ag+ ion detection by HNCNs/PDDA/SWCNTs nanocomposite modified GCE
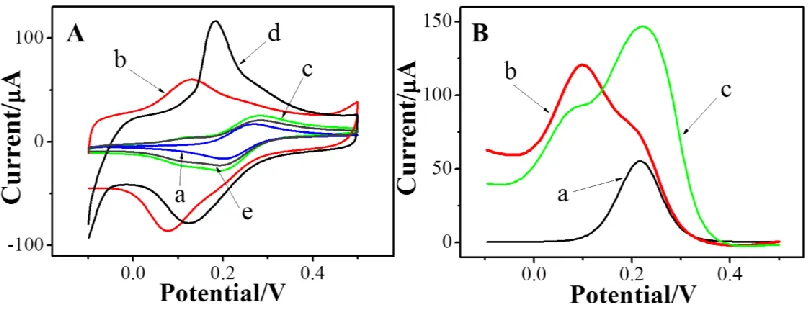
To explore the feasibility of using such HNCNs/PDDA/SWCNTs nanocomposite modified GCE for Ag+ ion detection, the electrochemical response to Ag+ ions was researched (Figure 4). It could be easily observed that the HNCNs/PDDA/SWCNTs/GCE presents a well-defined cathodic and anodic peak currents at Ep of ~90 mV (bare GCE, Ep=200 mV, Figure 4A, curve a), however, when the nanocomposite modified GCE incubated with Ag+ ion, the Ep of the Ag+/HNCNs/PDDA/SWCNTs/GCE positively shifts ∼65 mV comparing to the before incubated electrode, which could be attributed to the highly specific Ag+-N interaction between Ag+ ion and the active N of fluorescent HNCNs [2, 7]. That is, high N-containing HNCNs/PDDA/SWCNTs modified GCE can reduce the overpotential in the catalytic ferricyanide-redox reaction (Figure 4A, curve b), and when the modified GCE incubated with Ag+ ion, the lots of independence of the active nitrogen center from the surface of HNCNs/PDDA/SWCNTs would specifically combine Ag+ ions via robust Ag+-N interaction [2], which relatively decrease the nitrogen content of HNCNs/PDDA/SWCNTs, resulting greatly positive shift of the Ep (Figure 4A, curve d). As a comparative electrochemical sensor, PDDA/SWCNTs/GCE has also been studied (Figure 4A, curve c and e). From the curve c and e in the Figure 4A, it is clearly seen that the current of PDDA/SWCNTs/GCE has no tremendous change by incubated in the Ag+ ions solution. These observations suggest that the HNCNs/PDDA/SWCNTs nanocomposite modified GCE can act as a ratiometirc electrochemical sensor for Ag+ ion.
Figure 4. A) CVs of bare GCE (a), HNCNs/PDDA/SWCNTs/GCE (b), PDDA/SWCNTs/GCE (c), Ag+/HNCNs/PDDA/SWCNTs/GCE (d) and Ag+/PDDA/SWCNTs/GCE (e) in 0.1 M KCl containing 5 mM [Fe(CN)6]3−/4− (1:1) at a scan rate of 50 mV s−1, the concentration of Ag+ ion
is 50 µM. B) DPV of bare GCE (a), HNCNs/PDDA/SWCNTs/GCE (b), and Ag+/HNCNs/PDDA/SWCNTs/GCE (c) in 0.1 M KCl containing 5 mM [Fe(CN)6]3−/4− (1:1) at
a scan rate of 50 mV s−1, the concentration of Ag+ ion is 50 µM.
3.4 Amperometric detection of Ag+ ion
[image:7.596.96.501.414.569.2]
µM) of Ag+ ion solutions. Under optimal conditions (Figure S3, SI), after the Ag+ ion in the sample reacted with the active N center immobilized in the nanofilm, a DPV curve was collected (Figure 5). The DPV peak currents at 0.1 V of the redox couple of [Fe(CN)6]3−/4− decrease gradually,
simultaneously, the significant enhancement of peak currents appeared at 0.22 V with the increment of Ag+ ion concentration in the sample solution, revealing that the sensing system is sensitive to Ag+ ion concentration. It can be understood that more Ag+ ion could bind to the immobilized active N center at higher concentrations of Ag+ ion, and the Ag+-N interaction acts as an increasing overpotential for the electron-transfer of the mediator of ferricyanide. To evaluate its sensitivity more reliably, the ratiometric Ag+/HNCNs/PDDA/SWCNTs/GCE signal (I0.22V/I0.1V) also increased linearly with the
concentration of Ag+ ion from 5 nM-10 µM and 10-200 µM with a detection limit (3σ/slope) of 1.97 nM, (Figure 5B), which is similar with that of the previous reports based on electrochemical technologies (Table S1, SI), and is much lower than the limit of the 0.46 μM set by the U.S. EPA [29], and the maximum allowable level of Ag+ ions (50 ppb, ~0.30 μM) in drinking water as regulated by the World Health Organization [30]. All in all, the results suggest that the HNCNs/PDDA/SWCNTs nanocomposite modified electrode is potentially adaptive for quantitative determination of trace Ag+ ion concentrations in a ratiometric manner.
Figure 5. A) DPV curves of the HNCNs/PDDA/SWCNTs/GCE sensor after incubating with various concentrations of Ag+ ion in 50 mM pH 7.0 Tris-HNO3 solution containing 5 mM
[Fe(CN)6]3−/4−. B) Ratio calibration curve of the sensor for Ag+ ion determination. The DPV
was performed from -0.1 to 0.5 V with pulse amplitude of 50 mV, pulse width of 50 ms, sample width of 0.0167 s and pulse period of 0.2 s.
3.5 Anti-interference and stability
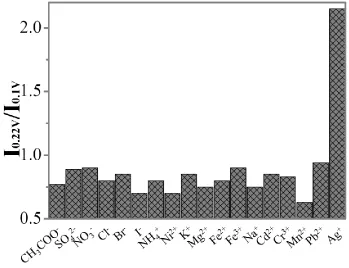
Except sensitivity, selectivity is another important parameter to evaluate the performance of the electrochemical sensing system. Under the optimal conditions, it is essential to compare the current ratiometric recovery responses of the HNCNs/PDDA/SWCNTs/GCE upon the addition of Ag+ ion or some interfering substances, as a model interference experiment, including cations and anions such as Cl-, Br-, I-, NO3-, SO42-, CH3COO-, NH4+, Ni2+, K+, Mg2+, Fe2+, Fe3+, Na+, Cd2+, Cr3+, Mn2+, and Pb2+,
[image:8.596.98.499.372.525.2]
[I0.22V/I0.1V] was observed for HNCNs/PDDA/SWCNTs/GCE upon incubation of Ag+ ion. In contrast,
no tremendous increase was observed by incubation other cations and anions to the HNCNs/PDDA/SWCNTs/GCE. The results indicate that the present electrochemical sensing platform exhibits the high selectivity requirements for the Ag+ ion assay even under the sophisticated environment.
The stability was investigated over a week period when the sensor was stored at 4 °C. The sensor remained 95.06% of its original current after a week, and no obvious change of the amperometric response was found over this period, indicating the effective retention of the N activity of the immobilized N-containing nanofilm. The excellent selectivity and stability of the sensor indicated that the 3D HNCNs/PDDA/SWCNTs nanocomposite structure was very efficient for retaining the N active center of the immobilized N-containing nanofilm.
3.6 Analysis of real sample
To evaluate the feasibility of the proposed method for routine analysis, the HNCNs/PDDA/SWCNTs/GCE was used for the determination of Ag+ ion in Lake water. Recovery studies on the samples were completed by incubating Ag+ ion standard solutions. The obtained results are shown in Table S2. Although the addition of Lake water has some influence on the conductivity of solution, good recoveries (˂105.28%) of Ag+
[image:9.596.122.471.437.705.2]ion is still acquired. These results indicate that HNCNs/PDDA/SWCNTs/GCE is promising for practical applications in determination of Ag+ ion.
4. CONCLUSIONS
In this paper, a novel and reliable ratiometric electrochemical sensor based on HNCNs/PDDA/SWCNTs nanocomposite modified GCE in a [Fe(CN)6]3−/4− solution was developed to
detect Ag+ ion with high sensitivity. Furthermore, the ratiometric electrochemical sensing strategy is immune to the influence from external factors, showing an improved electrochemical sensing performance and reproducibility. The resulted Ag+ ion ratiometric sensor based on the HNCNs/PDDA/SWCNTs nanocomposites exhibited a wide liner range from 5 nM-200 µM and a lower detection limit of 1.97 nM with a good reproducibility, high selectivity and along-term stability. In addition, the ratiometric electrochemical sensor was demonstrated as an amperometric sensor for analysis of Ag+ ions in real water samples with satisfactory results, which indicated its potential for practical applications.
[image:10.596.201.399.321.472.2]SUPPORTING INFORMATION
Figure S1. UV-vis spectra of HNCNs (red line), SWCNTs (black line) and HNCNs/PDDA/SWCNTs (blue line).
Figure S2. (A) CVs of the HNCNs/PDDA/SWCNTs/GCE at different scan rates in pH 7.0 Tris-HNO3
[image:10.596.89.507.541.699.2]
Figure S3 Effects of incubation time on the current responses of the developed sensor.
Table S1 Comparison of the linear range and detect limit for Ag+ ion using different electrochemical sensors.
Metal ion Method Linear range Detect limit Reference
Ag+ ion Electrochemical
method Not given 0.65 nM
Anal. Methods, 8(2016), 5712. Ag+ ion Electrochemical
method 20-200 nM 1.15 nM
Anal. Chem., 87(2015), 7250. Ag+ ion Electrochemical
method Not given 2 nM
Int. J. Electrochem. Sci., 10(2015), 3478. Ag+ ion Electrochemical
[image:11.596.44.555.358.471.2]method 5 nM-200 μM 1.97 nM Our method
Table S2 Determination of Ag+ ion in different Lake water samples.
Sample Metal ion Measured
(μM) Added (μM) Found (μM) Recovery (%)
RSD (n=5, %)
Lake water1 Ag+ ion ~0 100.0 105.28 105.28 3.78
Lake water2 Ag+ ion ~0 200.0 209.36 104.68 4.68
ACKNOWLEDGEMENTS
References
1. M. Li, H. Gou, I.A. Ogaidi, N. Wu, ACS Sustain. Chem. Eng. 1 (2013) 713. 2. Z.X. Wang, S.N. Ding, Anal. Chem. 86 (2014) 7436.
3. A. Chatterjee, M. Santra, N. Won, S. Kim, J.K. Kim, S. B. Kim, K.H. Ahn, J. Am. Chem. Soc. 131 (2009) 2040.
4. Z. Zhang, Q.H. Jiang, Y.L. Liu, X.Q. Sun, Y. Kong, H.T. Xi, Int. J. Electrochem. Sci. 10 (2015) 3478.
5. Y.Q. Wen, F.F. Xing, S.J. He, S. P. Song, L.H. Wang, Y.T. Long, D.Li, C. H. Fan, Chem. Commun. 46 (2010) 2596.
6. T.W. Purcell, J.J. Peters, Environ. Toxicol. Chem. 17 (1998) 539. 7. Z.X. Wang, F.Y. Kong, W. Wang, Chem. Euro. J. 23 (2017) 665.
8. A. Chatterjee, M. Santra, N. Won, S. Kim, J.K. Kim, S.B. Kim, K.H. Ahn, J. Am. Chem. Soc. 131 (2009) 2040.
9. O.A. Omran, Int. J. Electrochem. Sci. 11 (2016) 4729.
10. H. Jin, R. Gui, J. Yu, W. Lv, Z. Wang, Biosen. Bioelectron. 91 (2017) 523.
11. K. W. Ren, J. Wu, F. Yan, Y. Zhang, H.X. Ju, Biosens. Bioelectron. 66 (2015) 345. 12. H.R. Zhang, J.J. Xu, H.Y. Chen, Anal. Chem. 85 (2013) 5321.
13. P. Wu, X.D. Hou, J.J. Xu, H.Y. Chen, Nanoscale. 8 (2016) 8427.
14. X.M. Chen, Z.J. Lin, Z.M. Cai, X. Chen, M. Oyama, X.R. Wang, J. Nanosci. Nanotechnol. 9 (2009) 2413.
15. Y. Du, B.J. Lim, B.L. Li, Y.S. Jiang, J.L. Sessler, A.D. Ellington, Anal. Chem. 86 (2014) 8010.
16. Y. Wu, T. Jiang, Z. Wu, R. Yu, Biosen. Bioelectron. 99 (2018) 646.
17. X.E. Zhao, C. Lei, Y. Gao, H. Gao, S. Zhu, X. Yang, J. You, H.Wang, Sens. Actuators. B. 253 (2017) 239.
18. H. Wang, P. Zhang, J. Chen, Y. Li, M. Yu, Y. Long, P. Yi, Sens. Actuators. B. 242 (2017) 818.
19. Y. Luo, L. Zhang, W. Liu, Y. Yu, Y. Tian, Angew. Chem. 54 (2015) 14053.
20. L. Wang, C. Gong, Y. Shen, W. Ye, M. Xu, Y. Song. Sens. Actuators. B. 242 (2017) 625. 21. L. Zhang, Y. Han, F. Zhao, G. Shi, Y. Tian. Anal. Chem. 87 (2015) 2931.
22. Y. Du, B. Lim, B. Li, Y. Jiang, J. Sessler, A. Ellington, Anal. Chem. 86 (2014) 8010. 23. K. Ren, J. Wu, F. Yan, H. Ju, Sci. Rep. 4 (2014) 4360.
24. Z.X. Wang, J.Y. Wang, X.H. Yu, F.Y. Kong, W.J. Wang, W.X. Lv, L. Ge, W. Wang, Sens. Actuators. B. 246 (2017) 726.
25. R.P. Liang, Z.X. Wang, L. Zhang, J.D. Qiu, Sens. Actuators. B. 166(2016) 569.
26. S.N. Ding, J.F. Chen, J. Xia, Y.H. Wang, S. Cosnier, Electrochem. Commun. 34 (2013) 339. 27. S. Wang, D. Yu, L. Dai, J. Am. Chem. Soc. 133 (2011) 5182.
28. S. Zhang, P. Kang, S. Ubnoske, M.K. Brennaman, N. Song, R.L. House, J.T. Glass, T.J. Meyer, J. Am. Chem. Soc. 136 (2014) 7845.
29. P.C. Chen, T.Y. Yeh, C.M. Ou, C.C. Shih, H.T. Chang, Nanoscale 5 (2013), 4691. 30. J. Bartram, World Health Organization, Geneva 2004.
![Figure 3. A CVs obtained at bare GCE (a), HNCNs/GCE (b), PDDA/GCE (c), PDDA/SWCNTs/GCE (d) and HNCNs/PDDA/SWCNTs/GCE (e) in 0.1 M KCl containing 5 mM [Fe(CN)6]3−/4− (1:1) within the potential range of -0.1-0.5 V at a scan rate of 50 mV s−1, respectively](https://thumb-us.123doks.com/thumbv2/123dok_us/1783656.132554/6.596.190.405.530.698/figure-obtained-hncns-swcnts-swcnts-containing-potential-respectively.webp)
![Figure 5. A) DPV curves of the HNCNs/PDDA/SWCNTs/GCE sensor after incubating with various concentrations of Ag+ ion in 50 mM pH 7.0 Tris-HNO3 solution containing 5 mM [Fe(CN)6]3−/4−](https://thumb-us.123doks.com/thumbv2/123dok_us/1783656.132554/8.596.98.499.372.525/figure-swcnts-sensor-incubating-various-concentrations-solution-containing.webp)