Int. J. Electrochem. Sci., 14 (2019) 651 – 661, doi: 10.20964/2019.01.01
International Journal of
ELECTROCHEMICAL
SCIENCE
www.electrochemsci.org
Analysis on the Rapid Voltage Drop Based on a New Air-Cooled
PEMFC Stack Design
Mingruo Hu*, Zhenpeng Li, Guangyi Cao
Green Electrochemical System and Structure Lab, Institute of Fuel Cell,
Shanghai Jiao Tong University, 800 Dong Chuan Road, Shanghai 200240, China
*E-mail: [email protected]
Received: 1 July 2018 / Accepted: 20 August 2018 / Published: 30 November 2018
A new structure called Membrane-Electrode-Assembly-Plate unit with lateral hydrogen tube is developed, which binding the periphery of the anode face of a bipolar plate with the periphery of the anode side of a membrane electrode assembly by using silicone adhesive. An air-cooled proton exchange membrane fuel cell stack is assembled through stacking forty Membrane-Electrode-Assembly-Plate units and mounting two hydrogen external manifolds. Consequently, the possibility of hydrogen leakage to the cathode side is excluded completely. The maximum power can temporarily reach 351.60 W at 20.0 A. Eight-hour stack stability is tested at a constant current of 4.77 A, i.e., 100 mAcm-2. The average voltage drop rate of single cell is calculated as 0.852 mVh-1. It is explained that the rapid stack voltage drop during eight-hour operation is caused by the formation, accumulation and spread of liquid water inside both the anode and cathode gas diffusion layers and is reversible.
Keywords: air-cooled PEMFC stack; open-cathode; sealing; voltage drop; flooding
1. INTRODUCTION
to remove excessive heat. In addition, hydrogen is normally used without humidification. Therefore, no humidifier and other cooling loop are needed in an air-cooled PEMFC system, which simplifies the system and also reduces its weight.
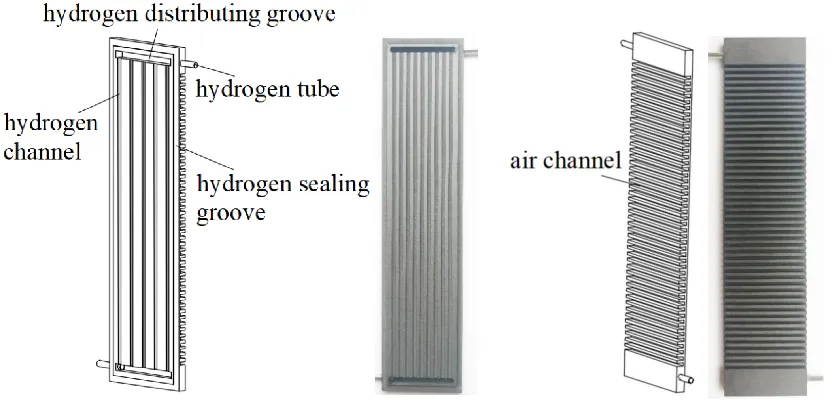
Several researchers have designed and fabricated their air-cooled PEMFC stacks ranging from several watts to 2kW [3-7]. Due to the air channels passing through the whole width of a bipolar plate as shown in Fig. 1-a, no flat area exists in each end of the cathode air channels. This means the sealing design of an air-cooled stack would be different from that of a water-cooled stack. In a water-cooled stack, an elastomeric gasket extending from a MEA is arranged into the sealing groove on a bipolar plate [8]. The elastomeric gasket is deformed after tightening force is exerted on the stack by using screws and nuts. Therefore, tight sealing is formed and then proper electric contact is guaranteed. However, in an air-cooled stack, a whole elastomeric gasket is difficult to be used because there is no flat area (existing in each end of cathode air channels) to form the sealing groove. To solve this problem, Lopez-Sabiron et al [6] combined both adhesive and O-rings for sealing. In their case, a flat area, which is parallel to the cathode air channels, was designed at each side of the flow field. MEA was glued with the anode side of a bipolar plate. O-rings were placed in their seats on the flat area of the cathode side of a bipolar plate, and were deformed by tightening force to form sealing and thus to ensure a proper electric contact. However, the two side flat areas decreased the effective area utilization of a bipolar plate, which means both the weight and volume were increased. Kim et al [9] designed a more compacted bipolar plate. They glued the membrane which extended from a MEA with the anode face of a bipolar plate. Orifices were formed on both the gas diffusion layers (GDLs) and the membrane of the MEA and also on the cathode bipolar plate. A silicone tube manifold went through these orifices to supply hydrogen to the anode flow field. However, when hydrogen passes through the thickness direction of a bipolar plate, there still exists the possibility of leaking hydrogen to the cathode side if the O-rings in [6] or the silicone tube manifold in [9] is failure or misplaced. Based on the above analysis, the integration design of sealing function, proper electric contact, gas manifold and high area utilization for the bipolar plate of an air-cooled stack would not always be as perfect as planned.
When considering the portability of an air-cooled PEMFC system, the weight and size of a hydrogen cylinder are restricted. Therefore, the continuous operation of such a system is normally limited to several hours. The stability research of an air-cooled PEMFC stack during a several-hour test is important because its structure and operating condition are totally different from those of a water-cooled PEMFC stack. Only few articles presented the stability data of tens of minutes to five hours [2, 10-13], i.e. voltage varied with time (V-t) at a constant current. It can be easily found in [2, 10-13] the average voltage drop rate of single cell reaches millivolt per hour level, which is one or two magnitude larger than that of the conventional water-cooled stack [14]. But no research has explained the reasons for the rapid voltage drop. Based on the above analysis, it was initially thought the previous sealing designs given in [6, 9] might cause minor leakage of hydrogen to the cathode of a stack to induce the rapid voltage drop.
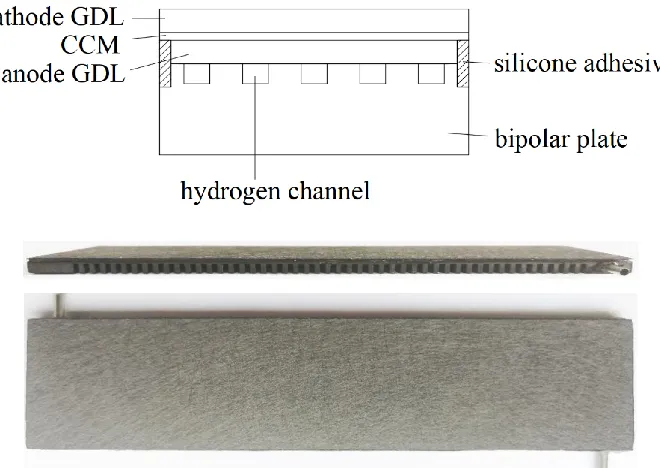
the possibility of hydrogen leakage to the cathode side is excluded entirely. In this new design, a cathode GDL has the same area as the cathode face of a bipolar plate as shown in Fig. 1-c, which means good electric contact can be guaranteed when they touch each other. Hence, the functions of sealing, electric contact and gas manifold are separated from each other in the new design, and high area utilization of a bipolar plate could be reached in the meantime. Based on the new design, eight-hour voltage stability is tested and detailed analysis and explanation on the rapid voltage drop are given.
2. STRUCTURE DESIGN OF THE AIR-COOLED PEMFC STACK 2.1. Design and fabrication of the MEA-Plate
The schematic and the appearance of the bipolar plate are shown in Fig. 1-a. Hydrogen tubes are inserted into the graphite plate laterally and are stuck to it with sealant. A hydrogen distributing groove is connected to a hydrogen tube to distribute hydrogen to the hydrogen channels. Hydrogen sealing groove is formed at the periphery of the graphite plate to accommodation the silicone adhesive and also restrict the position of the adhesive. Air channels are formed across the width direction of the bipolar plate.
[image:3.596.92.508.491.694.2]The schematic and the appearance of the MEA are shown in Fig. 1-b. The size of a homemade catalyst coated membrane (CCM) [15] and the size of a homemade cathode GDL are the same, and both are larger than that of an anode GDL. After these three layers are hot-pressed, a hydrogen sealing groove is naturally formed on the periphery of the MEA. This means the height of the hydrogen sealing groove is the same as the thickness of the anode GDL.
[image:4.596.133.463.313.547.2]
Figure 1-b Schematic and appearance of the MEA
Figure 1-c Schematic and appearance of the MEA-Plate unit Figure 1. Design and fabrication of the MEA-Plate
[image:5.596.95.503.99.280.2]
2.2. Fabrication of the stack
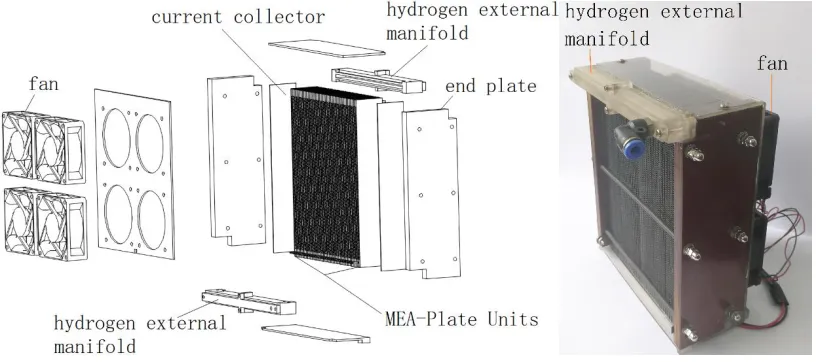
Figure 2. Schematic and appearance of the air-cooled PEMFC stack
As shown in Fig. 2, MEA-Plate units and two current collectors are stacked between two end plates by using screws and nuts. Then, hydrogen tubes on the same side are inserted into the hydrogen external manifold and then sealed. Finally, fans and other small parts are installed onto the stack.
[image:5.596.54.548.574.752.2]Hydrogen enters into the hydrogen external manifold, where it is distributed to each lateral hydrogen tube and then is transported to the corresponding hydrogen flow field on each bipolar plate. Air is sucked into air channels by DC fans to supply oxygen and coolant to the stack. Therefore, the possibility of hydrogen leakage to the cathode side through the sealing structure is excluded. The design parameters of the new air-cooled PEMFC stack are concluded in Table 1. Furthermore, as shown in Table 1, a thicker membrane, i.e., Nafion 212, is used in order to prevent the possible hydrogen leakage derived from fabricating MEAs. Two-bar (absolute pressure) pure nitrogen was kept inside the stack anode for one hour, and no pressure change was found. Consequently, the possibility of hydrogen leakage to the cathode side is excluded completely.
Table 1. Design parameters of the new air-cooled PEMFC stack
Part Item Data
MEA
Active area of the MEA 47.7 cm2
Anode Pt loading 0.2 mg cm-2
(Johnson Matthey 4100)
Cathode Pt loading 0.4 mg cm-2
(Johnson Matthey 4100)
Membrane Nafion 212(Dupont)
Carbon paper TGP-H-060(Toray)
Graphite bipolar plate Length x Width x Thickness 18.9 cm x 3.3 cm x 0.3 cm Stack
(including fans)
Number of MEA-Plate
Height x Width x
Thickness 19.9 cm x 16.2 cm x 10.6 cm
Fan Number 4
Power 12 V x 0.62 A
Weight 2100
3. GENERAL INTRODUCTION OF THE TESTING
A Kikusui 1004W 1 kW load bank was used during the I-V curve measurement and the stability test. Four DC fans mounted on the stack were powered by a separated DC power supplier. For simplicity, the input voltage to a DC fan was kept at its rated value, i.e., 12 V during our tests, which means the air flow rate was kept at a constant value when the current was varied. During the I-V curve measurement, constant current mode was set. The current varied from 0 A to 22 A and the testing period for each current was 30 s. A constant hydrogen flow rate of 85% utilization at 22 A was set during the I-V curve test. Furthermore, during the stability test, a constant hydrogen flow rate of 85% utilization at corresponding current was set. During all tests, dry hydrogen of 99.999% entered into the stack directly without humidification, while the room temperature and humidity of the air varied a little bit because of the change of local weather.
[image:6.596.58.545.70.143.2]4. RESULTS AND DISCUSSION
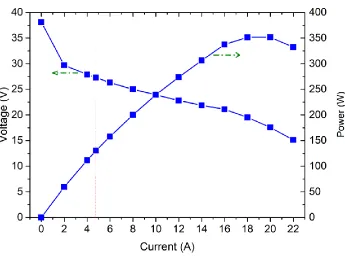
Figure 3. I-V and I-P curves of the air-cooled PEMFC stack
[image:6.596.126.471.444.700.2]
As a result, Fig. 3 presents the maximum ability that the stack could temporarily reach at each current. During the I-V test, the room temperature and relative humidity were 21 ℃ and 45%. As shown in Fig. 3, the maximum power is 351.60 W at 20.0 A (i.e., 419.3 mAcm-2) while the average cell voltage is 0.440 V at 4.77 A (denoted by the red dash dot line), i.e., 100 mAcm-2, the maximum power is 130.40 W while the average cell voltage is 0.682V.
[image:7.596.55.543.172.440.2]Figure 4. Computer screenshot of the test software interface after eight-hour V-t test
[image:7.596.162.433.479.699.2]
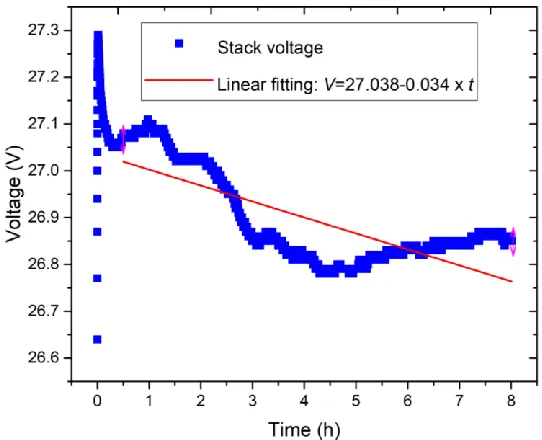
Considering a work day is normally eight hours, eight-hour stability operation of the air-cooled PEMFC stack was conducted daily during two weeks. Fig. 4 and Fig. 5 show the typical one-day data. The operating current was kept at 4.77 A, i.e., 100 mAcm-2. The average room temperature and relative humidity on that day were 20 ℃ and 55 % separately. As shown in Fig. 4, the voltage and the power are 26.85 V and 128.30 W separately at the last moment before stopping the software. It seems the green voltage line is quite flat and no obvious voltage drop could be found in this picture. However, when the voltage coordinate is zoomed in as shown in Fig. 5, it is found there still exists rapid stack voltage drop, which is similar as those recorded in [2, 10-13]. As shown in Fig. 5, the stack voltage reaches its maximum value, i.e., 27.26 V during the first 30 s and the according power is 130.03 W. After that the stack voltage decreases dramatically within the first 30 minutes. Since then the voltage becomes relatively stable. Linear fitting method is used to analyze the experimental data from the 0.5th h to the 8th h. The basic equation of linear fitting is shown in Eq. (1),
t B A
V (1)
where t represents time, V represents stack voltage, A and B are two constants, and B represents stack voltage drop rate. As shown in Fig. 5, the calculated stack voltage drop rate is 0.03409 Vh-1. This means the average voltage drop rate of a single cell is 0.852 mVh-1.
Combining Meyer’s study on the MEA of an open-cathode air-cooled PEMFC stack, the voltage characteristics shown in Fig. 5 can be explained easily. Meyer et al [16] recorded the in-plane imaging of both liquid water formation and its movement from the cathode GDL to the anode GDL by means of neutron radiography technology. The current densities they used were 500 mAcm-2 and 670 mAcm-2, which is relatively large for operating an open-cathode air-cooled PEMFC stack. Their results showed that after the load was applied no liquid water appeared at t = 0 s, but it was quickly formed and was partially accumulated inside the GDL area under the rib of the cathode flow field at t = 5 s. This means, at the very beginning just after the load is applied, oxygen could easily diffuse into the GDL area under the rib, the produced water at the cathode side humidifies the Nafion phase in the cathode catalyst layer and the cathode side of the Nafion membrane, and concentration polarizations at both the anode and cathode sides are relatively small. This explains why the stack voltage reaches its peak, i.e., 27.26 V within the first 30 s as shown in Fig. 5. However, there is no direct liquid water removal mechanism under the rib area due to low pressure air passing through the parallel straight air channels. Therefore, the results of Meyer et al [16] at t = 10 s further showed that liquid water inside the cathode GDL area under the rib diffused through the GDL to the area under the air channel, where it was evaporated and evacuated by the large convective flux of air, and back-diffused to the anode GDL and then diffused laterally in the anode GDL. This means both oxygen concentration polarization and hydrogen concentration polarization appear and increase with time because flooding is continuously spreading in the GDLs of both sides. This explains why the average voltage drop rate of single cell is large and reaches millivolt per hour level. Moreover, during our eight-hour stability tests, it was also found that the average voltage drop rate of single cell increased with the increased operating current. This phenomenon was also recorded in Dudek’s research [10]. For example, in our testing, when the operating current was
photographed by Meyer et al [16] more liquid water would appear, and flooding spread becomes faster in the GDLs of both sides. Therefore, both oxygen concentration polarization and hydrogen concentration polarization increase faster with time. As a result, the average voltage drop rate of single cell is increased. Furthermore, when humidified hydrogen was used [7], the voltage stability became even worse. This also proves both the formation and spread of liquid water are the key point for the rapid voltage drop.
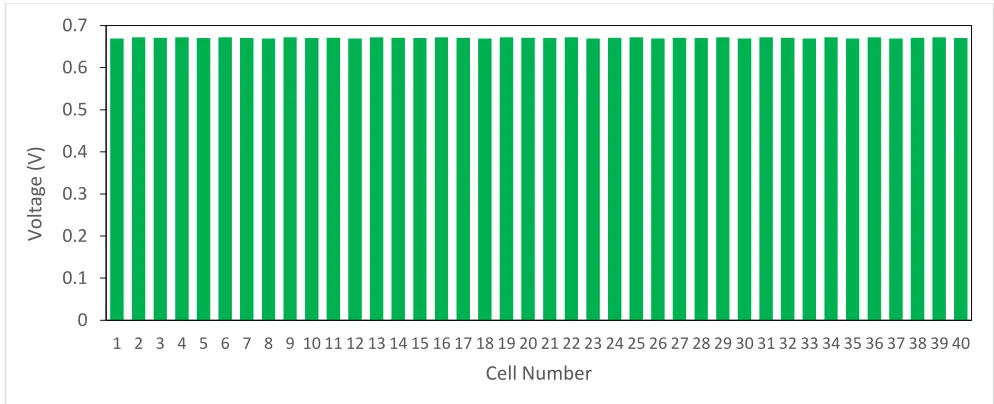
Figure 6. Voltage distribution of single cells in the air-cooled PEMFC stack
Before finishing the eight-hour operation as shown in Fig. 4, single cell voltages were measured. As shown in Fig. 6, the voltage distribution in the stack is quite even and the maximum voltage difference is 3 mV. This means the air-cooled PEMFC stack was well designed and fabricated.
During the 2-week testing, it was found that the initial voltage of the next day’s eight-hour operation could be recovered. A 16-hour shutdown period was experienced between two eight-hour operations. During the period, fans were stopped, no hydrogen was supplied, the stack hydrogen outlet was opened (allowing air to enter the anode compartment by diffusion), and the stack was finally cooled to room temperature. As shown in the research of Gazdzick et al [17], shutdown period could lead to the full recovery of reversible voltage losses. Considering our research, the recovery of reversible voltage loss was probably because the movement, redistribution and evaporation of liquid water inside both the anode and cathode GDLs relieved the flooding and increased the water membrane content at nearby area. Furthermore, similar voltage drop rate as shown in Fig. 5 could be repeated if the room temperature and humidity were similar. Therefore, no obvious irreversible voltage loss was found during the 2-week stability testing. The rapid voltage drop was reversible and was derived mainly from the formation, accumulation and spread of liquid water inside both the anode GDL and the cathode GDL.
0 0.1 0.2 0.3 0.4 0.5 0.6 0.7
1 2 3 4 5 6 7 8 9 10 11 12 13 14 15 16 17 18 19 20 21 22 23 24 25 26 27 28 29 30 31 32 33 34 35 36 37 38 39 40
Vo
lt
ag
e
(V)
[image:9.596.48.545.188.390.2]
5. CONCLUSION
A new structure called MEA-Plate unit with lateral hydrogen tube was developed, which binding the periphery of the anode face of a bipolar plate with the periphery of the anode side of a MEA by means of silicone adhesive. An air-cooled PEMFC stack was assembled through stacking forty MEA-Plate units and mounting two hydrogen external manifolds. Consequently, the possibility of hydrogen leakage to the cathode side was excluded entirely. The maximum power could temporarily reach 351.60 W at 20.0 A. Eight-hour stack stability was tested at a constant current of 4.77 A, i.e., 100 mA.cm-2. The single cell voltage distribution in the stack was quite even and the maximum voltage difference was 3 mV. By using linear fitting method, the calculated stack voltage drop rate was 0.03409 Vh-1, i.e., the average voltage drop rate of single cell was 0.852 mVh-1. Based on Meyer’s research [16] and Gazdzick’s
research [17], it was explained that the rapid voltage drop during eight-hour operation was caused by the formation, accumulation and spread of liquid water inside both the anode and cathode GDLs and was reversible.
Based on the above analysis, in order to improve the voltage stability, a point flow field may be used to relieve the flooding inside the GDL area under the whole length of a rib of the current cathode flow field; and an interdigitated flow filed [18] may be used to remove the liquid water accumulated in the
anode GDL.
ACKNOWLEDGEMENTS
This work was sponsored by Natural Science Foundation of Shanghai (Grant No. 16ZR1417000). The authors would like to give their special thanks to CHINO Corporation in Japan for donating the FC5100 PEM fuel cell test system, on which all the single cell tests were conducted during the development.
References
1. http://www.intelligent-energy.com/
2. T. Kim, S. Kwon, Int. J. Hydrogen Energy, 37 (2012) 615.
3. J. Wu, S. Galli, I. Lagana, A. Pozio, G. Monteleone, X. Z. Yuan, J. Martina, H. Wang, J. Power Sources, 188 (2009) 199.
4. D. T. S. Rosa, D. G. Pinto, V. S. Silva, R. A. Silva, C. M. Rangel, Int. J. Hydrogen Energy, 32 (2007) 4350.
5. H. Pei, J. Shen, Y. Cai, Z. Tu, Z. Wan, Z. Liu, W. Liu, Appl. Therm. Energy, 63 (2014) 227. 6. A. M. Lopez-Sabiron, J. Barroso, V. Roda, J. Barranco, A. Lozano, F. Barreras, Int. J. Hydrogen
Energy, 37 (2012) 7289.
7. Z. M. Huang, A. Su, Y. C. Liu, Energy, 72 (2014) 547. 8. D. H. Ye, Z. G. Zhan, J. Power Sources, 231 (2013) 285. 9. M. Kim, D. G. Lee, J. Power Sources, 315 (2016) 86.
10. M. Dudek, P. Tomczyk, P. Wygonik, M. Korkosz, P. Bogusz, B. Lis, Int. J. Electrochem. Science, 8 (2013) 8442.
11. K. Kim, T. Kim, K. Lee, S. Kwon, J. Power Sources, 196 (2011) 9069.
12. B. Wu, B. Li, W. Liu, J. Liu, M. Zhao, Y. Yao, J. Gu, Z. Zou, Int. J. Hydrogen Energy, 38 (2013) 10978.
15. M. Hu, S. Sui, X. Zhu, Q. Yu, G. Cao, X. Hong, H. Tu, Int. J. Hydrogen Energy, 31 (2006) 1010. 16. Q. Meyer, S. Ashton, P. Boillat, M. Cochet, E. Engebretsen, D. P. Finegan, X. Lu, J. J. Bailey, N.
Mansora, R. Abdulaziz, O. O. Taiwo, R. Jervis, S. Torija, P. Benson, S. Foster, P. Adcock, P. R. Shearing, D. J. L. Brett, Electrochim. Acta, 211 (2016) 478.
17. P. Gazdzick, J. Mitzel, D. G. Sanchez, J. Power Sources, 327 (2016) 86.
18. M. Hu, A. Gu, M. Wang, X. Zhu, Energ. Convers. Management, 45 (2004)1861.