This is a repository copy of Investigation of Non-linear Chirp Coding for Improved Second
Harmonic Pulse Compression.
White Rose Research Online URL for this paper: http://eprints.whiterose.ac.uk/116334/
Version: Accepted Version
Article:
Arif, M, Ali, MA, Shaikh, MM et al. (1 more author) (2017) Investigation of Non-linear Chirp Coding for Improved Second Harmonic Pulse Compression. Ultrasound in Medicine & Biology, 43 (8). pp. 1690-1702. ISSN 0301-5629
https://doi.org/10.1016/j.ultrasmedbio.2017.03.005
© 2017 World Federation for Ultrasound in Medicine & Biology. This manuscript version is made available under the CC-BY-NC-ND 4.0 license
http://creativecommons.org/licenses/by-nc-nd/4.0/
Reuse
Items deposited in White Rose Research Online are protected by copyright, with all rights reserved unless indicated otherwise. They may be downloaded and/or printed for private study, or other acts as permitted by national copyright laws. The publisher or other rights holders may allow further reproduction and re-use of the full text version. This is indicated by the licence information on the White Rose Research Online record for the item.
Takedown
If you consider content in White Rose Research Online to be in breach of UK law, please notify us by
Investigation of Nonlinear Chirp Coding for Improved
Second Harmonic Pulse Compression
Muhammad Arifa,∗, Muhammad Asim Alib, Muhammad Mujtaba Shaikhc,
Steven Freeard, Corresponding Author∗
a
Department of Biomedical Engineering, Mehran University of Engineering and Technology, Jamshoro, Pakistan
b
Department of Electrical Engineering, Sukkur Institute of Business Adminstration, Sukkur, Pakistan
c
Department of Basic Sciences and Related Studies, Mehran University of Engineering and Technology, Jamshoro, Pakistan
d
School of Electronic and Electrical Engineering, University of Leeds, Leeds, UK
Abstract
In this paper, a nonlinear frequency-modulated (NLFM) chirp coding was
investigated to improve the pulse compression of the second harmonic chirp
signal by reducing the range sidelobes level. The problem of spectral
over-lapping between fundamental and second harmonic component (SHC) was
also investigated. Therefore, two methods were proposed, method-I show the
scenario of non-overlap condition and method-II with pulse inversion
tech-nique was used for overlap harmonic condition. In both methods, the
perfor-mance of the NLFM chirp was compared with the reference linear
frequency-modulated (LFM) chirp signals. Experiments were performed using a 2.25
∗Corresponding Author: Muhammad Arif
Postal Address: Department of Biomedical Engineering, Mehran University of Engineering & Technology, Jamshoro, 76062, Sindh, Pakistan
Phone: +92 (22) 2772250-73, Ext: 7016 Email: [email protected]
MHz transducer mounted coaxially at a distance of 5 cm with a 1 mm
hy-drophone in a water tank and the peak negative pressure of 300 kPa was
set at the receiver. Both simulations and experimental results show that the
peak sidelobe level (PSL) of the compressed SHC of NFLM chirp was
im-proved by at least 13 dB in method-I and 5 dB in method-II when compared
with the PSL of LFM chirps. Similarly, the integrated sidelobe level (ISL)
of the compressed SHC of NLFM chirp was improved by at least 8 dB when
compared with the ISL of LFM chirps. In both methods, the axial mainlobe
width of the compressed NLFM chirp was comparable to the LFM signals.
The signal-to-noise ratio of the SHC of NLFM was improved by up to 0.8 dB,
when compared with the SHC of LFM signal having the same energy level.
Results were also presented which show the robustness of NLFM chirp under
a frequency dependent attenuation of 0.5 dB/[cm×MHz] up to penetration
depth of 5 cm and a Doppler shift of up to 12 kHz.
Introduction 1
In recent years, ultrasound harmonic imaging has become prevalent in
2
commercial medical ultrasound imaging systems. Ultrasound harmonic
imag-3
ing relies on the second or higher order harmonic components. In tissue
4
harmonic imaging, these nonlinear harmonics are produced by finite
ampli-5
tude distortion of ultrasound waves propagating through biological tissue
6
(Duck,2010). Whereas in ultrasound contrast imaging, these harmonics are
7
produced by the nonlinear scattering from contrast microbubbles (de Jong
8
et al.,2002;Maresca et al.,2014). Ultrasound images based on the nonlinear
9
second harmonic component (SHC) provide improved spatial resolution with
10
reduced reverberation artifacts when compared to conventional
(fundamen-11
tal) B-mode imaging (Jensen, 2007; Wells, 2006).
12
Coded excitation techniques were originally introduced in radar
commu-13
nication and now are widely used in medical ultrasound imaging systems
14
to provide improved signal-to-noise ratio (SNR) (Cook and Bernfeld, 1967;
15
Chiao and Hao, 2005). Coded excitation with long duration linear frequency
16
modulated (LFM) chirp signals offer the potential to improve the SNR of
17
the SHC. This can be done without increasing the peak excitation pressure
18
or mechanical index (MI) and without reducing the system frame-rate (
Cob-19
bold,2007). However, on the receiving side of the system, harmonic matched
20
filters are typically used to extract and compress the SHC and to recover
sig-21
nal axial resolution (Kim et al., 2001; Arif et al., 2010a). The SNR of a
22
chirp signal depends on the time-bandwidth product (TBP) and can also
23
be improved by extending the signal bandwidth. However, in ultrasound
24
harmonic imaging application, the signal bandwidth extension is restricted
by the finite bandwidth of the ultrasound transducer to accommodate both
26
the fundamental and the SHC, and the spectral overlapping between the
27
fundamental and the SHC (Averkiou,2000).
28
The power spectrum of an unweighted LFM chirp is approximately
rect-29
angular in shape and yields a sinc-like function after pulse compression. The
30
compressed chirp signal contains a peak sidelobe level (PSL) at ∼ -13 dB.
31
This higher value of PSL will mask out the mainlobe width (MLW) from the
32
weak scatterer and will potentially degrade the image contrast by appearing
33
as false echoes. Therefore, the higher values of the PSL are unacceptable in
34
modern medical ultrasound imaging systems operating at a dynamic range
35
of more than 60 dB (Johnston and Fairhead, 1986; Misaridis and Jensen,
36
2005b).
37
In order to reduce the higher PSL of the compressed chirp signal, a strong
38
weighting function is applied either on the transmitting signal or on the
re-39
ceived matched filter; the latter case is termed a mismatched filter.
Window-40
ing on the excitation signal causes a reduction in the transmitting energy and
41
hence penetration depth, whilst windowing on the matched filter results in
42
reduced gain in the SNR and axial resolution. Therefore, a tradeoff between
43
the MLW and PSL is exist in the pulse compression process of the LFM
44
signal (Adams, 1991; Milleit, 1970).
45
Nonlinear frequency modulated (NLFM) chirp signals provide an
alter-46
native means to modify the rectangular power spectrum of the LFM chirp
47
into a desirable shape. The NLFM chirp can be designed to optimise the
48
signal transmitting energy and the shape of the power spectrum so that it
49
matches spectrally with the transfer function of the transducer. This
sults in more energy transmitted though the transducer which potentially
51
improve the SNR and penetration depth. Also, reduced PSL will be get
af-52
ter pulse compression without using any additional windowing function on
53
the matched filter (Harput et al., 2013; Arif et al.,2010b; Gran and Jensen,
54
2007; Pollakowski and Ermert,1994).
55
The effects of shaping the transmitting spectrum using the NLFM chirp
56
for improved spectral matching with the transmitter were first studied by PS.
57
Brandon (Brandon,1973). He had designed the nonlinear pulse compression
58
system for radar to get the high resolution with reduced loss in the SNR.
59
The NLFM chirp was designed using the least squares optimization method
60
for synthetic transmit aperture B-mode imaging (Gran and Jensen, 2007).
61
The NLFM signal with the quadratic instantaneous frequency function was
62
designed and implemented for tissue harmonic imaging (Song et al.,2011).
63
In this paper, NLFM chirp coding was investigated as an excitation
64
scheme in the area of ultrasound harmonic imaging. The aim was to
re-65
duce the PSL after pulse compression and to improve the SNR of the second
66
harmonic chirp component.
67
The remaining sections of the paper are divided as follows: Section-II
68
describes the basic theory and design methods of NLFM and reference LFM
69
chirp signals, Section-III describes about the proposed methods, Section-IV
70
describes the simulation and experimental procedures with the post
process-71
ing of nonlinear received signals, the results of harmonic pulse compression
72
and Doppler sensitivity evaluation of designed chirp signals are examined in
73
Section-V, and finally the performance of second harmonic pulse compression
74
achieved using the Nonlinear chirp coding is discussed in Section-VI.
Theory and Signal Design 76
Nonlinear Frequency Modulated (NLFM) Signals
77
In exponential form, the time domain chirp signalx(t) can be expressed
78
as Misaridis and Jensen (2005a),
79
x(t) =p(t)ej2πφ(t) (1)
where p(t) and φ(t) are the amplitude and phase modulation functions
80
of the chirp signal, respectively.
81
The spectrum of the chirp signal given in (1) is expressed as,
82
X(ω) =
Z ∞
−∞
p(t)ej{−ωt+φ(t)}dt (2)
The integrand [−ωt+φ(t)] in (2) is an oscillating function which is varying
83
at the rate of d
dt[−ωt+φ(t)]. The major contribution to the chirp spectrum 84
occurs when the rate of change of oscillating function is minimal and is also
85
referred to as the stationary phase point, this can be expressed as
86
d
dt[−ωt+φ(t)] = 0 (3)
In (3), ω and t are two independent variables. Therefore, the particular
87
value of t that can satisfy the condition given in (3) can be found by
assum-88
ing the value of ω. In the case of an LFM signal with a quadratic phase
89
modulation function, the integral in (2) can be solved analytically. However,
90
in the case of nonlinear phase modulation function, the second order Taylor
91
expansion of phase φ(t) around tk which is the solution of the (3) at ωk is 92
used to reduce the integral in (2) to Fresnel integral. Hence after algebraic
manipulation, the power spectrum of the chirp signal atωkis given by (Cook 94
and Bernfeld, 1967),(Collins and Atkins,1999), (Arif, 2010)
95
|X(ωk)|2 ≈2π
p2(t
k) |a(tk)|
(4)
where |X(ωk)|2 is the power spectrum of the chirp signal, p(tk) is the 96
amplitude modulation function, and a(tk) is the chirp-rate function of the 97
signal.
98
In the case of an LFM signal, the term chirp-rate function a(tk) in (4) 99
is constant and the shape of the power spectrum is controlled by
modify-100
ing the amplitude modulation function p(tk) of the signal using a time or 101
frequency domain windowing function. However, in the case of the NLFM
102
signal, the shape of the power spectrum is controlled by either modifying the
103
chirp-rate function and keeping the amplitude modulation function constant
104
(rectangular envelope) or by modifying both the chirp-rate and amplitude
105
modulation functions of the signal; the latter case is known as a hybrid
de-106
sign approach. The main advantage of the hybrid design approach is that
107
the designed NLFM signal will be less sensitive to a Doppler shift caused by
108
the moving blood or tissue. However, this advantage comes at the expense of
109
reduced SNR of the transmitting signal due to amplitude tapering (Johnston
110
and Fairhead, 1986).
111
In a chirp coded excitation system, a matched filter is used on the
receiv-112
ing side to perform pulse compression of the long duration signal to recover
113
axial resolution. The matched filter will cancel out the phase information of
114
the chirp signal and therefore phase has no contribution in the axial
resolu-115
tion. The output of the matched filter is the autocorrelation function (ACF)
of the chirp signal (Girod et al., 2001).
117
Rxx(τ) = Z ∞
−∞
x(t+τ)x∗(t)dt (5)
Also the ACF of the chirp signal is the inverse Fourier transform of the
118
power spectrum and is expressed as
119
Rxx(τ) = Z ∞
−∞
|X(f)|ejφ(f)
|X(f)|e−jφ(f) ej2πf τdf
=
Z ∞
−∞
|X(f)|2ej2πf τdf
(6)
Therefore, the mainlobe width and sidelobe level of the compressed chirp
120
signal will depend on the shape of the power spectrum. Hence choosing a
121
suitable window function as a shape of the power spectrum would yield a
122
low sidelobe level after pulse compression. In this paper, NLFM signals were
123
designed using the hybrid approach and a tapered cosine window (also known
124
as a Tukey window) was selected as a shape of the desired power spectrum
125
and is expressed as (Harris,1978),
126
|X(ω)|2 =
1, 0≤ |ω| ≤βB2
1 2
h
1 + cosπ ω−βB2
2(1−β)B 2
i
, βB2 ≤ |ω| ≤ B2
(7)
whereB is the bandwidth of X(ω), and β is the envelope tapering ratio:
127
{0≤β ≤1}.
128
The tapered cosine window with a tapering ratio of 100% (β = 1) was
129
carefully chosen for two reasons. Firstly, it matches with the transfer function
130
of the ultrasound transducer used in the experiments and secondly it provides
131
reduced PSL after pulse compression of the SHC of the received NLFM signal.
The nonlinear instantaneous frequency function, fi(t), of the NLFM sig-133
nal is expressed as (Collins and Atkins, 1999),
134
fi(t) = fc+
B 2
"
αtan 2γt T
tan(γ) +
2 (1−α)t T
#
(8)
where the parametersα and γ are used to control the nonlinear curve of
135
the instantaneous frequency function. B is the sweeping bandwidth,fc is the 136
centre frequency, and T is the chirp duration.
137
The chirp-rate function, a(t), of the NLFM signal was found by taking
138
the derivative of the instantaneous frequency function, fi(t), in (8). 139
a(t) = d
dt(fi(t)) = B T
"
αγ 1 + tan2 2Tγt
tan(γ) + (1−α)
#
(9)
The amplitude modulation function, p(t), of the NLFM signal was
ob-140
tained by rearranging (4) and substituting the values of power spectrum and
141
chirp-rate function from (7) and (9).
142
p(tk)≈ q
|X(ωk)|2|a(tk)| (10)
The phase modulation function, φ(t), of the NLFM signal was obtained
143
by taking the integral of the instantaneous frequency function, fi(t), in (8) 144
with respect to time t.
145
φ(t) =
Z t
0
fi(t)dt, 0≤ t ≤ T (11)
Finally, the NLFM signal was found by substituting the values of the
146
amplitude modulation function p(t), and the phase modulation functionφ(t)
147
from (10) and (11) into (1).
Linear Frequency Modulated (LFM) Signals
149
The LFM signals were designed using equation (1), where the phase
mod-150
ulation function of the LFM signal is expressed as:
151
φ(t) = B 2Tt
2+(f
c−
B
2)t+ϕ, 0≤t≤T (12)
where B is the sweeping bandwidth, T is the chirp duration, fc is the 152
centre frequency, and ϕ is the initial phase of the chirp signal and have
153
values of 0 and 0.5 for pulse inversion.
154
In this study, two LFM signals were used as a reference excitation. Each
155
signal had a duration (T) of 20 µs, and a centre frequency (fc) of 2.25 MHz. 156
The difference in each LFM signal was the transmitting energy which was set
157
by the application of tapered cosine window with envelope tapering ratios (β)
158
of 10% and 80%. Respectively after the application of a windowing function
159
the LFM signals will be termed as LFM-W10 and LFM-W80. The energy of
160
the LFM-W80 signal was set equal to the NLFM signal whereas the energy
161
of the W10 signal was 43% higher than the NLFM signal. The
LFM-162
W10 and LFM-W80 signals were designed to show the effect of different
163
windowing on the transmitting energy, power spectrum and harmonic pulse
164
compression.
165
Excitation Signals
166
The design parameters of the NLFM and reference LFM excitation signals
167
are shown in Table 1. The instantaneous frequency functions, fi(t), of the 168
NLFM, LFM-W80, and LFM-W10 signals are shown in Fig. 1(Top). The
169
instantaneous frequency function of the NLFM signal is nonlinear and is
similar in appearance to a reverse ‘S’ shape. However, the instantaneous
171
frequency functions of the LFM signals are linear. The NLFM and LFM
172
signals have equal sweeping bandwidth (B) and time duration (T).
173
The chirp-rate function,a(t), of the NLFM signal shows higher values at
174
the edges and lower values in the middle part of the signal and appears as a
175
‘U’ shape. However, the chirp-rate functions of the LFM signals are constant
176
throughout the signal’s duration as shown in Fig. 1(Bottom). Note that both
177
the instantaneous frequency and chirp-rate functions of LFM signals have
178
equal magnitude because of the same sweeping bandwidth and duration.
179
The amplitude envelopes,p(t), of the NLFM, LFM-W80, and LFM-W10
180
excitation signals are shown in Fig. 2(Top). The amplitude envelope of
181
the LFM-W80 chirp was designed so that it can transmit acoustical energy
182
equal to the NLFM signal. The amplitude envelope of the LFM-W10 chirp
183
is nearly flat throughout the signal duration. This is due to the fact that less
184
amplitude tapering (β = 0.1) was applied. Therefore, the LFM-W10 signal
185
can transmit 43% more acoustical energy than the NLFM and LFM-W80
186
signals.
187
The power spectra of the NLFM, LFM-W80, and LFM-W10 signals are
188
shown in Fig. 2(Bottom). The transfer function (TF) of the 2.25 MHz
189
transducer used in the experiment is also shown in the figure. The TF of the
190
transducer was accounted in the design process of the NLFM signal. The
191
NLFM and reference LFM signals have same sweeping bandwidth. However,
192
their -6 dB bandwidths were different due to the different amplitude tapering
193
used in the design process. The power spectrum of the LFM-W10 signal
194
contains Fresnel-ripples in the pass band due to less amplitude tapering (β=
0.1) and their -6 dB bandwidth was 40% higher than the NLFM signal.
196
Similarly, the power spectrum of the LFM-W80 signal is smooth and contains
197
no ripples in the pass band. However, their -6 dB bandwidth was 11% higher
198
than the NLFM signal.
199
Proposed Methods 200
In this paper, two methods were proposed to show the scenarios of
non-201
overlap and overlap harmonic conditions. The proposed system flow charts
202
are shown in Fig. 3.
203
Method I: For Non-Overlap Harmonic Condition
204
Method I require a single transmission of a chirp signal with a fractional
205
bandwidth (FBW) of 20%. In the power spectrum of the received signal,
206
the nonlinear spectral harmonics do not overlap with each other due to the
207
use of narrow bandwidth chirp excitation. Therefore, the application of a
208
harmonic matched filter would yield the extraction and compression of the
209
second harmonic chirp component. Note that the bandpass filter response
210
is inherent within the harmonic matched filter specification as shown in Fig.
211
3(Top).
212
Method II: For Overlap Harmonic Condition
213
In ultrasound harmonic imaging, the bandwidth of the SHC is twice the
214
bandwidth of the fundamental frequency component Chiao and Hao (2005);
215
Misaridis and Jensen (2005b). Therefore, increasing the bandwidth of an
ex-216
citation signal will cause spectral overlapping between the fundamental and
217
the SHC. The direct application of a second harmonic matched filter under
an overlap harmonic condition will result in the production of higher range
219
sidelobes after pulse compression. Therefore, in this method before pulse
220
compression, the pulse inversion (PI) technique was proposed to extract the
221
SHC under an overlap harmonic condition. PI requires two transmissions
222
of 45% fractional bandwidth chirp signals with a phase difference of 180◦.
223
The summation of the corresponding received echoes will cancel out the
fun-224
damental component and will extract the SHC under an overlap harmonic
225
condition (Simpson et al., 1999; Ma et al., 2005). After the extraction of
226
the SHC, the application of a harmonic matched filter would yield the pulse
227
compression of the second harmonic chirp component as shown in Fig.
3(Bot-228
tom).
229
Simulation and Experimental Investigation 230
Simulations
231
The nonlinear propagation of ultrasound waves in an attenuating medium
232
was simulated using the following nonlinear model (Wojcik et al.,1998).
233
ρ∂
2u
∂t2 =−∇p, p=−ρc 2
∇ ·u+ 1 2
B
A(∇ ·u)
2
(13)
where u is the particle displacement vector, c is the speed of sound, p
234
is the acoustic pressure, ρ is the material density, and B/A is the nonlinear
235
coefficient.
236
The model was simulated in MATLAB (The MathWorks Inc., Natick,
237
MA, USA) using the time-domain based pseudo-spectral method. A detailed
238
description of the simulation method can be found in (Anderson,2000). The
simulation model was noise free and does not account for any transducer
240
geometry, therefore only plane waves were applied in simulations.
241
The performance of the pulse compression system is also affected by the
242
spectral mismatched of the receiving filter. This is caused by the frequency
243
dependent attenuation of tissue, which also limit its implementation in real
244
time imaging systems (Ramalli et al., 2015). In the case of ultrasonic
atten-245
uation, the power spectrum of the backscattered signal is frequency shifted
246
and distorted as a function of signal bandwidth and propagation depth. The
247
higher frequencies in the bandwidth are more attenuated than the lower
fre-248
quencies. This results in a reduction of the effective TBP of the signal and
249
hence the SNR (Rao,1994). Therefore, the effect of frequency dependent
at-250
tenuation as a function of bandwidth was also investigated in all simulations.
251
The frequency dependent attenuation of 0.5 dB/[cm×MHz] was considered
252
up to penetration depth of 5 cm. The simulation parameters are shown in
253
Table 2, (Hallaj et al.,2001).
254
Experimental Setup and Procedure
255
In order to validate the proposed methods, experiments were performed
256
in a tank containing deionised, degassed filtered water at the temperature
257
of 21±1◦C. The schematic diagram of the experimental setup is shown in
258
Fig. 4. The NLFM and reference LFM excitation signals were designed in
259
Matlab (The MathWorks Inc., Natick, MA, USA) and then loaded into a
260
programmable arbitrary waveform generator (AWG) (33250A Agilent
Tech-261
nologies Inc., 80 MHz, Santa Clara, CA, USA). The generated signals from
262
AWG were then amplified using an RF power amplifier (A150 Electronics &
263
Innovation Ltd., 55 dB, Rochester, NY, USA). The amplified signals were
then applied to a single element immersion transducer (V323-SM, Olympus
265
NDT Inc., Waltham, MA, USA) with a pulse repetition frequency of 100 Hz.
266
The transducer has an active element diameter of 6.35 mm, central frequency
267
of 2.25 MHz with a -6 dB FBW of 56%, and a focal length is in between 8.9
268
mm to 11.4 mm. The transducer was mounted coaxially with a hydrophone
269
at a distance of 50±0.1mm. All measurements were performed in the far
270
field of the transducer. The distance and alignment between the transducer
271
and hydrophone were controlled using a custom built computer numerical
272
control (CNC) scan system. A needle-type Polyvinylidene Fluoride (PVDF)
273
hydrophone with an active element diameter of 1.0 mm (calibrated from 1 to
274
20 MHz, Precision Acoustics Ltd., Dorchester, UK) was used to receive the
275
nonlinear signals. The pressure level of each waveform was calibrated and
276
a mechanical index (MI) of 0.2 (peak negative pressure of 300 kPa at 2.25
277
MHz) was received by the hydrophone. The average noise measurement for
278
the overall system was performed before starting the experiments. This was
279
done with the same experimental setup except that the AWG output being
280
switched off. The signals received from the hydrophone were captured 64
281
times and averaged using a digital oscilloscope (44Xi LeCroy Corporation,
282
400 MHz, Chestnut Ridge, NY, USA) at a sampling frequency of 100 MS/s
283
with 8-bit resolution. All the acquired data were stored in a computer system
284
and processed off-line using MATLAB (The MathWorks Inc., Natick, MA,
285
USA). All the received signals were corrected using an inverse filter designed
286
according to the frequency response of the hydrophone where the calibration
287
data were supplied by the manufacturer (Precision Acoustics Ltd.,
Dorch-288
ester, UK).
Post Processing of Nonlinear Received Signals
290
NLFM Received Signals
291
In the case of the NLFM signal, the shaping of the power spectrum was
292
done on the transmitting side. Therefore on the receiving side of the system,
293
the harmonic matched filter was used to perform pulse compression of the
294
SHC of the received signal. The impulse response of the harmonic matched
295
filter was the time-reversed conjugate of the NLFM chirp with twice the
296
centre frequency and bandwidth parameters so that it matches with the
297
SHC of the received signal. Also the same windowing function was used in
298
the design of the harmonic matched filter as used in the excitation signal
299
(Borsboom et al., 2005).
300
LFM Received Signals
301
Since a strong amplitude tapering (β = 0.8) was used in the design process
302
of the LFM-W80 signal, therefore a harmonic matched filter was used to
303
perform pulse compression of the SHC of the received signal. However, in the
304
case of the LFM-W10 signal, less amplitude tapering (β = 0.1) was applied to
305
the excitation signal. Hence, instead of a harmonic matched filter, a harmonic
306
mismatched filter was used on the receiving side to perform second harmonic
307
pulse compression. The harmonic mismatched filter was designed by applying
308
a Chebyshev window of 100 dB attenuation to the harmonic matched filter.
309
This results in the further reduction of PSL after pulse compression.
310
Performance Evaluation of Second Harmonic Pulse Compression
311
The performance of second harmonic pulse compression of NLFM,
LFM-312
W80 and LFM-W10 received signals was quantitatively assessed by using the
three quality parameters, namely: the mainlobe width (MLW), peak sidelobe
314
level (PSL), and integrated sidelobe level (ISL). In the compressed second
315
harmonic chirp signal, the axial resolution was evaluated by measuring the
316
MLW at -20 dB in microseconds. The PSL and ISL provide a measure of self
317
induced noise and contrast resolution. The PSL was evaluated by taking the
318
ratio of the highest sidelobes peak to mainlobe peak in decibels. The ISL
319
was computed by taking the ratio of total sidelobes power to the mainlobe
320
power in decibels (Arshadi et al.,2007), (Misaridis et al.,2000).
321
Results and Discussion 322
Simulation Results: Method I
323
The power spectra of the simulated nonlinear received signals with a FBW
324
of 20% are shown in Fig. 5. The SHC of the received NLFM, LFM-W80 and
325
LFM-W10 signals were respectively -23.5 dB, -23.8 dB and -23.3 dB below
326
the fundamental frequency component. The SHC of NLFM was improved by
327
0.3 dB when compared with the SHC of the LFM-W80 signal of same energy
328
level. The SHC of NLFM was 0.2 dB below with the SHC of the LFM-W10
329
signal.
330
The envelopes of the simulated compressed second harmonic chirp
sig-331
nals are shown in Fig. 6. The pulse compression results of second harmonic
332
chirp signals are shown in Table 3. The results showed that at least 15 dB
333
improvement in the PSL of the compressed second harmonic signal of the
334
NLFM when compared with the PSL of LFM-W80 and LFM-W10 signals.
335
The ISL of the compressed NLFM signal was improved by 9 dB when
com-336
pared with the ISL of the compressed LFM-W80 signal. Similarly the ISL of
the compressed NLFM signal was improved by 13.9 dB when compared with
338
the ISL of the compressed LFM-W10 signal. The MLW of the compressed
339
second harmonic signal of NLFM was comparable to the MLW of LFM-W80
340
and LFM-W10 signals.
341
Simulation Results: Method II
342
The power spectra of the simulated nonlinear received NLFM, LFM-W80
343
and LFM-W10 signals with a FBW of 45% are shown in Fig. 7. The SHC
344
of the NLFM was -24.1 dB, whereas the SHC of the LFM-W80 and LFM-10
345
received signals were respectively -25.0 dB and -23.5 dB below the
funda-346
mental frequency component. The SHC of NLFM was improved by 0.9 dB
347
when compared with the SHC of the LFM-W80 signal of same energy level.
348
The SHC of NLFM was 0.6 dB below with the SHC of the LFM-W10 signal.
349
The figure shows the spectral overlapping of the second harmonic with the
350
fundamental and third harmonic components. The PI technique was applied
351
to these nonlinear received signals in order to extract the SHC. After PI
pro-352
cessing the SHC of NLFM, LFM-W80 and LFM-W10 signals were improved
353
by 12 dB.
354
The envelopes of the simulated compressed second harmonic chirp signals
355
after processed with the PI are shown in Fig. 8. The results indicated that the
356
PSL of the compressed second harmonic signal of the NLFM was improved by
357
27.6 dB and 15 dB when compared with the PSL of LFM-W80 and LFM-W10
358
signals, respectively. Similarly the ISL of the compressed second harmonic
359
signal of the NLFM was improved by 13.6 dB and 12.8 dB when compared
360
with the ISL of LFM-W80 and LFM-W10 signals, respectively. The MLW of
361
the NLFM compressed second harmonic signal was higher, but comparable
to the LFM-W80 and LFM-10 signals.
363
Experimental Results: Method I
364
The power spectra of the measured nonlinear received signals at a depth
365
of 5 cm are shown in Fig. 9. The NLFM and LFM spectrum plots were
com-366
pared by normalising each spectrum with its own maximum value so that the
367
fundamental component of each signal was aligned to the 0 dB. The figure
368
shows the existence of the fundamental and nonlinear second and third
har-369
monic components. These nonlinear harmonic components were produced
370
due to the nonlinear propagation of ultrasound waves through water at the
371
higher acoustic pressure exerted by the transducer. The spectra of the
re-372
ceived signals show that the nonlinear harmonic components do not overlap
373
with each other due to the use of 20% FBW excitation. The third harmonic
374
component exists in the received signal because a broadband hydrophone
375
was used as a receiver. In a clinical setting for an ultrasound second
har-376
monic imaging, the third harmonic component will be filtered out or further
377
suppressed by a limited bandwidth of the receiving transducer.
378
In the frequency domain, the SHC of the received NLFM, LFM-W80
379
and LFM-W10 signals were respectively -18.8 dB, -19.6 dB and -18.4 dB
380
below the fundamental frequency component. The SNR was estimated in
381
the frequency domain by measuring the peak height of the second harmonic
382
relative to the mean noise value. The SNR of the SHC of NLFM was improved
383
by 0.8 dB when compared with the SHC of the LFM-W80 signal. The 0.8 dB
384
improvement in the SNR was small because both signals contained the same
385
energy level, sweeping bandwidth, and duration. The SNR of the SHC of
386
NLFM was comparable with the SHC of the LFM-W10 signal even though
the NLFM signal contained 57% of the energy of the LFM-W10 signal.
388
The envelopes of the compressed second harmonic chirp signals are shown
389
in Fig. 10. The pulse compression results of the SHC are shown in Table
390
4. The PSL of the compressed second harmonic signal of the NLFM was
391
improved by 13 dB when compared with the PSL of the LFM-W80 signal.
392
Similarly the PSL of the compressed second harmonic signal of the NLFM
393
was improved by 15.6 dB when compared with the PSL of the LFM-W10
394
signal. The compressed second harmonic signal of the LFM-W10 contains
395
higher PSL due to the existence of Fresnel ripples in the power spectrum.
396
Another reason for the higher PSL is the slight overlapping of the SHC with
397
the fundamental and third harmonics. This occurs as the LFM-W10 signal
398
contains 40% higher -6 dB bandwidth than the NLFM signal due to less
399
amplitude tapering. The ISL of the compressed second harmonic signal of
400
the NLFM was improved by 8.4 dB and 18.6 dB when compared with the ISL
401
of LFM-W80 and LFM-W10 signals, respectively. The improvement in PSL
402
and ISL will potentially improve the image quality and increase the contrast
403
resolution.
404
By comparing the MLW of the compressed second harmonic chirp signals
405
it was found that the compressed NLFM chirp had a slightly higher value of
406
MLW. This result was expected due to the fact that the NLFM chirp had 11%
407
and 40% lower -6 dB bandwidth than the LFM-W80 and LFM-W10 signals,
408
respectively. The MLW of the compressed chirp signal is inversely
propor-409
tional to the bandwidth of the signal. Therefore, in a pulse-echo mode for
410
ultrasound harmonic imaging, the MLW of the compressed second harmonic
411
NLFM and LFM chirps will be further increased due to the bandwidth
duction of the SHC caused by the frequency dependent attenuation in tissue
413
and limited bandwidth of the receiving transducer.
414
Experimental Results: Method II
415
The power spectra of the measured nonlinear received signals with a FBW
416
of 45% are shown in Fig. 11. In the frequency domain, the SHC of the
417
received NLFM, LFM-W80 and LFM-W10 signals were respectively -18.8 dB,
418
-19.5 dB and -17.8 dB below the fundamental frequency component. The
419
SNR of the SHC of NLFM was improved by 0.7 dB when compared with the
420
SHC of the LFM-W80 signal of same energy level. However, the SNR of the
421
SHC of NLFM was 1 dB below with the SHC of the LFM-W10 signal due to
422
less energy.
423
In method II, all the received NLFM, LFM-W80 and LFM-W10 signals
424
were processed using PI. After the PI process, the SNR of the SHC of NLFM,
425
LFM-W80 and LFM-W10 signals was improved by 6 dB and the fundamental
426
frequency components were suppressed by 37 dB. The PI process applied to
427
the nonlinear received NLFM signals is shown in Fig. 12 whereas the PI
428
process for the LFM signals is shown in Fig. 13. After the application of PI,
429
the extracted second harmonic chirps of NLFM, LFM-W80 and LFM-W10
430
signals were processed using associated harmonic matched and mismatched
431
filters to perform second harmonic pulse compression.
432
The envelopes of the compressed second harmonic chirps of NLFM,
LFM-433
W80 and LFM-W10 signals after processed with the PI are shown in Fig. 14
434
and the pulse compression results are shown in Table 4. The results indicated
435
that the PSL of the compressed second harmonic signal of the NLFM chirp
436
was improved by 17.6 dB and 5 dB when compared with the PSL of
W80 and LFM-W10 signals respectively. Compared to the results in
method-438
I, the PSL of the compressed second harmonic signal of the LFM-W10 was
439
improved by 7.2 dB due to the application of PI. Similarly the ISL of the
440
compressed second harmonic signal of the NLFM was improved by 13.5 dB
441
and 10.8 dB when compared with the ISL of the LFM-W80 and LFM-W10
442
signals, respectively.
443
The MLW of the compressed second harmonic chirps of NLFM,
LFM-444
W80 and LFM-W10 signals was reduced by more than 50% in method II
445
due to the application of the 45% FBW excitation signals which therefore
446
can improve the axial resolution. Similar to the method-I, the MLW of the
447
compressed second harmonic chirp of the NLFM was higher due to the lower
448
-6 dB bandwidth but comparable to the LFM-W80 and LFM-W10 signals.
449
In method II, the pulse compression performance of the harmonic matched
450
filter greatly relies on the PI. Therefore the MLW of the compressed second
451
harmonic chirp will be further increased if the PI fails to extract the complete
452
SHC under the tissue motion.
453
Doppler Sensitivity Evaluation of Designed Chirp Signals
454
The pulse compression performance of the harmonic matched filter will
455
reduce when its frequency response is not spectrally matched with the SHC
456
of the received signal. In the human body this occurs when the backscattered
457
echoes are received from moving blood (or tissue) causing a Doppler shift in
458
the signal spectrum. The amount of Doppler shift is directly proportional to
459
the velocity of the moving blood and is inversely proportional to the speed
460
of sound in the tissue. The Doppler shift can be expressed as Jensen(1996),
fD =−
2v
c fc (14)
wherefD is the Doppler shift in frequency,v is the velocity of the moving 462
blood, cis the speed of sound in the tissue, andfc is the centre frequency of 463
the excitation signal.
464
In order to measure the Doppler tolerance of the NLFM and reference
465
LFM signals, the Doppler shift frequency (fD) was calculated and added to 466
the centre frequency (fc) of the harmonic matched filter. It was assumed 467
that the velocity (v) of the moving blood is 2 m/s, the speed of sound (c) in
468
the tissue is 1500 m/s, and the centre frequency (fc) of the SHC is 4.5 MHz. 469
A Doppler shift frequency (fD) of 12 kHz was computed using (14) and 470
added to the centre frequency of the harmonic matched filter to mimic the
471
Doppler shift caused by the moving blood. The measured nonlinear signals
472
from the hydrophone with a FBW of 20% were processed using associated
473
harmonic matched and mismatched filters with an added Doppler shift
fre-474
quency of 12 kHz. The compressed second harmonic chirp signals are shown
475
in Fig. 15. It was found that all three chirp waveforms were robust to a
476
Doppler shift of up to 2 m/s with no significant differences were observed in
477
the MLW, PSL and ISL of the compressed signals when compared with the
478
experimental results of method I shown in Table 4.
479
Discussion and Conclusion 480
In this study, NLFM and LFM could use long signals because a single
481
element probe was employed in the experiments. Moreover, the long
dura-482
tion signal also increases the total excitation energy and thus improve the
SNR, which was required to generate the nonlinear harmonics in the water
484
experiments. However, the long duration signal has a limitation imposed
485
by the medical probes used in practical imaging systems (O’Donnell, 1992).
486
Therefore, the duration of the chirp signals should be optimized for medical
487
probes used in imaging applications.
488
In Method I, chirp signals with a fractional bandwidth (FBW) of 20%
489
were proposed with a single transmission. The low bandwidth was used in
490
order to avoid spectral overlapping between the required second harmonic
491
and fundamental components in the nonlinear received signals. Therefore,
492
a simple harmonic matched filter at the receiver was able to extract and
493
compress the second harmonic component. The bandwidth of the SHC is
494
twice the fundamental component, therefore the MLW of the SHC was
im-495
proved compared to the MLW of the fundamental component. Moreover, the
496
requirement of a single transmission of a chirp signal can avoid the motion
497
artifacts and reduction of the system frame-rate as required by the pulse
in-498
version process with the 45% FBW chirp signals in Method II. However, for
499
imaging applications the MLW of the SHC is still so large, due to the use of
500
20% FBW, which degrades the axial resolution of the image.
501
In Method II, figures 7 and 11 show less spectral overlapping for NLFM
502
and LFM-W80 chirps compared to the LFM-W10 signal due to the strong
503
amplitude tapering used in the design process. Although all applied signals
504
have same sweeping bandwidth, however, their -6 dB bandwidths were altered
505
due to the application of different amplitude tapering. The -6 dB bandwidth
506
of the NLFM chirp was respectively 40% and 11% lower than the LFM-W10
507
and LFM-W80 signals. In this method, the MLW of the compressed second
harmonic chirp signals was improved by 50% due to the use of 45% FBW
509
chirp signals which can improve the axial resolution. However, due to the
510
use of PI for the extraction of SHC, the system frame-rate was reduced by
511
half compared to the Method I.
512
The results of second harmonic pulse compression were also compared
513
with the previous study of nonlinear quadratic chirp for tissue harmonic
514
imaging (Song et al.,2010). It was observed that the PSL of the compressed
515
second harmonic signal of the proposed NLFM chirp was improved by at
516
least 5 dB in Method-I and at least 2 dB in Method II with the comparative
517
axial MLW.
518
The nonlinear chirp was carefully designed with the customised window
519
so that the signal spectrum should match with the frequency response of the
520
transducer and maximum energy was transmitted through the transducer. At
521
the receiving side, this results in improvement in the SNR of the SHC and
522
reduction of the PSL after second harmonic pulse compression. Moreover, for
523
the NLFM chirp, the second harmonic pulse compression was done without
524
the need of an additional windowing on the harmonic matched filter, which
525
can potentially avoid the reduction of axial resolution and the gain in the
526
SNR.
527
The NLFM chirp and associated harmonic matched filter were also robust
528
to the Doppler shift caused by the moving blood of up to 2 m/s and frequency
529
dependent attenuation of 0.5 dB/[cm×MHz] up to penetration depth of 5
530
cm with no significant degradation of the MLW, PSL and ISL after pulse
531
compression.
Acknowledgements 533
Authors are thankful to the Mehran University of Engineering &
Tech-534
nology, Jamshoro, Sindh, Pakistan, for providing all necessary facilities to
535
carry out this research.
References 537
Adams JW. A new optimal window [signal processing]. IEEE Transactions
538
on signal processing, 1991;39:1753–1769.
539
Anderson M. A 2D nonlinear wave propagation solver written in open-source
540
matlab code. In: Ultrasonics Symposium (IUS), IEEE. 2000. pp. 1351 –
541
1354.
542
Arif M. Ultrasound harmonic imaging using chirp coded excitation. Ph.D.
543
thesis, University of Leeds, 2010.
544
Arif M, Cowell D, Freear S. Pulse compression of harmonic chirp signals
545
using the fractional fourier transform. Ultrasound in medicine & biology,
546
2010a;36:949–956.
547
Arif M, Harput S, Freear S. Performance evaluation of nonlinear frequency
548
modulated signals in ultrasound harmonic imaging. In: Ultrasonics
Sym-549
posium (IUS), IEEE, 2010b. pp. 2016–2019.
550
Arshadi R, Yu ACH, Cobbold RSC. Coded excitation methods for ultrasound
551
harmonic imaging. Canadian Acoustics, 2007;35:35–46.
552
Averkiou M. Tissue harmonic imaging. In: Ultrasonics Symposium (IUS),
553
IEEE. 2000. pp. 1563–1572.
554
Borsboom J, Chin CT, Bouakaz A, Versluis M, de Jong N. Harmonic chirp
555
imaging method for ultrasound contrast agent. Ultrasonics, Ferroelectrics
556
and Frequency Control, IEEE Transactions on, 2005;52:241–249.
Brandon P. Design of a nonlinear pulse-compression system to give a low-loss
558
high-resolution radar performance. Marconi Review, 1973;36:1–45.
559
Chiao R, Hao X. Coded excitation for diagnostic ultrasound: a system
de-560
veloper’s perspective. Ultrasonics, Ferroelectrics and Frequency Control,
561
IEEE Transactions on, 2005;52:160–170.
562
Cobbold RSC. Foundations of Biomedical Ultrasound. Oxford University
563
Press, New York, NY, 2007.
564
Collins T, Atkins P. Nonlinear frequency modulation chirps for active sonar.
565
IEE Proceedings - Radar, Sonar and Navigation, 1999;146:312–316.
566
Cook C, Bernfeld M. Radar signals: An introduction to theory and
applica-567
tion. New York: Academic Press, 1967.
568
de Jong N, Bouakaz A, Frinking P. Basic acoustic properties of microbubbles.
569
Echocardiography, 2002;19:229–240.
570
Duck F. Tissue non-linearity. Proceedings of the Institution of Mechanical
571
Engineers, Part H: Journal of Engineering in Medicine, 2010;224:155–170.
572
Girod B, Rabenstein R, Stenger A. Signals and Systems. John Wiley & Sons,
573
Ltd, Chichester, West Sussex, England, 2001.
574
Gran F, Jensen J. Designing waveforms for temporal encoding using a
fre-575
quency sampling method. Ultrasonics, Ferroelectrics and Frequency
Con-576
trol, IEEE Transactions on, 2007;54:2070–2081.
Hallaj IM, Cleveland RO, Hynynen K. Simulations of the thermo-acoustic
578
lens effect during focused ultrasound surgery. The Journal of the Acoustical
579
Society of America, 2001;109:2245–2253.
580
Harput S, Arif M, Mclaughlan J, Cowell D, Freear S. The effect of
am-581
plitude modulation on subharmonic imaging with chirp excitation.
Ul-582
trasonics, Ferroelectrics and Frequency Control, IEEE Transactions on,
583
2013;60:2532–2544.
584
Harris F. On the use of windows for harmonic analysis with the discrete
585
fourier transform. Proceedings of the IEEE, 1978;66:51–83.
586
Jensen JA. Estimation of Blood Velocities Using Ultrasound: A Signal
Pro-587
cessing Approach. Cambridge University Press, New York, NY, 1996.
588
Jensen JA. Medical ultrasound imaging. Progress in Biophysics and
Molec-589
ular Biology, 2007;93:153 – 165.
590
Johnston J, Fairhead A. Waveform design and doppler sensitivity analysis
591
for nonlinear fm chirp pulses. IEE Proceedings Communications, Radar
592
and Signal Processing, 1986;133:163–175.
593
Kim D, Lee J, Kwon S, Song T. Ultrasound second harmonic imaging with a
594
weighted chirp signal. In: Ultrasonics Symposium (IUS), IEEE. 2001. pp.
595
1477–1480.
596
Ma Q, Ma Y, Gong X, Zhang D. Improvement of tissue harmonic imaging
597
using the pulse-inversion technique. Ultrasound in Medicine & Biology,
598
2005;31:889 – 894.
Maresca D, Skachkov I, Renaud G, Jansen K, van Soest G, de Jong N,
600
van der Steen AFW. Imaging microvasculature with contrast-enhanced
601
ultraharmonic ultrasound. Ultrasound Med Biol, 2014;40:1318–1328.
602
Milleit R. A matched-filter pulse-compression system using a nonlinear fm
603
waveform. Aerospace and Electronic Systems, IEEE Transactions on,
604
1970;AES-6:73–78.
605
Misaridis T, Jensen J. Use of modulated excitation signals in medical
ul-606
trasound. Part I: basic concepts and expected benefits. Ultrasonics,
Ferro-607
electrics and Frequency Control, IEEE Transactions on, 2005a;52:177–191.
608
Misaridis T, Jensen J. Use of modulated excitation signals in medical
ultra-609
sound. Part II: design and performance for medical imaging applications.
610
Ultrasonics, Ferroelectrics and Frequency Control, IEEE Transactions on,
611
2005b;52:192–207.
612
Misaridis T, Pedersen M, Jensen J. Clinical use and evaluation of coded
613
excitation in B-mode images. Ultrasonics Symposium (IUS), IEEE.
614
2000;2:1689–1693.
615
O’Donnell M. Coded excitation system for improving the penetration of
real-616
time phased-array imaging systems. and Frequency Control IEEE
Trans-617
actions on Ultrasonics, Ferroelectrics, 1992;39:341–351.
618
Pollakowski M, Ermert H. Chirp signal matching and signal power
opti-619
mization in pulse-echo mode ultrasonic nondestructive testing. Ultrasonics,
620
Ferroelectrics and Frequency Control, IEEE Transactions on, 1994;41:655–
621
659.
Ramalli A, Guidi F, Boni E, Tortoli P. A real-time chirp-coded imaging
623
system with tissue attenuation compensation. Ultrasonics, 2015;60:65–75.
624
Rao N. Investigation of a pulse compression technique for medical ultrasound:
625
a simulation study. Medical and Biological Engineering and Computing,
626
1994;32:181–188.
627
Simpson D, Chin CT, Burns P. Pulse inversion doppler: a new method for
628
detecting nonlinear echoes from microbubble contrast agents. Ultrasonics,
629
Ferroelectrics and Frequency Control, IEEE Transactions on, 1999;46:372–
630
382.
631
Song J, Chang JH, Song Tk, Yoo Y. Coded tissue harmonic imaging with
632
nonlinear chirp signals. Ultrasonics, 2011;51:516–521.
633
Song J, Kim S, Sohn HY, Song TK, Yoo YM. Coded excitation for ultrasound
634
tissue harmonic imaging. Ultrasonics, 2010;50:613–619.
635
Wells PNT. Ultrasound imaging. Physics in Medicine and Biology,
636
2006;51:R83–R98.
637
Wojcik G, Mould J, Ayter S, Carcione L. A study of second harmonic
gen-638
eration by focused medical transducer pulses. In: Ultrasonics Symposium
639
(IUS), IEEE. 1998. pp. 1583 –1588.
Figure Captions 641
Figure 1: Instantaneous frequency functions (Top), and the chirp-rate
func-642
tions of the excitation signals of 45% fractional bandwidth (FBW)
(Bot-643
tom).
644
Figure 2: Amplitude envelopes (Top), and the power spectra of the
exci-645
tation signals of 45% FBW along with the measured transfer function
646
(TF) of the transducer used in the experiments (Bottom).
647
Figure 3: Proposed system flow chart illustrating the signal processing chain
648
for the pulse compression of the second harmonic component (SHC)
649
using the harmonic matched filter. Method I (Top), and Method II
650
(Bottom).
651
Figure 4: Schematic diagram of the experimental setup.
652
Figure 5: Power spectra of the simulated nonlinear received signals with a
653
FBW of 20%.
654
Figure 6: The simulation results of method I show the envelopes of the
655
compressed second harmonic chirp signals with a FBW of 20%.
656
Figure 7: Power spectra of the simulated nonlinear received signals with a
657
FBW of 45%.
658
Figure 8: The simulation results of method II showing the envelopes of the
659
compressed second harmonic chirp signals of 45% FBW after processed
660
with the PI.
Figure 9: Power spectra of the measured nonlinear received signals with a
662
FBW of 20%.
663
Figure 10: The experimental results of method I show the envelopes of the
664
compressed second harmonic chirp signals with a FBW of 20%.
665
Figure 11: Power spectra of the measured nonlinear received signals with
666
a FBW of 45%.
667
Figure 12: Illustration of the PI process applied to the experimental data
668
of NLFM chirp with a FBW of 45%. Received Rx1 signal (Top-Left)
669
and associated power spectrum (Top-Right), Received Rx2 signal with
670
a phase difference of 180◦ (Middle-Left) and associated power spectrum
671
(Middle-Right), and summation of Rx1 and Rx2 NLFM signals in time
672
domain (Bottom-Left) and associated power spectrum showing the
en-673
hancement of the SHC and suppression of the fundamental and third
674
harmonic components (Bottom-Right).
675
Figure 13: Illustration of the PI process applied to the experimental data
676
of LFM-W80 (Left) and LFM-W10 (Right) chirps with a FBW of 45%.
677
(Top) power spectrum of the received Rx1 signal, (Middle) power
spec-678
trum of the received Rx2 signal with a phase difference of 180◦,
(Bot-679
tom) power spectrum of the time domain summation of Rx1 and Rx2
680
LFM signals showing the enhancement of the SHC and suppression of
681
the fundamental and third harmonic components.
682
Figure 14: The experimental results of method II showing the envelopes
683
of the compressed second harmonic chirp signals of 45% FBW after
processed with the PI.
685
Figure 15: Envelopes of the compressed second harmonic chirp signals with
686
a FBW of 20% processed by associated harmonic matched and
mis-687
matched filters with and without an added Doppler shift frequency of
688
12 kHz.
Tables 690
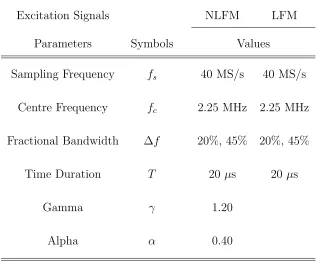
Table 1: Design parameters of excitation signals.
691
Excitation Signals NLFM LFM
Parameters Symbols Values
Sampling Frequency fs 40 MS/s 40 MS/s
Centre Frequency fc 2.25 MHz 2.25 MHz
Fractional Bandwidth ∆f 20%, 45% 20%, 45%
Time Duration T 20µs 20µs
Gamma γ 1.20
Alpha α 0.40
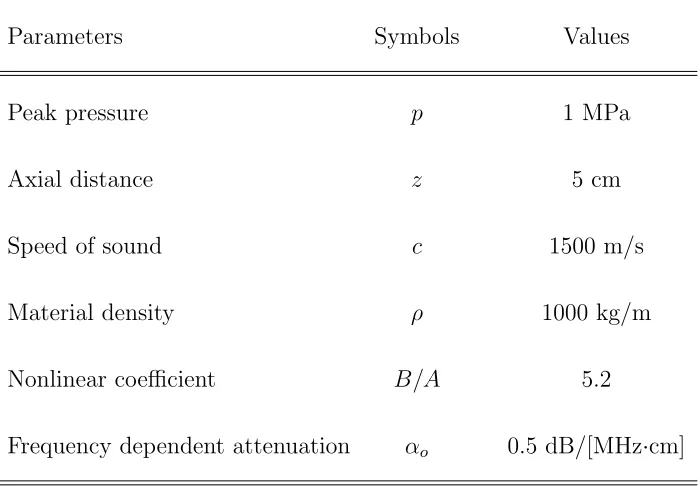
Table 2: Simulation parameters and their values.
693
Parameters Symbols Values
Peak pressure p 1 MPa
Axial distance z 5 cm
Speed of sound c 1500 m/s
Material density ρ 1000 kg/m
Nonlinear coefficient B/A 5.2
Frequency dependent attenuation αo 0.5 dB/[MHz·cm]
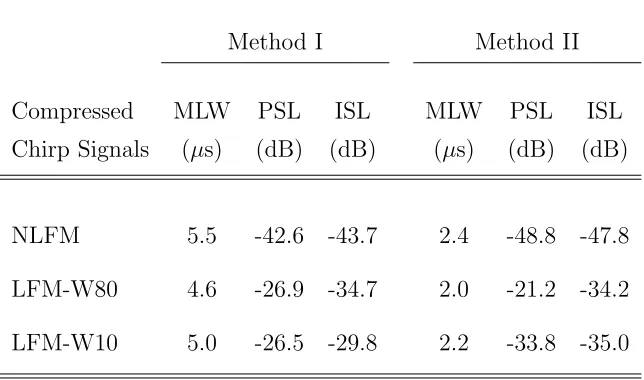
Table 3: Simulation results showing the performance evaluation parameters
695
of second harmonic pulse compression.
Method I Method II
Compressed MLW PSL ISL MLW PSL ISL Chirp Signals (µs) (dB) (dB) (µs) (dB) (dB)
NLFM 5.5 -42.6 -43.7 2.4 -48.8 -47.8
LFM-W80 4.6 -26.9 -34.7 2.0 -21.2 -34.2
LFM-W10 5.0 -26.5 -29.8 2.2 -33.8 -35.0
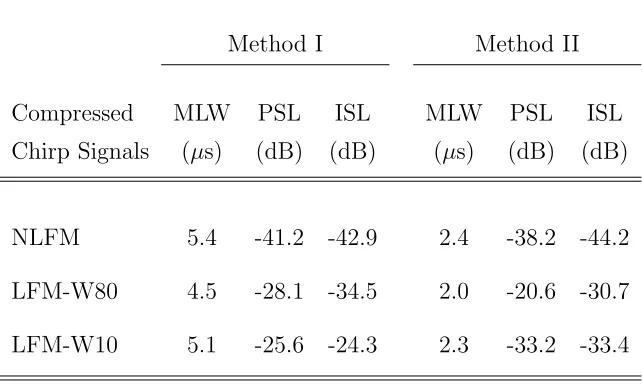
Table 4: Experimental results showing the performance evaluation
param-697
eters of second harmonic pulse compression.
Method I Method II
Compressed MLW PSL ISL MLW PSL ISL Chirp Signals (µs) (dB) (dB) (µs) (dB) (dB)
NLFM 5.4 -41.2 -42.9 2.4 -38.2 -44.2
LFM-W80 4.5 -28.1 -34.5 2.0 -20.6 -30.7
LFM-W10 5.1 -25.6 -24.3 2.3 -33.2 -33.4