Abdominal Superficial Subcutaneous Fat
The Harvard community has made this
article openly available.
Please share
how
this access benefits you. Your story matters
Citation
Golan, Rachel, Ilan Shelef, Assaf Rudich, Yftach Gepner, Elad
Shemesh, Yoash Chassidim, Ilana Harman-Boehm, et al. 2012.
Abdominal superficial subcutaneous fat. Diabetes Care 35(3):
640-647.
Published Version
doi:10.2337/dc11-1583
Citable link
http://nrs.harvard.edu/urn-3:HUL.InstRepos:10622926
Terms of Use
This article was downloaded from Harvard University’s DASH
repository, and is made available under the terms and conditions
applicable to Other Posted Material, as set forth at http://
Abdominal Super
fi
cial Subcutaneous Fat
A putative distinct protective fat subdepot in type 2 diabetes
RACHELGOLAN,RD1
ILANSHELEF,MD, MPH2
ASSAFRUDICH,MD, PHD1,3
YFTACHGEPNER,MPH1
ELADSHEMESH,MD2
YOASHCHASSIDIM,PHD4
ILANAHARMAN-BOEHM,MD5
YAAKOVHENKIN,MD6
DANSCHWARZFUCHS,MD7
SIVANBENAVRAHAM,RD1
SHULAWITKOW,RD, MPH1
IDITF. LIBERTY,MD5
OSNATTANGI-ROSENTAL,BA1
BENJAMINSARUSI,MSC2
MEIRJ. STAMPFER,MD, DRPH8
IRISSHAI,RD, PHD1
OBJECTIVEdUnlike visceral adipose tissue (VAT), the association between subcutaneous
adipose tissue (SAT) and obesity-related morbidity is controversial. In patients with type 2 dia-betes, we assessed whether this variability can be explained by a putative favorable, distinct association between abdominal superficial SAT (SSAT) (absolute amount or its proportion) and cardiometabolic parameters.
RESEARCH DESIGN AND METHODSdWe performed abdominal magnetic resonance
imaging (MRI) in 73 patients with diabetes (mean age 58 years, 83% were men) and cross-sectionally analyzed fat distribution at S1-L5, L5-L4, and L3-L2 levels. Patients completed food frequency questionnaires, and subgroups had 24-h ambulatory blood pressure monitoring and 24-h ambulatory electrocardiography.
RESULTSdWomen had higher %SSAT (37 vs. 23% in men;P,0.001) despite a similar
mean waist circumference. Fasting plasma glucose (P= 0.046) and HbA1c(P= 0.006) were both
lower with increased tertile of absolute SSAT. In regression models adjusted for age, waist circumference, and classes of medical treatments used in this patient population, increased
%SSAT was significantly associated with decreased HbA1c(b=20.317;P= 0.013), decreased
daytime ambulatory blood pressure (b=20.426;P= 0.008), and increased HDL cholesterol
(b= 0.257;P= 0.042). In contrast, increased percent of deep SAT (DSAT) was associated with
increased HbA1c(b= 0.266;P= 0.040) and poorer heart rate variability parameters (P= 0.030).
Although total fat and energy intake were not correlated with fat tissue distribution, increased
intake oftransfat tended to be associated with total SAT (r= 0.228;P= 0.05) and DSAT (r= 0.20;
P= 0.093), but not with SSAT.
CONCLUSIONSdAbdominal SAT is composed of two subdepots that associate
differ-ently with cardiometabolic parameters. Higher absolute and relative distribution of fat in abdominal SSAT may signify beneficial cardiometabolic effects in patients with type 2 diabetes.
Diabetes Care35:640–647, 2012
I
ntra-abdominal visceral adipose tissue (VAT), which is linked to cardiometa-bolic risk (1–3), differs anatomically and functionally from subcutaneous adi-pose tissue (SAT) (4). In addition, abdom-inal SAT is further separable into two distinct subcompartments by the fascia superficialis: the superficial SAT (SSAT) and the deep SAT (DSAT) (5). Whereas the abdominal SSAT subdepot is orga-nized into tightly packed lobules, the lobules in the DSAT subdepot are larger, more irregular, and less well organized, and may represent an intermediate tis-sue organization between SSAT and VAT (4).An increased proportion of VAT (6) is frequently reported to be associated with type 2 diabetes and lower heart rate vari-ability, an indicator for autonomic neurop-athy, and therefore increased cardiovascular risk (7). In contrast with VAT (1–3), there is less consensus regarding the association between abdominal (8) and peripheral SAT with disease risk, and both negative and positive associations have been reported (9–11). Recent studies suggest that abdo-minal DSAT may be associated with disease parameters, much like VAT, particularly insulin resistance (5,12,13). Yet, the as-sociation between peripheral and abdo-minal SAT and cardiometabolic risk is weak, if not“paradoxical”(9,14), and it is still unknown whether absolute or rel-ative amount of abdominal SSAT is re-sponsible for the putative “protective effects” of abdominal SAT reported in some of these studies.
RESEARCH DESIGN AND METHODS
Study population
As part of baseline measurements in the 2-year Cardiovascular, Diabetes, and Eth-anol (CASCADE) randomized controlled trial, a cross-sectional analysis was per-formed in a subgroup of 73 men and women, aged 41–73 years, with type 2 di-abetes (defined as fasting plasma glucose [FPG].126, HbA1c.6.5, physician diag-nosis, or evidence of purchase of oral hy-poglycemic medications) who underwent magnetic resonance imaging (MRI) of the abdomen. Persons were excluded if they were smokers, pregnant, lactating, or using
c c c c c c c c c c c c c c c c c c c c c c c c c c c c c c c c c c c c c c c c c c c c c c c c c
From1The S. Daniel Abraham International Center for Health and Nutrition, and Department of Epidemi-ology, Faculty of Health Sciences, Ben-Gurion University of the Negev, Beer-Sheva, Israel; the2Department of Radiology, Soroka University Medical Center, Beer-Sheva, Israel; the3Department of Clinical Bio-chemistry and The S. Daniel Abraham Center for Health and Nutrition, Ben-Gurion University of the Negev, Beer-Sheva, Israel; the4Departments of Physiology and Neuroradiology, Soroka University Medical Center and Zlotowski Center for Neuroscience, Ben-Gurion University of the Negev, Beer-Sheva, Israel; the 5Departments of Internal Medicine and Diabetes, Soroka University Medical Center, Beer-Sheva, Israel; the 6Department of Cardiology, Soroka University Medical Center, Beer-Sheva, Israel; the7Nuclear Research Center Negev, Dimona, Israel; and the8Channing Laboratory, Department of Medicine, Brigham and Women’s Hospital and Harvard Medical School, and Departments of Epidemiology and Nutrition, Harvard School of Public Health, Boston, Massachusetts.
Corresponding author: Iris Shai, [email protected]. Received 22 August 2011 and accepted 4 December 2011.
DOI: 10.2337/dc11-1583. Clinical trial reg. no. NCT00784433, clinicaltrials.gov. R.G. and I.S. contributed equally to this study.
© 2012 by the American Diabetes Association. Readers may use this article as long as the work is properly cited, the use is educational and not for profit, and the work is not altered. See http://creativecommons.org/ licenses/by-nc-nd/3.0/ for details.
an insulin pump or injecting insulin more than twice per day; had evidence of severe diabetes complications (e.g., proliferative retinopathy or advanced renal disease); had autonomic neuropathy manifested as postural hypertension or hypoglycemia unawareness; had a fasting serum triglyc-eride level.400 mg/dL or a serum creat-inine level of$2 mg/dL (177 mmol/L); had liver dysfunction (greater than twice the upper limit of normal of alanine ami-notransferase and aspartate aminotransfer-ase levels); had active cancer or received chemotherapy in the last 3 years; or were participating in another trial. The study protocol was approved by the Soroka Uni-versity Medical Center Medical Ethics Board and Helsinki Committee. All partic-ipants provided written informed consent.
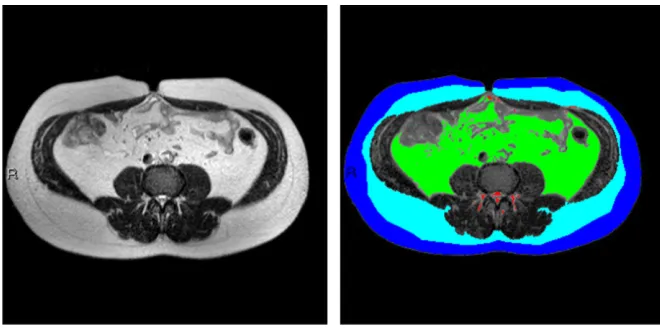
MRI acquisition and image analysis MRI scans of the abdomen were performed using a 1.5 Tesla machine (Intera, Philips Medical Systems, Best, the Netherlands) using a body coil. Subjects were examined in the supine position with arms positioned parallel along the lateral sides of the body. MRI scans demonstrating fat in the differ-ent compartmdiffer-ents were assessed using a MATLAB-based in-house program (Fig. 1). Fat tissues of specific anatomical land-marks were quantified. The MRI scan al-lows visualizing the fascia superficialis as afine black line. To divide SSAT from DSAT, we drew a continuous line over the fascia superficialis. After quantification, fat tissues were divided into color-coded groups: superficial subcutaneous fat = dark blue; deep subcutaneous fat = light blue; VAT = green; perimuscular fat (fat surrounding and within the latissimus dorsi and diaphragm) = purple; and non-classified fat (fat surrounding the vertebrae and fat depots unrelated to any of the groups listed above) = red. Selecting the specified fat mass area was performed using a semiautomatic method (i.e., con-nected pixels) or various manual tools, such as rectangle/circle/polygon or free hand forfine adjustments and corrections if needed. Quantification of the fat mass regions included the area of each fat type and the proportion (percentage) of the total area of all fat types. To obtain absolute measurements in metric units, a scaling procedure was applied before the segmen-tation to determine real pixel dimensions. Finally, in accordance with other studies (15), we calculated the fat distribution us-ing the mean of the three slices: S1L5, L5L4, and L3L2. Perimuscular and the non-classified fat tissues, totaling a negligible
fraction of total abdominal fat, were omitted from our analysis. All multivariate analyses were performed twice, using the absolute abdominal fat tissue distribution (SSAT, DSAT, VAT) or the relative (in percent) of each depot from total abdominal adipose tissue (TAAT) (SSAT%, DSAT%, VAT%).
Clinical parameters
Anthropometric measures were evaluated as clinical estimates of whole-body adi-pose tissue compartments. Participants were weighed without shoes to the nearest 0.1 kg. Height was measured using a wall-mounted stadiometer to the nearest mil-limeter for determination of BMI. Waist circumference was measured halfway be-tween the last rib and the iliac crest by the qualified study nurse, with the same type of measuring tape. Mean blood pressure from two measures was recorded after resting, with the use of an automated sys-tem (Datascop Acutorr 4, SOMA Technol-ogy, Inc., Bloomfield, CT). Blood samples were drawn after at least an 8-h fast, and current use of all medication was recorded. To assess blood pressure and heart rate variability, 24-h ambulatory blood pres-sure monitoring (OSCAR 2 oscillometric SunTech Medical Model 222, Morrisville, NC) and 24-h ambulatory electrocardi-ography (ECG) (LIFECARD-CF, Delmar Reynolds Medical Ltd., Hertfordshire, UK) were performed in a substudy group of our population (n = 31 andn = 37, respec-tively). Heart rate variability parameters in-cluded time domain variables (16): the
mean duration of the time interval between two R waves (RR), graphically presented in the form of an RR interval tachogram; the SD of all normal RR (SDNN); the mean of all the 5-min SDs of NN (normal RR) inter-vals during the 24-h period; the root mean square successive difference, calculates the square root of the mean of the squared differences between successive NN inter-vals over 24 h; and the 24-h triangular in-dex, the integral of the density distribution (i.e., the number of all NN intervals) di-vided by the maximum of the density dis-tribution, which is more influenced by the lower than the higher frequencies. From the 24-h blood pressure monitor, we calcu-lated the average systolic and diastolic blood pressure during the day (average of records between 6A.M. and 10 P.M.) and night (average of records between 10P.M. and 6A.M.). All medications in current use were recorded and classified.
Dietary assessment
We evaluated dietary assessment by a validated food-frequency questionnaire (17) that included 127 food items and 3 portion-size pictures for 17 items. Electronic questionnaires ensured completeness of the data by prompting the participant when a question was not answered.
Statistical analysis
[image:3.594.219.549.55.219.2]We divided our study population across tertiles of SSAT (range 5,052–26,836 mm2) and used both absolute and pro-portional fat distribution for the analysis Figure 1dMRI imaging of abdominal fat tissues compartments. The subcutaneous fascial plane
was delineated using the computer interface semiautomatic method, where initially an intensity-based automatic segmentation was generated and presented followed by semimanualfine tuning. The area of each compartment was quantitated separately. Fat tissues of specific anatomical landmarks were quantified and divided into color-coded groups as follows: dark blue, superficial subcutaneous fat; light blue, deep subcutaneous fat; green, visceral adipose tissue; and red, non-classified fatdfat surrounding the vertebrae and fat depots that were unrelated to each of the groups
to account for both subdepot adiposity and interdepot distribution, respectively. Fat distribution was calculated by divid-ing each fat depot by TAAT, creatdivid-ing three new variables: SSAT%, DSAT%, and VAT%. ANOVA linear test was used to evaluate the characteristics of the study popula-tion across SSAT tertiles. We performed multivariate linear regression models, ad-justed for age and waist circumference, to evaluate associations among SSAT, anthro-pometric measures, diet, blood biomark-ers, 24-h ambulatory blood pressure monitoring, and 24-h ambulatory ECG re-cordings. Models including cardiovascu-lar outcomes (24-h ambulatory blood pressure monitoring and 24-h ambulatory ECG recordings) were further adjusted, one at a time, for FPG or HbA1c. We fur-ther performed similar models adjusted one at a time to the various classes of medical treatments used in this patient population (insulin, oral hypoglycemic medications, antihypertensive medica-tions, and lipid-lowering medications) and performed the same models, stratified by sex. The Statistical Package for the Social Sciences (version 19, SPSS Inc., Chicago, IL) was used for all statistical analyses.P,0.05 denoted statistical significance.Pvalue was not adjusted for multiple testing. Values re-ported are means6SDs unless otherwise stated. Multiple linear regression results are reported with the parameter estimate and
Pvalue for each variable.
RESULTS
Fat distribution, blood biomarkers, and diet
The baseline characteristics of the partici-pants in the entire study group and acros-stertiles of SSAT are shown in Table 1. Mean HbA1cwas 7.561.1%, and 10 (14%) pa-tients were taking one daily dose of insulin. The oral hypoglycemic medications used by the patients included sulfonylureas (11 patients,15%), dipeptidyl peptidase-4 in-hibitor (9 patients, 12%), and metformin (31 patients, 42%). None of the patients were taking thiazolidinediones. The mean fat tissues distribution was as follows: SSAT 26%, DSAT 23%, and VAT 51%. SSAT positively correlated with DSAT (r = 0.389,P,0.001) and TAAT (r= 0.461,
P,0.001). SSAT, DSAT, and TAAT cor-related positively and significantly with waist circumference (SSAT:r= 0.313,P= 0.009, DSAT:r= 0.276,P= 0.023, TAAT:
r= 0.449,P,0.001) and BMI (SSAT:r= 0.490,P, 0.001, DSAT:r= 0.327, P= 0.005, TAATr= 0.508,P,0.001). VAT
correlated positively and significantly with waist circumference and weight (r= 0.330,
P= 0.006;r= 0.346,P= 0.003, respectively). Medical treatment, including insulin therapy and antihypertensive, lipid-lowering, anti-platelet, and oral hypoglycemic medications, was similarly distributed across SSAT tertiles (Table 1).
FPG (Pof trend = 0.046,P= 0.073 between extreme tertiles) and HbA1c(Pof trend = 0.006,P= 0.011 between extreme tertiles) were both lower with increased tertile of SSAT. SSAT was inversely corre-lated with HbA1C(r=20.262,P= 0.027), whereas VAT (r= 0.240,P= 0.042) and TAAT positively correlated with fasting triglycerides (r= 0.278,P= 0.018).
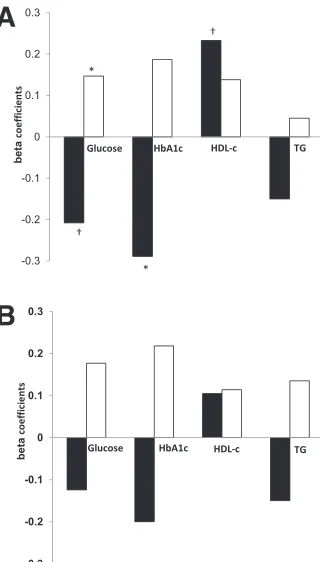
In a regression model (Fig. 2A), ad-justed for age and waist circumference, increased absolute SSAT was associated with decreased HbA1c(b=20.289,P= 0.017) and tended to be associated with decreased fasting glucose (b=20.208, 0.084). Further adjustment of the model to medical treatment classes (one at a time: insulin therapy and antihyperten-sive, lipid-lowering, antiplatelet, and oral hypoglycemic medications) did not significantly attenuate these associations (data not shown). Total energy intake, to-tal dietary fat, saturated fat, and unsatu-rated fat content were not associated with fat tissue mass (data not shown). How-ever, increased total dietary intake oftrans fatty acids tended to be positively corre-lated with total SAT (r= 0.228,P= 0.054) and DSAT (r= 0.200,P= 0.093). Collec-tively, the absolute area (mass) of abdom-inal SSAT seemed to be associated with more favorable glycemic and cardiovas-cular parameters, unlike DSAT or VAT.
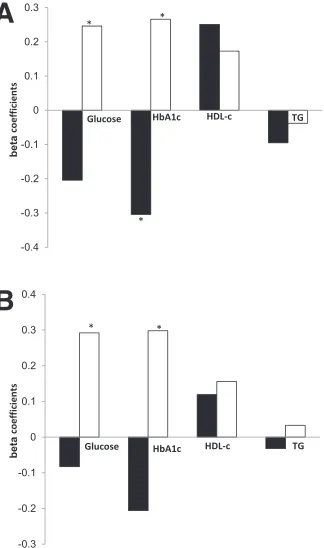
Proportional fat tissue distribution We next assessed whether the relative adi-pose tissue distribution, i.e., the percentage of fat in a certain abdominal (sub)-depot, was associated with clinical parameters. The percentage of SSAT from TAAT (%SSAT) was associated with lower HbA1c in regression models adjusted for age and waist circumference (b=20.304,
P= 0.017), consistent with the finding using the absolute SSAT area mentioned above. When we added medical treat-ment to the model (insulin therapy and antihypertensive, lipid-lowering, antipla-telet, and oral hypoglycemic medications), the association remained significant. Con-versely, increased DSAT was associated with increased levels of HbA1c (b = 0.266, P = 0.039) and fasting glucose (b= 0.246,P= 0.054). Increased %SSAT
was associated with increased HDL cho-lesterol (b= 0.251,P= 0.047) (Fig. 3A).
Of the 12 women recruited, 11 were postmenopausal, none of whom were taking hormone replacement therapy. Although men and women had similar waist circumferences (104 vs. 103 cm,P= 0.902), TAAT (37,095 vs. 37,108 mm2,
[image:5.594.393.553.54.335.2]P = 0.975), and medical treatment, women had higher %SSAT than did men and twice the ratio of SSAT to VAT (Table 2). They had lower fasting glucose (P,0.001) and lower HbA1c(P= 0.002), and tended to have higher HDL choles-terol (P= 0.076). Men had a higher VAT to SAT ratio, whereas %DSAT was similar between men and women. To verify that the association between SSAT and favor-able cardiometabolic parameters did not simply reflect intrinsic differences between genders, we stratified the regression models Figure 2dAssociation of metabolic
parame-ters and cardiovascular parameparame-ters with ab-solute abdominal fat tissues in patients with type 2 diabetes, stratified by sex. A: Entire group. B: Men only. Multivariate model ad-justed for age and waist circumference. SSAT (black bar). DSAT (white bar). Numbers rep-resent b standardized coefficient: the amount and direction by which absolute abdominal fat tissues change (mm2) for each unit change in the
metabolic parameters, while accounting for the other variables in the model. TG, triglycerides (mg/day). *P,0.05.†P,0.1.
by sex (Figs. 2Band 3B). In a subgroup of the men only, similar opposite associations among %SSAT, %DSAT, and cardiometa-bolic parameters were observed (Fig. 3B). In addition, in the men-only subgroup, % DSAT was significantly associated with higher glucose (b= 0.292,P= 0.040) and HbA1c(b= 0.298,P= 0.038).
Fat distribution, 24-h ambulatory blood pressure monitoring, and 24-h ambulatory ECG
We further found associations among the absolute abdominal subdepot fat (mass), proportional abdominal subdepot fat area, blood pressure, and heart rate variability parameters: Both absolute (r = 20.381,
P= 0.050) and proportional DSAT (r =
20.428,P= 0.026) negatively correlated with SDNN. In regression models, ad-justed for age and waist circumference, higher absolute DSAT (b=20.425, P= 0.034) and higher proportional DSAT (b=
20.431 P= 0.029) were associated with
lower SDNN. Proportional DSAT was sig-nificantly associated with decreased 24-h triangular index (b=20.417,P= 0.030), suggesting decreased heart rate variability with increased fat distribution to the DSAT depot. However, further adjust-ment to oral hypoglycemic medications, but not to insulin therapy, antihyperten-sive, lipid-lowering, or antiplatelet drugs, attenuated the association between DSAT and markers of heart rate variability (24-h triangular index:b=20.249,P= 0.228, SDNN:b=20.294,P= 0.186). Because hyperglycemia is a key risk factor for au-tonomic neuropathy, we further adjusted the models, one at a time, for HbA1c or FPG. The association between both abso-lute and proportional DSAT and heart rate variability remained negative, but the sig-nificance was attenuated. When adjusted for HbA1c, higher absolute (b=20.355,
P= 0.093) and proportional (b=20.401
[image:6.594.43.205.56.330.2]P = 0.073) DSAT were associated with lower SDNN. Proportional DSAT was neg-atively associated with decreased 24-h triangular index (b=20.406,P= 0.063). When adjusted for glucose, higher absolute (b=20.278P= 0.144) and proportional (b=20.322P= 0.122) DSAT were not associated with lower SDNN. In contrast, opposite trends were observed with absolute and proportional abdominal SSAT: Higher absolute (b=20.329,P= 0.043) and pro-portional SSAT (b=20.425,P= 0.008) were associated with lower mean daytime diastolic blood pressure. When medical treatment was added to the model (insulin therapy, antihypertensive, lipid-lowering, antiplatelet, or oral hypoglycemic medica-tions), the association remained signifi-cant. Increased proportional SSAT tended to positively correlate with increased Table 2dAbdominal fat tissue distribution, biomarkers, and clinical parameters
in men and women with type 2 diabetes
Men Women
Age, years 58.467.5 59.767.2
Weight, kg 87.7613.1 81.5613.4
BMI, kg/m2 28.963.7 31.263.8
Systolic blood pressure, mmHg 134.9614.5 144.0625.0
Diastolic blood pressure, mmHg 78.7610.4 80.768.7
Waist circumference, cm 104.069.2 103.569.5
Abdominal MRI
Total SAT, mm2 17,08065,312 22,82567,230*
Abdominal SSAT, mm2 8,58762,673 13,89865,357†
Abdominal DSAT, mm2 8,49363,403 8,92763,691
VAT, mm2 20,01466,629 14,35563,838*
TAAT, mm2 37,09568,848 37,18067,290
Fat distributions
Abdominal SSAT: total adipose tissue ratio 0.2260.05 0.3660.09†
Abdominal SSAT: total SAT ratio 0.5160.1 0.6060.1*
Abdominal SSAT: VAT ratio 0.4760.2 1.0560.5†
VAT: total abdominal SAT ratio 1.2860.5 0.6960.3†
Fasting blood biomarkers
Plasma glucose, mg/dL 144.6640.3 118.2611.8*
HbA1c, % 7.661.1 6.960.4*
Serum TG, mg/dL 162.2683.2 154.0654.0
Serum HDL cholesterol, mg/dL 44.1610.1 50.068.2*
Serum LDL cholesterol, mg/dL 94.5629.7 108.8629.3
TG/HDL 3.862.3 3.461.9
Plasma alkaline phosphatase, units/L 73.8628.7 60.4614.8
Plasma alanine aminotransferase, units/L 27.3611.3 23.567.7
Medications in current use
Lipid-lowering therapy,n(%) 36 (59) 8 (66)
Antihypertensive therapy,n(%) 32 (52) 9 (75)
Oral glycemic-control medications,n(%) 42 (69) 9 (75)
Oral antiplatelet drugs,n(%) 28 (46) 7 (58)
[image:6.594.209.554.77.449.2]Data are means6SD unless otherwise indicated.n= 61 and 12 for men and women, respectively. TG, triglycerides. *P,0.05.†P,0.001. To convert values for cholesterol to millimoles per liter, multiply by 0.02586. To convert values for triglycerides to millimoles per liter, multiply by 0.01129. To convert values for glucose to millimoles per liter, multiply by 0.05551.
Figure 3dAssociation of metabolic and
square root of the mean of the squared differences between successive NN inter-vals over 24 h (r = 0.367, P = 0.060). When HbA1c was added to the model, the association between absolute SSAT and mean daytime diastolic blood pressure was attenuated (b=20.284,P= 0.072), although the association between propor-tional SSAT and mean daytime diastolic blood pressure remained significant (b=
20.379, P= 0.008). When adjusted for glucose, the association between both ab-solute (b=20.329,P= 0.043) and pro-portional (b=20.444,P= 0.006) SSAT and mean daytime diastolic blood pres-sure remained significant.
When the models were stratified by sex, we found that the men-only sub-group also exhibited similar associations among abdominal subdepot fat (mass and proportion), blood pressure, and heart rate variability parameters. Higher abso-lute DSAT (b=20.452,P= 0.014) and proportional DSAT (b = 20.535 P = 0.009) were associated with lower SDNN. Higher absolute DSAT (b=20.486,P= 0.007) and proportional DSAT (b =
20.557, P = 0.005) were associated with decreased 24-h triangular index. Further adjustment to oral hypoglyce-mic medications, but not to insulin ther-apy, antihypertensive, lipid-lowering, or antiplatelet drugs, attenuated the associ-ation between proportional DSAT and markers of heart rate variability (24-h tri-angular index:b =20.439,P = 0.075, SDNN:b=20.443,P= 0.074) and be-tween absolute markers of heart rate vari-ability (24-h triangular index:b=20.408,
P= 0.073, SDNN:b=20.408,P= 0.072). CONCLUSIONSdIn this study of pa-tients with type 2 diabetes, we observed a distinct association between both the absolute (representing “sub-depot adi-posity”) and the relative amounts (repre-senting interdepot distribution) of abdominal SSAT and markers of more fa-vorable glycemic control and cardiovascu-lar function as determined by higher heart rate variability and lower blood pressure. After adjusting for age and waist circum-ference, higher relative distribution of ab-dominal fat in SSAT was correlated with improved glycemic control (HbA1cand fasting glucose) and better indicators of cardiovascular health (lower blood pres-sure and higher heart rate variability). Conversely, DSAT correlated with higher heart rate and lower heart rate variabil-ity, both indicators of autonomic neurop-athy (18), and therefore indicators for
increased cardiovascular risk. Of note, controlling for markers of glycemic con-trol attenuated the negative association be-tween DSAT and cardiovascular end point, but not the favorable association with SSAT. In terms of diet, increased in-take oftransfat tended to be associated with total abdominal SAT and DSAT, but not with SSAT. Because most studies sup-port the more“adverse metabolic role”of intraabdominal/VAT, whether SAT is sim-ply“less pathogenic”than VAT or exerts direct or indirect“protective effects”on cardiovascular and metabolic morbidity is still controversial (6,9). Furthermore, even more uncertainty exists as to the functional differences and risk associated with the DSAT or SSAT subdepots in per-sons with type 2 diabetes (19). Our results suggest a favorable distinct association be-tween abdominal SSAT subdepot and car-diometabolic health in type 2 diabetes.
Our study has several limitations. This is a cross-sectional design that may suggest associations but not clear cause– effect protective relationships between abdominal SSAT and cardiometabolic pa-rameters. Because we did not measure pe-ripheral (lower body) SAT, our results refer to abdominal SSAT only. Our sample size limits the statistical power, although we still could identify significant differ-ences between parameters. A significant proportion of our patients received treat-ment with medications that may modify the levels of risk factors and directly affect glycemic control parameters. Although we have made an attempt to adjust our results to the use of these drugs, doses were not assessed. Finally, we had a lower propor-tion of women, but nevertheless we could identify significant differences between the sexes. The strengths of our study include the specific group with type 2 diabetes, the high MRI quality imaging, the compre-hensive 24-h ambulatory blood pressure and 24-h ambulatory ECG measurements as cardiometabolic measurements, the medication follow-up, and the dietary assessment.
We found that abdominal SSAT cor-related with improved glycemic control and indicators of cardiovascular risk. The SSAT depot may be less lipolytic than VAT, or even DSAT, and so improved in-sulin sensitivity of SSAT may favor accu-mulation of excess energy in this depot. In this regard, higher deposition of excess calories in the SSAT is a consequence, not the cause, of improved metabolic func-tion. Conversely, it is plausible that the abdominal SSAT fat mass may be a unique
abdominal fat subdepot that has protec-tive effects on glycemic control and car-diovascular function. This is reminiscent of afinding by some, but not all, studies that suggest peripheral SAT might be less “pathogenic” than VAT. Currently, two hypotheses have been put forward to ex-plain the difference between peripheral SAT and VAT: The“portal theory”(6,20) implicates a direct mechanism whereby VAT is more pathogenic because its ve-nous blood drainage is directly via the por-tal vein to the liver. The “ectopic fat hypothesis”(6) suggests an indirect mech-anism whereby increased energy storage in peripheral SAT exerts a protective effect by decreasing fat deposition in the liver, muscle, and heart. Because abdominal DSAT exhibits an intermediate phenotype between VAT and abdominal SSAT in var-ious functions tested (lipolysis, adipocyto-kine profile) (4), it is possible that these theories can underlie the unique positive association between abdominal SSAT and cardiovascular and metabolic health. Al-though it may be possible that peripheral SAT differs significantly from abdominal SAT, and some studies have indicated the potential pathogenic role of increased abdominal (total) SAT as opposed to pe-ripheral SAT (9–11), further studies are required to fully understand the distinct role of the SSAT subdepot. It is tempting to speculate that discrepancies in the liter-ature among studies assessing associations between abdominal SAT and morbidity were confined by differences in the SSAT or SSAT/DSAT distribution.
Nutritional habits may also affect fat distribution. In our study, increasedtrans fatty acids consumption tended to be asso-ciated with increased total abdominal SAT and DSAT, but not SSAT. Limited evidence has suggested that increased dietary intake
oftransfatty acids may increase fat
accu-mulation and abdominal circumference (21,22). Although these studies emphasize the increase in VAT, ourfindings suggest that DSAT also may be increased by exces-sive intake oftransfatty acids.
who are relatively protected from cardio-metabolic morbidity, at least before men-opause (6), possess up to twice as much subcutaneous fat as men (25,26). Of note, although sexual dimorphism in fat distri-bution usually tends to diminish with postmenopausal state, we observed such changes in our cohort despite the fact that most (11/12) women were postmeno-pausal. Thisfinding may complement a prior report that postmenopausal women who possess a higher proportion of adi-pose tissue located in the total midthigh depot had a more favorable metabolic pro-file (25). Although studies have reported an association between hormone replace-ment therapy and cardiovascular health (27,28), none of the women in our study were on such therapy. Future studies will unravel whether increased abdominal SSAT and its seemingly favorable meta-bolic and cardiovascular correlates dimin-ish with years into menopause, or have other determinants, possibly unique to persons with diabetes.
Finally, it has been proposed that anti-diabetic medications, particularly of the thiazolidinedione family, may exert their therapeutic effect at least partially by in-ducing redistribution of fat from“ patho-genic” to“less-pathogenic” depots (e.g., from VAT to SAT) (29,30). However, none of the patients in our study were re-ceiving thiazolidinedione therapy. Other hypoglycemic medications were distrib-uted similarly among tertiles of SSAT and controlled for in the regression models.
In summary, the current study adds to the understanding of the pattern of abdominal fat distribution, including “sub-depots,”and its relation to glycemic control and cardiovascular risk in diabetic patients. Effective interventions that can alter abdominal fat distribution may help sort out whether fat distribution pheno-types are merely a reflection of obesity sub-phenotypes or can causally affect risk and severity of obesity-associated morbidities.
AcknowledgmentsdGrant to I.S. was
pro-vided by the European Foundation for the Study of Diabetes of the European Association for the Study of Diabetes for the study of the 2-year CASCADE randomized controlled trial.
No potential conflicts of interest relevant to this article were reported.
R.G. researched data, performed statistical analyses, and wrote the manuscript. I.S. per-formed data analysis and contributed to dis-cussion. A.R. designed the study, performed data analysis, and wrote the manuscript. Y.G.,
E.S., Y.C., D.S., S.B.A., S.W., I.F.L., O.T.-.R., and B.S. researched data. I.H.-B. and Y.H. re-searched data, contributed to discussion, and reviewed and edited the manuscript. M.J.S. edited the manuscript and contributed to dis-cussion. I.S. (CASCADE Principal Investigator) contributed to discussion and reviewed and edited the manuscript. I.S. is the guarantor of this work and, as such, had full access to all the data in the study and takes responsibility for the integrity of the data and the accuracy of the data analysis.
This work is dedicated to Harel Segal, our fellow colleague, who died during the study at the age of 43 years. The authors thank the par-ticipants in the CASCADE randomized con-trolled trial for consistent cooperation; the following consultants and health care providers: Hassia Krakauer, Meir Aviv, Haim Strasler, Dr. Ziva Schwartz, Dr. Einat Sheiner, Dr. Dov Brickner, Rachel Marko, Esther Katorza, and Ilanit Asulin (from the Nuclear Research Center Negev); Dr. Tatiana Shuster, Sagit Kachlon, Yasmin Asuly, and Roman Tsirkin (from the Soroka University Medical Center); and Dr. Lena Novack and Dana Sarfaty (from The S. Daniel Abraham International Center for Health and Nutrition, Faculty of Health Scien-ces, Ben-Gurion University of the Negev).
References
1. Hamdy O, Porramatikul S, Al-Ozairi E. Metabolic obesity: the paradox between visceral and subcutaneous fat. Curr
Dia-betes Rev 2006;2:367–373
2. Fox CS, Massaro JM, Hoffmann U, et al. Abdominal visceral and subcutaneous adipose tissue compartments: association with metabolic risk factors in the Fra-mingham Heart Study. Circulation 2007;
116:39–48
3. Matsushita Y, Nakagawa T, Yamamoto S, et al. Associations of visceral and sub-cutaneous fat areas with the prevalence of metabolic risk factor clustering in 6,292 Japanese individuals: the Hitachi Health Study. Diabetes Care 2010;33:
2117–2119
4. Sniderman AD, Bhopal R, Prabhakaran D, Sarrafzadegan N, Tchernof A. Why might South Asians be so susceptible to central obesity and its atherogenic consequences? The adipose tissue overflow hypothesis.
Int J Epidemiol 2007;36:220–225
5. Deschênes D, Couture P, Dupont P, Tchernof A. Subdivision of the subcu-taneous adipose tissue compartment and lipid-lipoprotein levels in women. Obes
Res 2003;11:469–476
6. Gallagher D, Kelley DE, Yim JE, et al.; MRI Ancillary Study Group of the Look AHEAD Research Group. Adipose tissue distribu-tion is different in type 2 diabetes. Am J
Clin Nutr 2009;89:807–814
7. Laakso M. Cardiovascular disease in type 2 diabetes: challenge for treatment and
pre-vention. J Intern Med 2001;249:225–235
8. Goodpaster BH, Thaete FL, Simoneau JA, Kelley DE. Subcutaneous abdominal fat and thigh muscle composition pre-dict insulin sensitivity independently of
visceral fat. Diabetes 1997;46:1579–
1585
9. Porter SA, Massaro JM, Hoffmann U,
Vasan RS, O’Donnel CJ, Fox CS.
Abdom-inal subcutaneous adipose tissue: a pro-tective fat depot? Diabetes Care 2009;32:
1068–1075
10. Bays HE, Fox KM, Grandy S; SHIELD Study Group. Anthropometric measure-ments and diabetes mellitus: clues to the
“pathogenic”and“protective”potential of
adipose tissue. Metab Syndr Relat Disord
2010;8:307–315
11. Johnson JA, Fried SK, Pi-Sunyer FX, Albu JB. Impaired insulin action in subcuta-neous adipocytes from women with vis-ceral obesity. Am J Physiol Endocrinol
Metab 2001;280:E40–E49
12. Koska J, Stefan N, Votruba SB, Smith SR, Krakoff J, Bunt JC. Distribution of subcutaneous fat predicts insulin ac-tion in obesity in sex-specific manner.
Obesity (Silver Spring) 2008;16:2003–
2009
13. Kelley DE, Thaete FL, Troost F, Huwe T, Goodpaster BH. Subdivisions of subcuta-neous abdominal adipose tissue and in-sulin resistance. Am J Physiol Endocrinol
Metab 2000;278:E941–E948
14. Snijder MB, Visser M, Dekker JM, et al. Low subcutaneous thigh fat is a risk factor for unfavorable glucose and lipid levels, independently of high abdominal fat. The Health ABC Study. Diabetologia 2005;48:
301–308
15. Thomas EL, Bell JD. Influence of under-sampling on magnetic resonance imaging measurements of intra-abdominal adi-pose tissue. Int J Obes Relat Metab Disord
2003;27:211–218
16. Task Force of the European Society of Cardiology and the North American So-ciety of Pacing and Electrophysiology. Heart rate variability: standards of mea-surement, physiological interpretation and
clinical use. Circulation 1996;93:1043–
1065
17. Shai I, Shahar DR, Vardi H, Fraser D. Se-lection of food items for inclusion in a newly developed food-frequency ques-tionnaire. Public Health Nutr 2004;7:
745–749
18. Poanta L, Porojan M, Dumitrascu DL. Heart rate variability and diastolic dys-function in patients with type 2 diabetes
mellitus. Acta Diabetol 2011;48:191–
196
19. Miyazaki Y, Glass L, Triplitt C,
Wajcberg E, Mandarino LJ, DeFronzo RA. Abdominal fat distribution and pe-ripheral and hepatic insulin resistance in type 2 diabetes mellitus. Am J Physiol
Endocrinol Metab 2002;283:E1135–
20. Björntorp P.“Portal”adipose tissue as a generator of risk factors for cardiovascular disease and diabetes. Arteriosclerosis 1990;
10:493–496
21. Micha R, Mozaffarian D. Trans fatty acids: effects on cardiometabolic health and im-plications for policy. Prostaglandins Leukot
Essent Fatty Acids 2008;79:147–152
22. Koh-Banerjee P, Chu NF, Spiegelman D, et al. Prospective study of the association of changes in dietary intake, physical activity, alcohol consumption, and smok-ing with 9-y gain in waist circumference among 16 587 US men. Am J Clin Nutr
2003;78:719–727
23. Bertrais S, Balkau B, Vol S, et al. Rela-tionships between abdominal body fat distribution and cardiovascular risk
fac-tors: an explanation for women’s healthier
cardiovascular risk profile. The D.E.S.I.R. Study. Int J Obes Relat Metab Disord 1999;
23:1085–1094
24. Rossi AP, Fantin F, Zamboni GA, et al. Predictors of ectopic fat accumulation in liver and pancreas in obese men and women. Obesity (Silver Spring) 2011;19:
1747–1754
25. Westerbacka J, Cornér A, Tiikkainen M, et al. Women and men have similar amounts of liver and intra-abdominal fat, despite more subcutaneous fat in women: impli-cations for sex differences in markers of cardiovascular risk. Diabetologia 2004;47:
1360–1369
26. Piché ME, Lapointe A, Weisnagel SJ, et al. Regional body fat distribution and metabolic profile in postmenopausal
women. Metabolism 2008;57:1101–1107
27. Taylor HS, Manson JE. Update in hor-mone therapy use in menopause. J Clin
Endocrinol Metab 2011;96:255–264
28. Harman SM, Vittinghoff E, Brinton EA, et al. Timing and duration of menopausal hormone treatment may affect cardiovas-cular outcomes. Am J Med 2011;124:
199–205
29. Nam JS, Nam JY, Yoo JS, et al. The effect of rosiglitazone on insulin sensitivity and mid-thigh low-density muscle in patients with Type 2 diabetes. Diabet Med 2010;
27:30–36
30. Virtanen KA, Hällsten K, Parkkola R, et al. Differential effects of rosiglitazone and metformin on adipose tissue dis-tribution and glucose uptake in type 2
diabetic subjects. Diabetes 2003;52:283–
290