promoting access to White Rose research papers
White Rose Research Online
[email protected]
Universities of Leeds, Sheffield and York
http://eprints.whiterose.ac.uk/
This is a copy of the final published version of a paper published via gold open access
in
Social Science and Medicine
.
This open access article is distributed under the terms of the Creative Commons
Attribution Licence (http://creativecommons.org/licenses/by/3.0), which permits
unrestricted use, distribution, and reproduction in any medium, provided the
original work is properly cited.
White Rose Research Online URL for this paper:
http://eprints.whiterose.ac.uk/79558
Published paper
Bansback, N., Hole, A.R., Mulhern, B. and Tsuchiya, A. (2014) Testing a discrete
choice experiment including duration to value health states for large
Testing a discrete choice experiment including duration to value
health states for large descriptive systems: Addressing design and
sampling issues
Nick Bansback
a,b,*, Arne Risa Hole
c, Brendan Mulhern
d, Aki Tsuchiya
c,daSchool of Population and Public Health, University of British Columbia, 2206 East Mall, Vancouver, BC V6T 1Z3, Canada bCentre for Health Evaluation and Outcome Sciences, St Paul’s Hospital, Vancouver V6Z 1Y6, Canada
cDepartment of Economics, University of Sheffield, Sheffield S1 4DT, UK
dHealth Economics and Decision Science, School of Health and Related Research, University of Sheffield, Regent Court, Sheffield S1 4DA, UK
a r t i c l e i n f o
Article history:
Received 23 April 2013 Received in revised form 16 May 2014
Accepted 19 May 2014 Available online 20 May 2014
Keywords:
UK
Health-state valuation Discrete choice experiment EQ-5D-5L
a b s t r a c t
There is interest in the use of discrete choice experiments that include a duration attribute (DCETTO) to
generate health utility values, but questions remain on its feasibility in large health state descriptive systems. This study examines the stability of DCETTOto estimate health utility values from thefive-level
EQ-5D, an instrument with depicts 3125 different health states. Between January and March 2011, we administered 120 DCETTOtasks based on thefive-level EQ-5D to a total of 1799 respondents in the UK
(each completed 15 DCETTO tasks on-line). We compared models across different sample sizes and
different total numbers of observations. We found the DCETTOcoefficients were generally consistent, with
high agreement between individual ordinal preferences and aggregate cardinal values. Keeping the DCE design and the total number of observationsfixed, subsamples consisting of 10 tasks per respondent with an intermediate sized sample, and 15 tasks with a smaller sample provide similar results in comparison to the whole sample model. In conclusion, wefind that the DCETTOis a feasible method for developing
values for larger descriptive systems such as EQ-5D-5L, andfind evidence supporting important design features for future valuation studies that use the DCETTO.
2014 The Authors. Published by Elsevier Ltd. This is an open access article under the CC BY license (http://creativecommons.org/licenses/by/3.0/).
1. Introduction
In the absence of suitable market data, stated preference surveys have become an important source of data for informing health policy. In these surveys, choices over hypothetical scenarios are used to elicit individuals’preferences for the attributes making up those scenarios. Two crucial design aspects to these surveys are: the type of preference elicitation technique, and the number of choices each respondent faces.
For policy decisions regarding the cost-effectiveness of health care interventions, there is much debate over the most suitable type of health state valuation technique to use. Conventional ap-proaches have focussed on choice based techniques such as the Time Trade Off (TTO) and the Standard Gamble, whereby a value for each health state is identified for each respondent through an
‘iterative’ procedure that homes in on a point of indifference. However, both techniques have several shortcomings. First, they can be cognitively challenging (Patrick et al., 1994; Dolan et al., 1996) generating individual responses that are either logically inconsistent or otherwise difficult to accept at face value (e.g. all health states have the same value) (Craig and Ramachandran, 2006). These observations are typically excluded from analysis, which would potentially reduce the representativeness of the sample. Second, the iterative administration introduces biases because of the pathway through which values are elicited (Ternent and Tsuchiya, 2013), leading to distributions of values that are discontinuous (with a gap between the best and next best state; Stalmeier et al., 2005) and bimodal (for mild/moderate states and severe states). Third, the treatment of negative values can be arbitrary and controversial (Lamers, 2007). The exception to this last point is the introduction of“lead time”in TTO (Devlin et al., 2011), but this method has its own problems, such as a framing effect caused by the lead time (Devlin et al., 2013).
As a consequence, there has been a growing interest in devel-oping alternative valuation techniques. One focus of research has *Corresponding author. School of Population and Public Health, University of
British Columbia, 2206 East Mall, Vancouver, BC V6T 1Z3, Canada.
E-mail address:[email protected](N. Bansback).
Contents lists available atScienceDirect
Social Science & Medicine
j o u r n a l h o m e p a g e : w w w . e l s e v i e r . c o m / l o c a t e / s o c s c i m e d
http://dx.doi.org/10.1016/j.socscimed.2014.05.026
been on the use of ordinal preferences using ranking (McCabe et al., 2006), Discrete Choice Experiments (DCEs) (Ryan et al., 2006; Rowen et al., 2012) or Best Worst Scaling (Coast et al., 2008). Since the DCEs are based on random utility theory, it models peo-ples’observed choices assuming they include error. In other words, it is more robust and can accommodate respondents making mis-takes in the valuation exercise. Further, some biases introduced by the particular ordering in which preferences are elicited by an iterative procedure can be avoided. Finally, while DCE values are estimated on an unobserved and arbitrarily anchored latent scale, they can be anchored on the health utility scale with 1 for full health and 0 for dead by incorporating duration as an attribute of the DCE (Bansback et al., 2012; Flynn, 2010; Norman et al., 2013; Viney et al., 2014). This task closely resembles the conventional TTO (and is thus referred to as the DCETTO), but does not require a
separate task or data manipulation for states considered worse than dead.
While the DCETTOappears to be a promising technique for use in
future stated preference surveys, two practical knowledge gaps exist, that this paper aims tofill. First, it is unknown whether the DCETTOwill be feasible in valuing larger descriptive systems. The
original DCETTO (Bansback et al., 2012) valued the three-level
version of EQ-5D (Brooks, 1996), which has only 243 possible health states. A majority of health state descriptive systems have more attributes and more attribute levels resulting in considerably larger numbers of plausible health states. Since the DCETTO
com-pares different plausible health states with different durations, larger descriptive systems lead to exponentially larger experi-mental designs which may result in impractically large numbers of required valuations. A second related knowledge gap is how many DCETTOtasks each respondent should be asked. In contrast to the
large literature on the statistical design of DCEs (see e.g.Carlsson and Martinsson, 2003) there is more mixed evidence on the optimal number of tasks to allocate to respondents in a choice experiment (Louviere et al., 2013). Often, well developed fractional factorial designs for tasks with reasonable numbers of attributes and levels generate a greater number of choice sets than what is considered feasible to complete for a single respondent, which means that in practice the choice tasks tend to be“blocked”into subsets of the full design, and each allocated to a subset of re-spondents. If there is a learning effect so that respondents need to try out a few DCE tasks before they can generate stable data, then the blocks will need to be of a certain size. On the other hand, if there is a fatigue effect, then there will be a limit to the size of each block. The decision for the number of tasks to give each respondent therefore is related to the number of respondents.
This paper seeks to establish whether the DCETTOis an judicious
alternative protocol for deriving population value sets for large descriptive systems such as the EQ-5D-5L (Herdman et al., 2011). We do this by examining both empirical observations and practical design issues to investigate further the feasibility of the approach, and inform the design of future DCETTOstudies. The paper begins by
describing the survey and design of the DCETTO. The following
section describes the methods used to address our two aims. Our first aim is to examine whether DCETTOcan appropriately be used to
value a larger descriptive system such as the EQ-5D-5L. We examine four specific objectives including whether the results are consistent, how they compare to previous DCETTOmodels, whether
respondents trade time and whether there is agreement between ordinal and aggregate values. Our second aim is to explore how best to design the survey considering the number of tasks and re-spondents. We examine three specific objectives including whether there are learning and/or fatigue effects, and whether using different numbers of tasks per respondent and sample sizes (holding the design and overall number of observations constant)
have an effect. The results section is followed by a discussion that summarizes the evidence for the DCETTO in future studies, and
addresses notable limitations.
2. Methods
2.1. Elicitation task design
The DCETTOtask used in this study considers pairs of scenarios,
each based on the health states described by thefive attributes of the EQ-5D-5L (mobility, self care, usual activities, pain/discomfort and anxiety/depression) and an additional duration attribute. In contrast to the three-level EQ-5D, thefive-level EQ-5D-5L adds two intermediate levels of severity (none, slight, moderate, severe, extreme/unable). Each scenario asked a respondent to consider themselves living in a particular health state for one of three levels of durationT(whereT¼1, 5, or 10 years) followed by death. The longest duration was set to 10 years to be commensurate with the standard time frame of the TTO protocol used in the EQ-5D valu-ation study (Dolan, 1997). The DCETTOtask requires each
respon-dent to select the scenario they prefer.Fig. 1displays an example of a task used in the study.
2.2. Health state scenario selection and allocation
Combining each EQ-5D-5L state with three levels of duration amounts to 9375 possible scenarios and therefore 87.9 m possible DCETTOscenario pairs (tasks) to choose from. As is explained below,
DCETTOmodels the pairwise choice data in terms of interactions
between the health state and duration. The number of choice tasks for DCEs with two alternatives needs to be at least as large as the number of parameters to be estimated (Orme, 2010). In this case, the maximum number of parameters for DCETTOof EQ-5D-5L with
three categorical levels for duration would be 62 (the sum of: EQ-5D-5L main effects 5 (51)¼20; categorical duration main effects 31¼2; and interactions 202¼40). To further increase confidence in the parameter estimates, we selected 120 tasks based on a D-efficient design derived using the modified Fedorov algo-rithm (e.g.Carlsson and Martinsson, 2003; Kuhfeld, 2005). The D-efficiency was calculated assuming that the true model is a con-ditional logit model with zero priors for the coefficients. Ten different designs were created, based on different random starting points for the design algorithm, and found to have comparable efficiency levels. One design included a higher number of tasks (18 (15%)) where duration differed between the scenarios, and there-fore was selected for use in the study. The EQ-5D-5L may produce implausible health state combinations (for example extreme problems with mobility but no problems with usual activities), and it would be possible to use a restricted design to avoid these. However, we used an unrestricted design, and checked the states selected for implausible combinations of attribute levels, but found none.
2.3. Survey design
The DCETTOstudy was administered using an on-line survey.
Each respondent completed 15 DCETTOtasks across three
experi-mental“modules”, each made up offive tasks. The survey had 36
modules across the 36 versions, a given block appeared in three different versions, each in a different position.
The 36 blocks were allocated across the 36 versions so that, where appropriate, the data could be analysed in three different
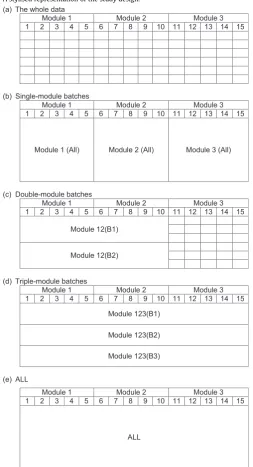
“batches”. This enabled us to compare the results across different sample size and task number combinations, keeping the design and the number of observations constant.Table 1gives a stylised rep-resentation of the design. Panel (a) represents the entire data. Each row represents six of the 36 versions, or in other words a sixth of the whole sample, and each column corresponds to one DCE task, grouped into three modules offive tasks. Assuming a sample size of 1800, each cell corresponds to 300 respondents answering one DCETTO task, whereas the whole grid represents 27,000 DCETTO
observations.
Thefirst set of batches is“single-module batches”and consists of five DCETTOtasks per respondent, based on one Module across all
respondents. Therefore, each single-module batch would total 9000 DCETTOobservations. These are called“Module1 (All)”,“Module2
(All)”and“Module3 (All)”, depending on which Module the data come from. These single-module batches are illustrated inTable 1 (b). The second set of batches is “double-module batches” and comprises 10 DCETTOtasks per respondent, based on Modules 1 and
2 of half the respondents. Each double-module batch has 900 re-spondents, and includes 9000 observations. Two such batches are possible depending on which half of the sample, and these are called “Module12 (B1)” and “Module12 (B2)”. These double-module batches are illustrated inTable 1(c).
The third set of batches is“triple-module batches”and contains 15 DCETTOtasks per respondent, based on Modules 1, 2, and 3 of a
third of the respondents. Each triple-module batch has 600 re-spondents providing 9000 observations. Three such batches are possible, referred to as“Module123 (B1)”,“Module123 (B2)”and
“Module123 (B3)”. These triple-module batches are illustrated in Table 1(d). Note that the total number of DCETTO observations
(9000) and the make-up of the tasks (180) are kept constant across all the above batches.
Finally, the whole dataset“ALL”(n¼1,800, 15 DCETTOtasks each,
27,000 observations) is inTable 1(e).
2.4. Recruitment and the sample
Respondents were recruited from an existing commercial internet panel, and were selected according to quotas based on the UK general population for age (acrossfive age groupings 18e24; 25e
34; 35e44; 45e54; 55e65) and gender. Invitations were sent out by e-mail, and if the respondent and respondents clicked a link to ac-cess the survey. They then read detailed project information and consented to take part. If the quota category a potential respondent belonged to was full, they were screened out prior to entering the survey. Respondents were also screened out if they completed the survey in less than the minimum completion time of 3 min.
Respondents entering the surveyfirstly completed demographic and self reported health status, health and life satisfaction questions, and EQ-5D-5L for their own health. They were then presented with information about the DCETTOtasks including the attributes used,
[image:4.595.108.479.65.159.2] [image:4.595.30.284.263.731.2]and instructed to imagine that they would experience each health state for the period shown without relief or treatment, that death Fig. 1.DCETTOquestion example.
Table 1
A stylised representation of the study design.
(a) The whole data
Module 1 Module 2 Module 3 1 2 3 4 5 6 7 8 9 10 11 12 13 14 15
(b) Single-module batches
Module 1 Module 2 Module 3 1 2 3 4 5 6 7 8 9 10 11 12 13 14 15
Module 1 (All) Module 2 (All) Module 3 (All)
(c) Double-module batches
Module 1 Module 2 Module 3 1 2 3 4 5 6 7 8 9 10 11 12 13 14 15
Module 12(B1)
Module 12(B2)
(d) Triple-module batches
Module 1 Module 2 Module 3 1 2 3 4 5 6 7 8 9 10 11 12 13 14 15
Module 123(B1)
Module 123(B2)
Module 123(B3)
(e) ALL
Module 1 Module 2 Module 3 1 2 3 4 5 6 7 8 9 10 11 12 13 14 15
would be very swift and completely painless, and that they would have no other health problems besides what was indicated. A practice task was then completed, followed by the three question modules. The survey was designed and hosted by the market research company. Ethical approval was obtained from the Univer-sity of Sheffield, School of Health and Related Research Ethics committee.
2.5. Analysis
To determine the coefficients for the DCETTOthe analysis described
inBansback et al. (2012)is followed. Briefly, the utility
m
of each respondentiis defined to be a function between a vector of levels for each EQ-5D attributexand life yearstin each scenariojso that:m
ij ¼a
þb
tijþl
0xijtijþ˛ij (1)Of these, the constantacan be included to examine left/right bias, but is expected to be equal to zero;
b
represents the value of living in full health for the specified duration and is expected to be positive;l
represents the disutility of living with the specified set of EQ-5D-5L health problems for the same duration and thus is ex-pected to be negative; andεijis a random term which is assumed to be IID extreme value type 1 distributed. Duration is treated as continuous and conditional logit regression is used to estimate the coefficients.Bansback et al. (2012)show that the values for each individual health state can be anchored on the health utility scale (V) by solving a conventional TTO paired comparison where living in full health fortyears is equivalent to living in health statexfor 10 years using the estimated coefficients from (1). This is analogous to Norman et al. (2013)andViney et al. (2014)and can be solved as:
Vj ¼ 1þ
b
l
0b
b
xj (2)The value of a health state is expressed in two arguments: the value of full health and the disutility determined by EQ-5D-5L. For the state of full health, b
l
0xj ¼ 0 and so V ¼ 1. A health state equivalent to being dead can be conceived as one where the disutility associated with the state (bl
0xj) exactly cancels out the utility associated with full health (bb
), so that bl
0xj.b
b
¼ 1 andthereforeV¼0. If the state is severe, then the absolute value ofb
l
0xj may exceedbb
, or in other words, the magnitude of the disutility associated with the state may be larger than the difference between full health and being dead. If so, this would result in a negativeV, implying a state worse than being dead.Note that the anchoring of the utility function for dead at 0 is achieved through the relative size of the two regression coefficients
b
andl
in equation(1)above, and does not require the inclusion of the state of being dead in the DCETTO, or as a supplementaryquestion. The anchoring of the utility function for full health at the value 1 is achieved through equation(2): since b
l
0xj¼0 for full health, equation(2)anchors full health at whatever value given in thefirst argument.Objective 1. To determine if the DCETTO can produce logically
consistent values for EQ-5D-5L, with more detailed levels than the three-level EQ-5D.
Coefficients for each attribute were compared to identify if worse levels had lower values. Two visual inspections were used. First, the anchored coefficients grouped by attribute were plotted on a graph alongside their confidence intervals. Second, a histo-gram of the 3125 predicted values was drawn.
Objective 2. To compare the consistency of the level coefficients for each attribute with those of the original three-level EQ-5D study (Bansback et al., 2012).
The levels of anchored coefficients were compared with a cor-responding plot based on the coefficients from the original three-level EQ-5D study.
Objective 3. To assess the impact of adding the duration attribute to a DCE, by examining how respondents traded length of time for quality of life, i.e. whether respondents chose the scenario with a shorter duration.
Three additional analyses were performed to assess whether respondents trade time when presented with scenarios where duration differs. Firstly, time trading behaviour was explored by examining the frequencies of respondents who were willing to trade time when presented with a task where duration differed between the scenarios. The proportions of respondents choosing the shorter duration was investigated irrespective of the EQ-5D-5L state presented. Second, the proportion of respondents who sometimes chose the longer and sometimes chose the shorter duration was examined, where the pairs presented allowed us to investigate this. Third, trading behaviour was assessed in relation to the utility value associated with each health scenario included in the task where duration differs.
Objective 4. To explore the extent of agreement between indi-vidual ordinal preferences and aggregate cardinal values.
The difference in the value of the health scenario in terms of Quality Adjusted Life Years (QALYs) was calculated across the 120 tasks, to represent the aggregate cardinal values. The value for each scenario is based on the predicted value of the EQ-5D-5L state multiplied by the specified duration. The differences in QALYs across tasks were then compared to the proportion of respondents choosing each scenario. If the majority chose the health state sce-nario with the lower predicted QALYs, then this would indicate a
“disagreement” between individual ordinal preferences and aggregate cardinal values.
Objective 5. To explore the existence of learning or fatigue effects, i.e. whether respondents answer the choices at the beginning of the experiment less or more consistently than the choices towards the end.
First, the predicted values obtained from models estimated on the three single-module batches Module1 (All), Module2 (All) and Module3 (All) are compared against each other, and against the predicted values for the whole sample. Since these single-module batches represent thefirst, second andfinal modules respondents answered, a divergence in the predictions can be interpreted as evidence of learning and fatigue effects. Second, along the lines of Bradley and Daly (1994), we estimate a model on the full sample in which the scale of the error term is allowed to vary by batch1. Since the scale is inversely proportional to the error variance, a decrease in scale towards the end of the choice sequence can be interpreted as a fatigue effect, and vice versa. Furthermore, the likelihood-ratio statistic
LR ¼ 2ðLLRLLUÞ
can be used to test the null hypothesis that the respondents’
2006b).LLUis the sum of the log likelihoods of the three models estimated on the batch-specific subsamples. Together, these form the unrestricted model, which allows for variations in both scale and preferences by batch. Under the null the test statistic is
c
2 distributed with 40 degrees of freedom (the number of degrees of freedom is given by the number of parameters in the unrestricted model minus the number of parameters in the restricted model).Objective 6. To compare obtaining more DCETTOanswers from a
smaller sample and fewer DCETTOanswers from a larger sample,
holding the total number of DCETTO answers and the design
constant.
A visual inspection of values from the single-module batch Module1 (All), the two double-module batches, and the three triple-module batches was performed using scatter plots. The two further single-module batches using later modules cannot be used for this analysis, since in a real survey respondents cannot answer a later module without having answered the earlier modules.
Objective 7. To examine the effect of sample size and the number of observations, holding the design constant.
We further inspected the scatter plots (objective 6) holding the design constant, using batches Module1 (All), Module12 (All), and ALL.
3. Results
3.1. Sample
Between January and March 2011, 5552 respondents were invited to take part, and 4513 (81%) respondents accessed the survey. Of these, 1183 (26% of those accessing the survey) were turned away because their quota was full, leaving 3330 (74%) to enter the survey. Of these, 1020 (31%) dropped out before reaching the DCETTOquestions (321 at the informed consent stage; 296 at the
demographics stage; and 403 at the health and satisfaction ques-tions stage). Of the remaining 2310 who entered the DCETTO
questions, 23, 50, and 33 dropped out during thefirst, second, and third modules respectively. A further nine completed all the DCETTO
questions but failed to formally sign out from the survey and to be counted. Finally, 396 respondents (17% of those who started the DCETTO questions) were excluded because they completed the
[image:6.595.35.285.83.276.2]survey in less than the minimum time limit of 3 min. This results in the full data set obtained from 1799 respondents (40% of those Table 2
Background characteristics.
Characteristic Sample General populatione
n 1799
Female 54% 52%
Age
18e30 30% 26%
31e50 44% 45%
51e66 26% 29%
Mean (SD) 40 (13) 42%
Employment status
In employmenta 58% 62%
Student 9% 7%
Not workingb 17% 21% Marital status
Married or with partner 57% 53%
Education level
Minimum school leaving age 22% n/a Degree or equivalent 42% 22%
Self reported health and satisfaction
In good healthc 77% n/a
Satisfied with healthd 67% n/a
Satisfied with lifed 66% n/a
aEmployed or self employed.
bSeeking work; Unemployed; or Long-term sick. c Excellent, Very good, or Good self reported own health. d Score 6 or above on a scale of 0e10.
eGeneral population stats extracted from the UK Census 2001 (ONS, 2005).
Table 3
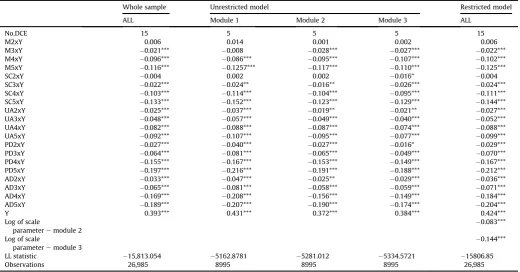
DCETTOcoefficients overall.
Whole sample Unrestricted model Restricted model ALL Module 1 Module 2 Module 3 ALL
No.DCE 15 5 5 5 15
M2xY 0.006 0.014 0.001 0.002 0.006
M3xY 0.021*** 0.008 0.028*** 0.027*** 0.022*** M4xY 0.096*** 0.086*** 0.095*** 0.107*** 0.102*** M5xY 0.116*** 0.1257*** 0.117*** 0.110*** 0.125***
SC2xY 0.004 0.002 0.002 0.016* 0.004
SC3xY 0.022*** 0.024** 0.016** 0.026*** 0.024*** SC4xY 0.103*** 0.114*** 0.104*** 0.095*** 0.111*** SC5xY 0.133*** 0.152*** 0.123*** 0.129*** 0.144*** UA2xY 0.025*** 0.037*** 0.019** 0.021** 0.027*** UA3xY 0.048*** 0.057*** 0.049*** 0.040*** 0.052*** UA4xY 0.082*** 0.088*** 0.087*** 0.074*** 0.088*** UA5xY 0.092*** 0.107*** 0.095*** 0.077*** 0.099*** PD2xY 0.027*** 0.040*** 0.027*** 0.016* 0.029*** PD3xY 0.064*** 0.081*** 0.065*** 0.049*** 0.070*** PD4xY 0.155*** 0.167*** 0.153*** 0.149*** 0.167*** PD5xY 0.197*** 0.216*** 0.191*** 0.188*** 0.212*** AD2xY 0.033*** 0.047*** 0.025** 0.029*** 0.036*** AD3xY 0.065*** 0.081*** 0.058*** 0.059*** 0.071*** AD4xY 0.169*** 0.208*** 0.156*** 0.149*** 0.184*** AD5xY 0.189*** 0.207*** 0.190*** 0.174*** 0.204***
Y 0.393*** 0.431*** 0.372*** 0.384*** 0.424***
Log of scale
parameteremodule 2
0.083***
Log of scale
parameteremodule 3
0.144***
LL statistic 15,813.054 5162.8781 5281.012 5334.5721 15806.85
Observations 26,985 8995 8995 8995 26,985
[image:6.595.34.555.462.734.2]accessing the survey), each completing the whole survey in more than 3 min. This amounts to 40% of those accessed the survey; 54% of those who entered; and 78% of those who started the DCETTO
questions.
The 1799 respondents were generally representative of the UK population with 54% female and a mean age of 40 (Table 2). The background characteristics do not differ across batches or versions (not shown). The number of respondents completing each of the 36 survey versions ranged from 43 to 52. The number of observations for each of the 120 tasks ranged from 145 to 309 (as a number of tasks were repeated in more than one block).
Objective 1. DCETTOcoefficients overall
Table 3 reports the unanchored DCE regression coefficients which are based on a model with no intercept. The model with an intercept results in a small but significantly positive intercept. The other coefficients change slightly, but they only have a negligible effect on the anchored coefficients. The positive intercept suggests that there is a bias towards selecting the scenario presented on the left hand side. The coefficient for mobility level 2 interacted with duration (M2xY) does not have the expected sign, but is not sig-nificant. All other coefficients are ordered as expected.Fig. 2depicts the anchored coefficients and confidence intervals. The vertical axis shows the disutility associated with each level within each attri-bute. The results from the present study are shown by the blue curves. It shows that for example, Mobility level 2 is not statistically significantly different from level 1, and has a positive value indi-cating that utility increases as health level decreases. Elsewhere, all the curves are downward sloping, indicating that the level co-efficients are logically ordered. It also shows that amongst the level 5 coefficients, that for pain/discomfort has the worst disutility, closely followed by anxiety/depression. These two attributes demonstrate a wider gap between levels 3 and 4 than the other three attributes.Fig. 3displays the distribution of the predicted utility scores for all 3125 EQ-5D-5L health states produced from the anchored coefficients. The value predicted for the worst EQ-5D-5L state (55555) is0.845, and 31.5% of the 3125 EQ-5D-5L health states have a negative value (i.e. are worse than dead).
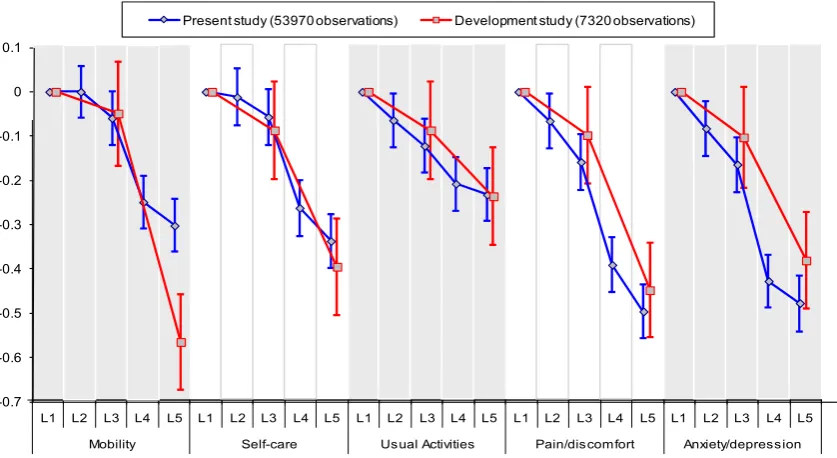
Objective 2. Comparison of coefficients with the three-level EQ-5D study
The red curves inFig. 2are based on the coefficients for three-level EQ-5D obtained inBansback et al. (2012), and so along the horizontal axis, the middle level is replaced with level 3 of EQ-5D-5L and the worst level is placed with level 5 of EQ-5D-EQ-5D-5L. The major difference between the two sets of coefficients is in the worst level of the Mobility attribute. The middle and worst levels for the Anxiety/depression attribute also fall outside the corresponding confidence intervals. Elsewhere, the level 3 and level 5 coefficients from thefive-level model are similar to the level 2 and level 3 co-efficients from the three-level model.
Objective 3. Examining time trading behaviour
Most of the respondents (1597; 88.8%) encountered at least one DCETTOtask where duration differed between scenarios, and the
[image:7.595.91.510.66.295.2]time trading behaviour of respondents by the number of tasks they encountered is displayed inTable 4. Overall, 266 (16.7%) did not Fig. 2.Comparing the anchored coefficients.
[image:7.595.317.559.556.724.2]trade time in any of the tasks that they completed (i.e. always selected the longer duration irrespective of the number of tasks completed where duration differed), and 160 (10.0%) traded every time (i.e. selected the shorter duration for every task completed where duration varied). Therefore 1171 (75.8% of those completing at least two tasks with scenarios of different durations) displayed mixed trading behaviour (sometimes selecting the scenario with the longer duration and sometimes selecting the scenario with the shorter duration).
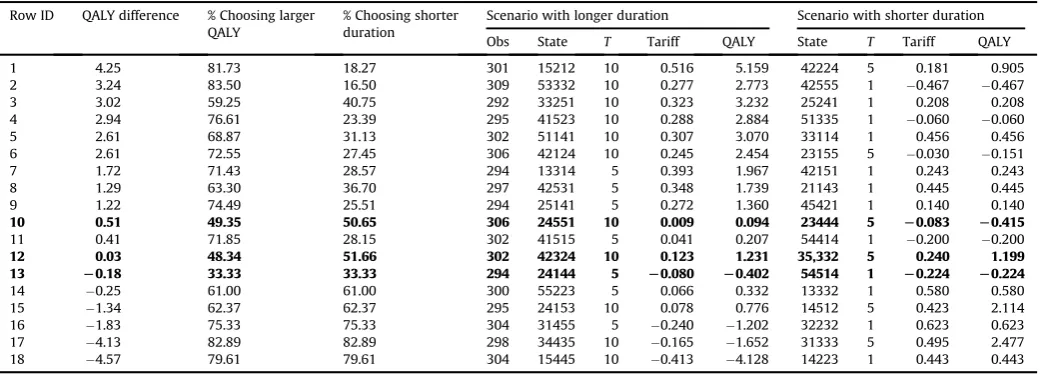
[image:8.595.35.557.85.172.2]Note that if the scenario with the longer duration has more QALYs, then respondents are not expected to trade. Therefore, the 18 tasks with different durations for each scenario were ranked in terms of the gap in QALYs between the scenario with the longer duration and the scenario with the shorter duration: a negative gap indicates that the scenario with shorter duration has more QALYs. Table 5presents this scenario ranking alongside the proportion of respondents selecting the scenario with the longer duration. The overall decreasing pattern observed is as expected: when the ab-solute difference in QALYs is large, a clear majority chooses the scenario with more QALYs; when the absolute difference is smaller, the margin becomes smaller. In three tasks, the majority fails to choose the scenario with more QALYs (rows 10, 12 and 13, in bold). Roughly speaking, where the absolute difference in QALYs is com-parable, it does not seem the case that the split of responses is affected by whether the scenario with more QALYs has a shorter duration. So for example, tasks in rows 1, 17 and 18 have an absolute QALY gap of 4.1e4.5 QALYs, and these tasks have a roughly 80%e
20% split of respondents in favour of the higher-QALY scenario,
regardless of whether the scenario has longer or shorter duration. Similarly, rows 7 and 16 have an absolute QALY gap of 1.8, resulting in a 75%e25% split of respondents; or rows 8 and 15 have a QALY gap of 1.3 and a respondent split of 63%e37%. However, not all tasks follow this pattern.
Objective 4. The extent of agreement between individual ordinal preference and aggregate cardinal values
For each of the 120 DCETTOtasks, we examined the difference in
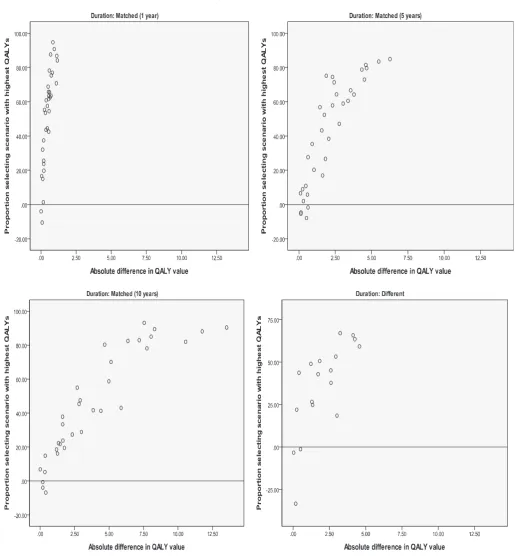
the percentage of respondents choosing the profile with more QALYs over less, so that a positivefigure indicates that the majority of respondents chose the scenario with more QALYs. If all re-spondents facing the same task choose the same scenario, this difference would be 1000¼100; if there is a 50%e50% split, then this difference would be 5050¼0.Fig. 4plots this difference along the vertical axis against the absolute difference in implied QALYs along the horizontal axis, and this is done for four sub-samples: sample 1e3 (top and left panels) are the tasks where duration is matched between scenarios, and sample 4 (bottom right panel) is the tasks where duration differs across scenarios. Across the four samples, most plots are in the positive range, and there is a rough positive correlation so that the further apart in terms of QALYs the two scenarios are, the larger is the proportion of those who choose the scenario with the higher QALYs.
[image:8.595.34.555.547.734.2]For the matched one year sample, there is a group of tasks with very little difference in terms of QALYs, but a large difference in the response split across the tasks. This is because the difference in the health state values across the scenarios is large (between 0.67 and 1.16), but this large difference is not reflected in the
Table 5
Trading behaviour across the 18 tasks where duration differs (ordered by QALY difference (longer durationshorter duration). Row ID QALY difference % Choosing larger
QALY
% Choosing shorter duration
Scenario with longer duration Scenario with shorter duration Obs State T Tariff QALY State T Tariff QALY 1 4.25 81.73 18.27 301 15212 10 0.516 5.159 42224 5 0.181 0.905 2 3.24 83.50 16.50 309 53332 10 0.277 2.773 42555 1 0.467 0.467 3 3.02 59.25 40.75 292 33251 10 0.323 3.232 25241 1 0.208 0.208 4 2.94 76.61 23.39 295 41523 10 0.288 2.884 51335 1 0.060 0.060 5 2.61 68.87 31.13 302 51141 10 0.307 3.070 33114 1 0.456 0.456 6 2.61 72.55 27.45 306 42124 10 0.245 2.454 23155 5 0.030 0.151 7 1.72 71.43 28.57 294 13314 5 0.393 1.967 42151 1 0.243 0.243 8 1.29 63.30 36.70 297 42531 5 0.348 1.739 21143 1 0.445 0.445 9 1.22 74.49 25.51 294 25141 5 0.272 1.360 45421 1 0.140 0.140
10 0.51 49.35 50.65 306 24551 10 0.009 0.094 23444 5 L0.083 L0.415
11 0.41 71.85 28.15 302 41515 5 0.041 0.207 54414 1 0.200 0.200
12 0.03 48.34 51.66 302 42324 10 0.123 1.231 35,332 5 0.240 1.199
13 L0.18 33.33 33.33 294 24144 5 L0.080 L0.402 54514 1 L0.224 L0.224
14 0.25 61.00 61.00 300 55223 5 0.066 0.332 13332 1 0.580 0.580 15 1.34 62.37 62.37 295 24153 10 0.078 0.776 14512 5 0.423 2.114 16 1.83 75.33 75.33 304 31455 5 0.240 1.202 32232 1 0.623 0.623 17 4.13 82.89 82.89 298 34435 10 0.165 1.652 31333 5 0.495 2.477 18 4.57 79.61 79.61 304 15445 10 0.413 4.128 14223 1 0.443 0.443 Tasks where scenario with lower QALYs is chosen by the majority are in bold.
Table 4
Trading behaviour on duration at the overall level.
Nof tasks where duration differs
Nsurvey versions Ncompleting N(%) never trading N(%) always trading N(%) mixed trading
1 1 52 30 (57.7) 22 (42.3) n/a
2 1 50 8 (16.0) 11 (22.0) 31 (62.0)
3 19 944 159 (16.8) 104 (11.0) 681 (72.1)
4 6 299 32 (10.7) 11 (3.7) 256 (85.6)
5 2 101 13 (12.9) 7 (6.9) 81 (80.2)
6 3 151 24 (15.9) 5 (3.3) 122 (80.8)
ALL 31 1597 266 (16.7) 160 (10.0) 1171 (75.81)
difference in QALYs across the scenarios because they are only one year long (so the difference is due to the health state value rather than the overall amount of QALYs, and respondents consistently choose the less severe health state with the larger associated utility value.)
Across the samples, the tasks in the negative range ofFig. 4 indicate a disagreement between the ordinal preference and the implied cardinal values for the tasks. Of the 120 tasks, such a disagreement was observed in 12, all of them with very small
[image:9.595.43.559.54.614.2]discomfort). In terms of QALYs, scenario B is better, but only a third of respondents agreed. The health state values of the respective health states are0.08 for A and0.22 for B, suggesting that there may be a fair proportion of respondents who perceive A is not worse than dead, whereas a larger proportion would agree that B is worse than dead. If a respondent believes scenario A is worse than dead, thenfive years of A may be less preferable than one year of B, so they may choose B. However, if a respondent believes A is better than dead thenfive years of A is more preferable to one year of B, so they choose A. Thus, a small variation in individual perception around dead (viz. slightly better than dead versus slightly worse than dead) for one scenario may lead to the opposite choice be-tween the tasks.
Objective 5. Learning and fatigue effects across DCETTOquestions
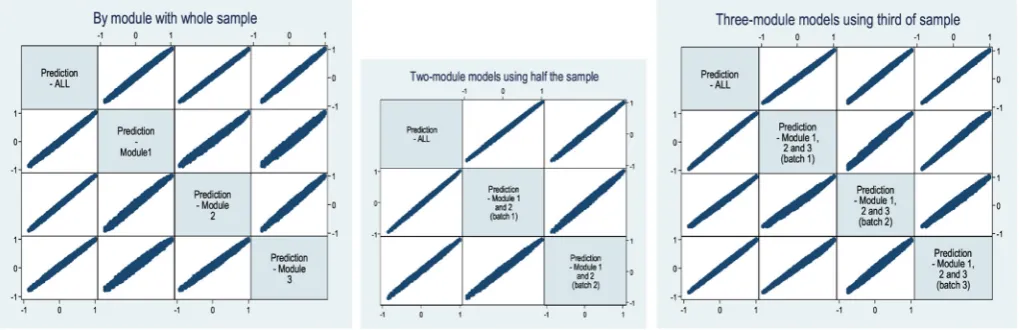
The correlation coefficients of the predicted EQ-5D-5L values across the batches are very high. For example, all the single-module batches have a correlation coefficient ranging from 0.985 for Module1(all) with Module3 (all) to 0.998 for ALL with Module2(all). A scatter plot matrix is given in the left hand panel ofFig. 5. The plots illustrate a very good direct correlation, with no bias by severity. This suggests that the three modules are each capturing similar preferences.
Table 3presents the results for the restricted model which al-lows for scale difference across the three single-module batches. The size of estimated scale parameters increase negatively indi-cating that the error variance is increasing towards the end of the experiment. This suggests a fatigue effect. The LR statistic is 56.78, narrowly rejecting the null of preference homogeneity across the batches at the 5% significance level. The unrestricted models for each of the three single-module batches are also presented.
Objective 6. Comparing more DCETTO answers from a smaller
sample and fewer DCETTOanswers from a larger sample
From a visual inspection of the scatter plot matrices inFig. 5, it can be seen that while there is little to choose between them, the double-module batches in the middle panel achieve the highest concentration of the plots, followed by the triple-module batches in the right hand panel. The relatively less concentrated scatter for the single-module batch Module 1 (All) suggests that asking a large sample of respondentsfive DCETTOquestions may not be the most
efficient way of administering the tasks.
Objective 7. The effect of the size of the sample
Fig. 5suggests that the designs incorporating batches of 10 tasks with an intermediate sized sample, and 15 tasks with a smaller
sample provide relatively stable results in comparison to the whole sample model.
4. Discussion
This study addressed two main research aims. For ourfirst aim, results suggest that the DCETTOis a feasible method for generating
health state utility values for larger descriptive systems such as that found in the EQ-5D-5L. DCETTOproduces generally logically consistent
coefficients across the levels within each the health state attribute, with only one coefficient (Mobility level 2) found to be non-significant (and disordered). The distribution of the predicted values for the 3125 health states is uni-modal, and there is no significant gap between the value for the best state (i.e.11111), and the next best state (11211). This is in contrast to the EQ-5D MVH value set based on TTO where the distribution of the 243 predicted values is bi-modal, and there is a difference of 0.117 between the best (11111) and next best health state (11211). Thefive-level coefficients generated in this study are largely comparable with the three-level coefficients generated inBansback et al. (2012). The only major difference in comparable levels be-tween the three- and thefive-level versions of EQ-5D was in the worst level of mobility. Since the wording has changed substantially, from
“confined to bed”(EQ-5D mobility level 3) to“unable to walk about”
[image:10.595.39.549.69.234.2]For our second aim, although we found evidence of a fatigue effect, our analysis indicates that 10 or 15 DCETTOtasks may be
better thanfive DCETTOtasks per respondent. In a recent
compre-hensive review,de Bekker-Grob et al. (2012)find that the mean number of choice sets per respondent in health-related DCEs is 14 andBridges et al. (2011)suggest that including 8 to 16 choice tasks is good practice. However, this recommendation does not appear to have been based on empirical evidence which has mixedfindings. For exampleLouviere et al. (2013)finds little impact on completion rates or response quality when asking 32 versus 16 choice tasks whileRose et al. (2009)found a large influence on response quality in one of the study groups when varying the number of choice sets from 9 to 15. Ultimately, fatigue effects will be associated with the complexity of the specific taskefor exampleLouviere et al. (2013) finds that using more than two alternatives and more than 6 at-tributes had a larger influence on completion rates. Based on our findings, we are able to recommend that asking 10 to 15 DCETTO
tasks is more efficient that asking more respondents fewer tasks, but do not rule out asking more than 15 tasks if time is not restricted. There has been limited formal work to establish the sample size requirements for DCEs (Orme, 2010). Most recently, Rose and Bliemer (2013) have proposed theoretically minimal sample size requirements. We should note however that an objective of many stated preference studies is to obtain values from a representative sample of a given population, and so there may be reasons beyond efficiency to include larger samples.
There are a number of limitations with the study design used which may impact on thefindings presented. Firstly, only 18 of the 120 tasks had differing duration levels between the health sce-narios. To predict utility values, the attribute coefficients are divided by the duration coefficient so any bias in the duration co-efficient will bias the whole model. As can be seen, the confidence interval for the duration coefficient is large in comparison to the others, and it is possible that by increasing the number of tasks where duration varies, the size of the confidence interval could be reduced. At the same time, it should be borne in mind that the number of tasks in which duration may vary is limited by the fact that duration is interacted with the other attributes in the model. To identify the coefficients for these interactions, duration needs to be held constant within some tasks. Future developments of DCETTO
should investigate the impact of increasing the number of tasks where duration differs. This may be achieved by basing the D-ef-ficiency criterion on the covariance matrix of the anchored co-efficients instead of the unanchored coefficients, as was done in the present study. Furthermore, it would also be possible to use a design that restricts implausible EQ-5D-5L states rather than manually checking the plausibility of the attribute combinations produced.
Secondly, there may be a number of concerns about the on-line methodology used (Mulhern et al., 2013). For example, the repre-sentativeness of the sample in terms of unobservable characteris-tics may be an issue. We also did not recruit respondents aged over 65 to take part, meaning that the sample is not fully representative of the adult population. However, our aim is not to develop a na-tional tariff, but empirically test design issues relating to DCETTO. It
should also be noted that on-line panels give a highly cost effective way of achieving a large sample that is representative in terms of observable characteristics in a short space of time. Furthermore, there may be concerns about the fact that most commercial on-line panels offerfinancial rewards for completing surveys, and some panels allow members to participate in a large number of surveys. This may lead to poor quality responses, and it is up to the researcher to examine the relevant features of different on-line panels. Finally, there is limited information available about the level of respondent engagement with the task. The time taken to
complete the survey was recorded, and a minimum completion time was set to attempt to include respondents who engaged with the tasks. However, no further information (or assurance) regarding engagement was available. This is likely to make on-line surveys that use iterative methods (such as TTO where an indifference value is identified for each state from each respondent) more vulnerable than those that use binary choice methods (such as DCE where each respondent only gives ordinal preferences).
Third, our analysis treated duration as a continuous variable assuming constant proportional time trade-off. Previous studies have found this assumption to hold at the aggregate level, but violated at the individual level (Tsuchiya and Dolan, 2005). We acknowledge this design assumption may have led to mis-specification of the indirect utility function, contributing to the error in the model (de Bekker-Grob, 2013). Further exploration of model specification is possible by treating duration as a categorical variable (which the experimental design allows). This further analysis will allow the examination of whether preferences are linear in duration, and indeed whether the QALY model holds.
In conclusion, wefind that the DCETTOis a feasible method that
produces generally logically consistent coefficients for larger descriptive systems such as EQ-5D-5L. Analysis of data in batches indicates that completing 10 to 15 DCETTOtasks per respondent is
better than completingfive tasks. The impact of the total number of observations seems to be a more important factor affecting the stability of the coefficients than how a given number of total ob-servations is allocated across different numbers of respondents.
Acknowledgements
The authors would like to thank the MRC-NIHR Methodology Research Programme for funding the PRET project (Preparatory study for the Re-valuation of the EQ-5D Tariff, MRC ref.G0901500). The EuroQol Group has funded the on-line survey (PRET-Additional Sample project), as an extension to the PRET project with formal agreement from the MRC. Research ethics approval has been given by the ethics committee at the School of Health and Related Research in line with University of Sheffield requirements.
We are grateful to all respondents who took part. We would also like to thank Pelham Barton, Sam England, Ben van Hout, Andy Jamieson, Mandy Ryan, Joshua Salomon, and Elly Stolk for their input. An earlier version of this paper was presented at a Health Economics Study Group meeting (June 2012 Oxford), a EuroQol Group meeting (September 2012 Rotterdam) and at a University of Birmingham seminar. Any remaining errors are ours. The authors of this paper contributed equally to this work and are named in alphabetical order.
References
Bansback, N., Brazier, J., Tsuchiya, A., Anis, A., 2012. Using a discrete choice
exper-iment to estimate societal health state utility values. J. Health Econ. 31 (1), 306e
318.
Bradley, M., Daly, A., 1994. Use of the logit scaling approach to test for rank-order
and fatigue effects in stated preference data. Transportation 21 (2), 167e184.
Brooks, R., EuroQol Group, 1996. EuroQol: the current state of play. Health Policy 37,
35e72.
Bridges, J.F.P., Hauber, A.B., Marshall, D., Lloyd, A., Prosser, L.A., Regier, D.A.,
Johnson, F.R., Mauskopf, J., 2011. Conjoint analysis applications in healthea
checklist: a report of the ISPOR good research practices for conjoint analysis
task force. Val. Health 14, 403e413.
Carlsson, F., Martinsson, P., 2003. Design techniques for stated preference methods
in health economics. Health Econ. 12, 281e294.
Coast, J., Flynn, T.N., Natarajan, L., Sproston, K., Lewis, J., Louviere, J.J., Peters, T.J., 2008. Valuing the ICECAP capability index for older people. Soc. Sci. Med. 67 (5),
874e882.
Craig, B.M., Ramachandran, S., 2006. Relative risk of a shuffled deck: a generalizable logical consistency criterion for sample selection in health state valuation
de Bekker-Grob, E.W., Ryan, M., Gerard, K., 2012. Discrete choice experiments in
health economics: a review of the literature. Health Econ. 21 (2), 145e172.
de Bekker-Grob, E.W., Rose, J.M., Bliemer, M.C., 2013. A closer look at decision and analyst error by including nonlinearities in discrete choice models: implications on willingness-to-pay estimates derived from discrete choice data in
health-care. Pharmaco Econ. 31 (12), 1169e1183.
Devlin, N., Tsuchiya, A., Buckingham, K., Tilling, C., 2011. A uniform time trade off
method for states better and worse than dead: feasibility study of the’Lead
time’approach. Health Econ. 20 (3), 348e361.
Devlin, N., Buckingham, K., Shah, K., Tsuchiya, A., Tilling, C., Wilkinson, G., van Hout, B., 2013. A comparison of alternative variants of lead and lag time TTO.
Health Econ. 22 (5), 517e532.
Dolan, P., 1997. Modeling valuations for EuroQol health states. Med. Care 35, 1095e
1108.
Dolan, P., et al., 1996. Valuing health states: a comparison of methods. J. Health
Econ. 15 (2), 209e231.
Flynn, T.N., 2010. Using conjoint analysis and choice experiments to estimate QALY
values. Pharmacoeconomics 28 (9), 711e722.
Herdman, M., Gudex, C., Lloyd, A., Janssen, M., Kind, P., Parkin, D., Bonsel, G.,
Badia, X., 2011. Development and preliminary testing of the newfive level
version of EQ-5D (EQ-5D-5L). Qual. Life Res. 20 (10), 1727e1736.
Hole, A.R., 2006a. CLOGITHET: Stata Module to Estimate Heteroscedastic Condi-tional Logit Models. Statistical Software Components S456737. Boston College
Department of Economics.
Hole, A.R., 2006b. Small-sample properties of tests for heteroscedasticity in the
conditional logit model. Econ. Bull. 3 (18), 1e14.
Kuhfeld, W.F., 2005. Marketing Research Methods in SAS. SAS Institute Inc., Cary.
Lamers, L., 2007. The transformation of utilities for health states worse than dead:
consequences for the estimation of EQ-5D value sets. Med. Care 45 (3), 238e
244.
Louviere, J.J., Carson, R.T., Burgess, L., Street, D., Marley, A.A.J., 2013. Sequential preference questions factors influencing completion rates and response times
using an online panel. J. Choice Model. 8, 19e31.
McCabe, C., Brazier, J., Gilks, P., Tsuchiya, A., Roberts, J., O’Hagan, A., Stevens, K., 2006.
Estimating population cardinal health state valuation models from individual
ordinal (rank) health state preference data. J. Health Econ. 25 (3), 418e431.
Mulhern, B., Longworth, L., Brazier, J., Rowen, D., Bansback, N., Devlin, N., Tsuchiya, A., 2013. Binary choice health state valuation and mode of
adminis-tration: head-to-head comparison of online and CAPI. Val. Health 16 (1), 104e
113.
Norman, R., Cronin, P., Viney, R., 2013. A pilot discrete choice experiment to explore preferences for EQ-5D-5L health states. Appl. Health Econ. Health Policy 11 (3),
287e298.
Orme, B., 2010. Sample Size Issues for Conjoint Analysis Studies. Sawtooth Software
Technical Paper, Sequim.
Patrick, D.L., et al., 1994. Measuring preferences for health states worse than death.
Med. Decis. Mak. 14 (1), 9e18.
Robert, J., Dolan, P., 2004. To what extent do people prefer health states with higher
values? A note on evidence from the EQ-5D valuation set. Health Econ. 13, 733e
737.
Rose, J.M., Hensher, D.A., Caussade, S., Ortúzar, J.D., Jou, R.C., 2009. Identifying dif-ferences in willingness to pay due to dimensionality in stated choice
experi-ments: a cross country analysis. J. Transp. Geogr. 17 (1), 21e29.
Rose, J.M., Bliemer, M.C., 2013. Sample size requirements for stated choice
experi-ments. Transportation, 1e21.
Rowen, D., Brazier, J., van Hout, B., 2012. A comparison of methods for converting
DCE values onto the full health-dead QALY scale. HEDS Discuss. Pap. 11/15.
Ryan, M., Netten, A., Skatun, D., Smith, P., 2006. Using discrete choice experiments to estimate a preference-based measure of outcome-an application to social
care for older people. J. Health Econ. 25, 927e944.
Stalmeier, P.F.M., Busschbach, J.J.V., Lamers, L.M., Krabbe, P.F.M., 2005. The gap
ef-fect: discontinuities of preferences around dead. Health Econ. 14, 679e685.
Swait, J., Louviere, J., 1993. The role of the scale parameter in the estimation and
comparison of multinomial logit models. J. Mark. Res. 30 (3), 305e314.
Ternent, L., Tsuchiya, A., 2013. A note on the expected biases in conventional
iter-ative health state valuation protocols. Med. Decis. Mak. 33 (4), 544e546.
Tsuchiya, A., Dolan, P., 2005. The QALY model and individual preferences for health states and health profiles over time: a systematic review of the literature. Med.
Decis. Mak. 25 (4), 460e467.
Viney, R., Norman, R., Brazier, J., Cronin, P., King, M., Ratcliffe, J., Street, D., 2014. An Australian discrete choice experiment to value EQ-5D health states. Health